Containers
Under the hood: FireLens for Amazon ECS Tasks
September 8, 2021: Amazon Elasticsearch Service has been renamed to Amazon OpenSearch Service. See details.
Recently, Amazon ECS announced support for custom log routing via FireLens. FireLens makes it easy to use the popular open source logging projects Fluentd and Fluent Bit; enabling you to send logs to a wide array of AWS Services and partner destinations.
In this post, I detail how and why we built FireLens. I also share some results from my use of FireLens, and provide recommendations for configuring it. This post is a deep dive on FireLens, Fluent Bit, and Fluentd. If you’re not familiar with Fluentd or Fluent Bit, you may want to familiarize yourself with them and the FireLens documentation before reading on.
What this post covers
- Why we built FireLens
- How FireLens works
- My experience using FireLens – Reliability and Recommendations
At AWS, our new features are driven by conversations with our customers. You can participate in this process by creating and commenting on issues in our public containers roadmap. The feedback we received on application logging was distilled into the following requirements:
- Support a wide-array of AWS Services as log destinations. From CloudWatch, to Amazon Elasticsearch Service and Amazon S3 with Amazon Athena, AWS provides multiple services, which can store and search your application logs.
- Require no additional configuration beyond the Task Definition. No one wants to worry about installing, configuring, and troubleshooting logging agents. No one wants to sift through documentation to find their use case. An ideal solution would simply have a set of examples for common use cases, which can be used as-is!
- Use Open Source for extensibility. If your use case is not supported, simply contribute changes or plugins to Fluentd or Fluent Bit. There’s no need to involve us 🙂
- Decorate logs with ECS Metadata. Log messages should be able to identify the AWS resources that created them.
- Observability on the performance of the log solution. You can enable logging for the Fluentd or Fluent Bit container, inspect resource usage, and obtain log delivery metrics. This is in contrast to Docker Log Drivers, which are “hidden” inside of the Docker Daemon.
- Facilitate partner integration. Since the announcement of the FireLens Public Preview, we’ve seen many of our partners add support for Fluentd and Fluent Bit. We’re pleased that FireLens is driving new contributions in open source!
From those use cases, it was clear we needed to build a solution based on Fluentd and Fluent Bit. Fluent Bit is our recommendation- because its resource utilization is considerably less than Fluentd. We support Fluentd because it’s an established tool with hundreds of plugins. Long term, we hope that FireLens energizes the open source community to add many of the features and all of the destinations that Fluentd supports in Fluent Bit. We will play a role in this by continuing to contribute plugins and improvements to Fluent Bit.
Why not simply recommend Fluentd and Fluent Bit? Why FireLens?
Fluentd and Fluent Bit are powerful, but large feature sets are always accompanied by complexity. When we designed FireLens, we envisioned two major segments of users:
- Those who want a simple way to send logs anywhere, powered by Fluentd and Fluent Bit.
- Those who want the full power of Fluentd and Fluent Bit, with AWS managing the undifferentiated labor that’s needed to pipe a Task’s logs to these log routers.
Our answer for the first group is best demonstrated by the GitHub repository of examples that we have created. Most of these examples only require configuration in the Task Definition, and they can be used with minor modification by anyone. They are straightforward to use, and require no knowledge of Fluentd and Fluent Bit.
Our solution for the second group is shown in the options field of the FireLensConfiguration object in the task definition:
To serve any advanced use case, you can pull an entire Fluentd or Fluent Bit config file from S3. This will be included with the configuration that ECS generates for you- more on that in the next section.
Storing the config file in S3 makes updates easier. I’ve personally found this very useful when testing out configurations. Before FireLens I always baked my config file into my Fluentd or Fluent Bit image- if I needed to change my configuration, I had to re-build my image and re-push it to Amazon ECR. With FireLens, I simply edit the file and re-upload to S3; when my tasks launch they automatically pull the new configuration.
Will you support other log routing projects?
We hope FireLens energizes the open source community to contribute more plugins and improve Fluentd & Fluent Bit. Standardization on those projects will help focus community efforts; fragmentation of features between many projects is not ideal. That being said, the interface for FireLens is minimal- other projects could be supported. If another open source logging project becomes dominant and is heavily requested by our customers, then we will support it.
How FireLens works
Is it a Docker log driver?
No. The awsfirelens log driver is syntactic sugar for the Task Definition; it allows you to specify Fluentd or Fluent Bit output plugin configuration.
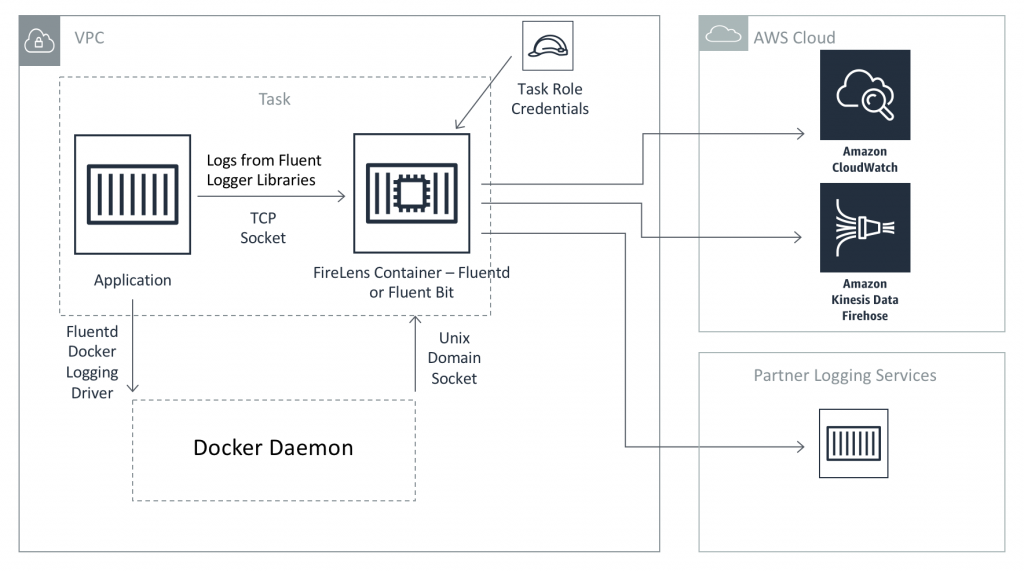
FireLens internals
The diagram above shows how FireLens works. Container standard out logs are sent to the FireLens container over a Unix socket via the Fluentd Docker Log Driver. The driver supports both tcp and Unix sockets; we chose Unix socket because it is the faster and more performant option. In addition, the FireLens container listens on a tcp socket for Fluent forward protocol messages– this allows you to tag and send logs from your application code using the Fluent Logger Libraries.
Generating Fluent Configuration
When the ECS Agent launches a Task that uses FireLens, it constructs a Fluent configuration file with the following parts:
- The log sources. These are the Unix and tcp sockets mentioned above.
- Transformer to add ECS Metadata. Unless you opt out, we use the record transformer plugin to add metadata to every log object.
- Optional User provided configuration. If you specify your own configuration file, we use the include directive to import it in the generated configuration file.
- Log sinks derived from the Task Definition. The configuration options you specify with the
awsfirelenspseudo-driver are converted to Fluentd or Fluent Bit output plugin configurations.
The configuration file is generated using our Golang Fluent Config Generation Project. You can view this generated configuration file after you launch an ECS Task with FireLens that uses the EC2 launch type. The configuration files are stored on the host, at the path specified by the value of the environment variable ECS_HOST_DATA_DIR. By default, this variable is set to /var/lib/ecs.
You can find the generated configuration file for your task at the following path on your EC2 instance:
You can see sample FireLens Fluentd and Fluent Bit configurations and their Task Definitions here.
The generated config file is mounted into your log routing container at the following paths:
- Fluentd:
/fluentd/etc/fluent.conf - Fluent Bit:
/fluent-bit/etc/fluent-bit.conf
These are the default config file paths used by the official Fluentd and Fluent Bit images. Any Fluentd or Fluent Bit container image can be used with FireLens as long as it uses those default paths.
Implications of Config Ordering- One reason to use Fluent Bit

Fluent Bit internal log processing pipeline
The diagram above shows the internal log processing pipeline for Fluent Bit. This ordering is always enforced, regardless of the order of sections in the configuration file. This is very convenient for FireLens users. It means that you can add log sources, filters, and outputs to your optional extra config file.
Recall the config file ordering from earlier:
- The log sources.
- Transformer to add ECS Metadata.
- Optional User provided configuration.
- Log sinks derived from the Task Definition.
If the user provided Fluent Bit config file includes a log source, ECS Metadata will be added to the logs it ingests even though the source comes after the ECS Metadata transformer. It also means that you can easily send logs to multiple destinations. You can even split these multiple outputs between the Task Definition and you optional config; one can come from the Task Definition log configuration section, and others can be present in your config. I’ve created an example that demonstrates this here.
Neither of the above are possible with Fluentd. Log messages flow through a Fluentd config file in the order that sections appear, and they are sent to the first output that matches their tag.
Log Tagging in the generated config file
Fluentd and Fluent Bit route log events via tags- each log message has a tag, and each configuration section includes a pattern, which determines which tags it will be applied to. As you can see in the examples, the record modifier that adds ECS Metadata matches * for Fluent Bit and ** for Fluentd. This means that all logs have ECS Metadata added (with the caveat noted for Fluentd in the previous section that not all events “pass through” this section). See the Fluentd documentation for an explanation on why ** is needed.
The log outputs generated from the Task Definition match <container name>-firelens* and <container name>-firelens**. So, if you’re using Fluent Bit and your container name is app, the match pattern is app-firelens*.
Container standard out logs are tagged with <container name>-firelens-<task ID>. So if your container name is app and your Task ID is dcef9dee-d960-4af8-a206-46c31a7f1e67, the tag is app-firelens-dcef9dee-d960-4af8-a206-46c31a7f1e67.
The CloudWatch plugins for Fluentd and Fluent Bit both allow you to auto-create a log stream named by the log tag. Thus, your log stream can be named based on the container and task which its logs originated from.
Let’s use this information to accomplish something cool. Recall from the FireLens documentation that ECS injects the environment variables FLUENT_HOST and FLUENT_PORT (when you use the bridge or awsvpc network mode), which allow you to connect to the TCP port, which your log router is listening at.
Use the FireLens CloudWatch example task definition; with the following log configuration:
You can then use a Fluent Logger Library in your application code; example code for the Python logger library is shown below:
from fluent import sender
# connect to FireLens log router
# container name is 'app'
logger = sender.FluentSender('app-firelens', host=os.environ['FLUENT_HOST'], port=int(os.environ['FLUENT_PORT']))

# send a debug message with tag app-firelens.debug
logger.emit('debug', {'log': 'debug info'})

# send an error message with tag app-firelens.error
logger.emit('error', {'log': 'Error: Something went wrong'})
In the log group firelens-blog, you get separate log streams for the debug and error messages because each are tagged differently.
My experience using FireLens: reliability and recommendations
During the development of FireLens and the AWS Fluent Bit plugins, I wanted to test that they could reliably delivery my logs to destinations and would be tolerant against scenarios that could cause log loss. I also was interested in understanding the resource usage of Fluent Bit with the AWS plugins under various loads. To this end, I performed some experiments.
Please note that these results do not represent a guarantee. Your results may differ. I merely want to share my experience as a FireLens and Fluent Bit user.
Reliability
Reliability is key for any logging solution. There are many situations that can lead to log loss: misconfiguration of permissions or network, a lapse in availability of the destination service, etc. With FireLens, the most common cause of log loss will be task termination. When your task dies, the FireLens side-car container stops, and any unsent logs are lost forever. This can be mitigated by configuring Fluentd or Fluent Bit with a persistent file buffer, however, that option is not available on Fargate (no persistent storage) and necessitates a cumbersome process of collecting logs from the unsent file buffers after task termination.
Ideally, all logs should be sent by the time the logging side-car is terminated. To test this, I created a fake application that logs predictable events, which can later be counted at the log destination. This logger emits logs at a configurable rate per second for 1 minute. It then immediately exits.
Before we analyze the results of my tests, we must understand what happens when a Task shuts down.
Unless overridden with our Container Dependency feature, ECS ensures that the FireLens container starts first and stops last. (More precisely, it will start before any containers that use the awsfirelens log driver, and will stop after any containers that use the awsfirelens log driver).
So in my log loss test, the app container exited first. Since it is essential, this will trigger the Task to terminate. The ECS Agent then sends a SIGTERM to the Fluent Bit/FireLens container, notifying it that it should clean up and prepare to shut down. Then, 30 seconds later it will send a SIGKILL, forcibly stopping the container. (This 30 second timeout is called a “grace period” and is configurable in ECS on EC2).
However, while performing these tests, I discovered that Fluent Bit by default only waits 5 seconds after receiving a SIGTERM before shutting itself down. This means that it is not using the full 30 seconds that it is allowed. I also discovered that by default, Fluent Bit tries to flush logs to the output plugins every 5 seconds. For each flush, the AWS plugins can and will make multiple API calls. However, we can improve throughput by decreasing this interval.
Both of these settings can be changed with the Service section of the Fluent Bit configuration file. The Grace setting configures the SIGTERM timeout, and the Flush setting configures the flush interval.
I performed tests with both the default Fluent Bit settings, and with these “optimized” settings. You can see all of the code for my performances tests here. The tests were performed under the following conditions:
- The tasks ran on a c5.9xlarge Amazon EC2 instance.
- Every Task used the Amazon VPC network mode, so that each got its own Elastic Network Interface.
- The application container outputted logs for 1 minute and then exited.
- I used the task level CPU and Memory settings; each task was given 1 GB of memory and 0.5 vCPU.
- Tests were performed with Kinesis Data Firehose and CloudWatch Logs as destinations. For Kinesis Data Firehose I increased the throughput limit on my delivery stream to 30,000 records per second (the default is 1000 in most regions). It should be noted that most FireLens users will need to request limit increases in order to use Kinesis Data Firehose for their logs.
- For each log emission rate, I ran 5 test cases.
FireLens Log Loss Test with Fluent Bit Default Settings
| Total Logs Emitted in 1 minute | Log Lines per second | Logs Delivered Successfully – CloudWatch AVERAGE | Logs Delivered Successfully – CloudWatch MIN | Logs Delivered Successfully – Firehose AVERAGE | Logs Delivered Successfully – Firehose MIN |
| 25 MB | 1,000 | 100% | 100% | 100% | 100% |
| 50 MB | 2,000 | 100% | 100% | 100% | 100% |
| 75 MB | 3,000 | 100% | 100% | 100% | 100% |
| 101 MB | 4,000 | 100% | 100% | 100% | 100% |
| 126 MB | 5,000 | 100% | 100% | 100% | 100% |
| 151 MB | 6,000 | 100% | 100% | 100% | 100% |
| 176 MB | 7,000 | 100% | 100% | 99.98% | 99.91% |
| 201 MB | 8,000 | 100% | 100% | 95.03% | 86.61% |
| 226 MB | 9,000 | 100% | 100% | 99.97% | 99.93% |
| 251 MB | 10,000 | 98.27% | 94.86% | 94.62% | 74.36% |
| 277 MB | 11,000 | 99.46% | 97.30% | 96.41% | 89.46% |
| 302 MB | 12,000 | 92.76% | 85.05% | 99.08% | 95.48% |
| 327 MB | 13,000 | 99.93% | 99.63% | 98.39% | 91.95% |
| 352 MB | 14,000 | 98.35% | 91.80% | 98.38% | 91.95% |
| 377 MB | 15,000 | 98.82% | 94.15% | 95.79% | 82.24% |
MIN is the worst performing test case out of the 5 total test runs.
FireLens Log Loss Test with Fluent Bit “Optimized” Settings
| Total Logs Emitted in 1 minute | Log Lines per second | Logs Delivered Successfully – CloudWatch AVERAGE | Logs Delivered Successfully – CloudWatch MIN | Logs Delivered Successfully – Firehose AVERAGE | Logs Delivered Successfully – Firehose MIN |
| 25 MB | 1,000 | 100% | 100% | 100% | 100% |
| 50 MB | 2,000 | 100% | 100% | 100% | 100% |
| 75 MB | 3,000 | 100% | 100% | 100% | 100% |
| 101 MB | 4,000 | 100% | 100% | 100% | 100% |
| 126 MB | 5,000 | 100% | 100% | 100% | 100% |
| 151 MB | 6,000 | 100% | 100% | 100% | 100% |
| 176 MB | 7,000 | 100% | 100% | 100% | 100% |
| 201 MB | 8,000 | 100% | 100% | 100% | 99.99% |
| 226 MB | 9,000 | 100% | 100% | 99.97% | 99.94% |
| 251 MB | 10,000 | 99.96% | 99.94% | 99.98% | 99.96% |
| 277 MB | 11,000 | 99.99% | 99.95% | 99.99% | 99.95% |
| 302 MB | 12,000 | 99.98% | 99.95% | 99.98% | 99.96% |
| 327 MB | 13,000 | 99.98% | 99.95% | 99.98% | 99.95% |
| 352 MB | 14,000 | 99.98% | 99.96% | 99.98% | 99.96% |
| 377 MB | 15,000 | 99.97% | 99.96% | 99.85% | 99.31% |
The optimized settings clearly increase performance. The difference in results is most noticeable for the MIN value- the optimized settings provide more consistent results.
The CloudWatch Fluent Bit plugin very slightly outperforms the Firehose plugin in both testing scenarios. This is probably because the CloudWatch PutLogEvents API accepts 10,000 events per request, while the Firehose PutRecordBatch API only accepts 500. I suspect that each request adds a small amount of overhead; thus larger API batch sizes result in slightly higher throughput.
However, all in all, the results are very good even with the default settings. Many applications will not output logs at the rate needed to see a benefit from the optimized settings. However, for those applications that do output logs at a high rate, using these settings is encouraged.
As of version 1.3.2 of the AWS for Fluent Bit image, I have baked the “optimized” configuration file in the image at the path /fluent-bit/configs/minimize-log-loss.conf. You can use it with FireLens by adding the following section to the container definition for your Fluent Bit container:
While the results of those tests were satisfactory, I was curious about the memory usage of the Fluent Bit container. In order to successfully send all those logs, was its memory usage spiking significantly? So I performed the tests with default settings again, but this time set a hard memory limit of 100 MB on the Fluent Bit container. This means that if it exceeds 100 MB of memory usage, it would get OOM-Killed, and logs would be lost.
FireLens Log Loss Test with Fluent Bit Default Settings – 100 MB Hard Memory Limit
| Total Logs Emitted in 1 minute | Log Lines per second | Logs Delivered Successfully – CloudWatch AVERAGE | Logs Delivered Successfully – CloudWatch MIN | Logs Delivered Successfully – Firehose AVERAGE | Logs Delivered Successfully – Firehose MIN |
| 25 MB | 1,000 | 100% | 100% | 100% | 100% |
| 50 MB | 2,000 | 100% | 100% | 100% | 100% |
| 75 MB | 3,000 | 100% | 100% | 100% | 100% |
| 101 MB | 4,000 | 100% | 100% | 100% | 100% |
| 126 MB | 5,000 | 100% | 100% | 100% | 100% |
| 151 MB | 6,000 | 100% | 100% | 100% | 100% |
| 176 MB | 7,000 | 100% | 100% | 100% | 100% |
| 201 MB | 8,000 | 100% | 100% | 63.82% | 54.78% |
| 226 MB | 9,000 | 94.29% | 71.46% | 80.75% | 56.50% |
| 251 MB | 10,000 | 54.95% | 38.16% | 42.29% | 29.97% |
The results indicate that up to 7,000 log lines per second, Fluent Bit can send logs to AWS destinations while consuming less than 100 MB of memory. Interestingly, the Firehose plugin once again performs slightly worse than the CloudWatch plugin. The results strongly suggest that the Firehose plugin is more readily OOM-Killed than the CloudWatch plugin. This is probably once again due to its smaller API batch size; the in-memory buffer is filled more quickly because logs are being sent slower.
Future Improvements
Based on these results, I’ve opened two issues for improvements:
- Batch multiple log lines into a single record in Fluent Bit Firehose Data Streams plugin – amazon-kinesis-firehose-for-fluent-bit#12
- Set Grace to 30 when FireLens users do not specify a custom config – containers-roadmap#579
Resource Usage
Fluent Bit CloudWatch
| Log Lines Per second | Data Out | Fluent Bit CPU (vCPU/CPU Thread) | Fluent Bit Memory |
| 100 | 25 KB/s | 0.30% | 27 MB |
| 1000 | 250 KB/s | 3% | 44 MB |
| 10000 | 2.5 MB/s | 19% | 65 MB |
Fluent Bit Data Firehose
| Log Lines Per second | Data Out | Fluent Bit CPU (vCPU/CPU Thread) | Fluent Bit Memory |
| 100 | 25 KB/s | 0.30% | 27 MB |
| 1000 | 250 KB/s | 3.30% | 37 MB |
| 10000 | 2.5 MB/s | 13% | 55 MB |
Tests were run on a c5.9xlarge Amazon EC2 instance.
These results from my resource utilization tests were already published in Centralized Container Logging. I suggest using them to estimate the Task Size, which you will need on Fargate when you use FireLens. You can also use these values to set the CPU and memoryReservation fields in your FireLens container definition. I recommend against setting a hard memory limit with the memory field however; Fluent Bit and Fluentd’s memory usage can occasionally spike, and this will cause your container to get OOM Killed. Since the FireLens container must be essential- this will kill your task. As shown in the previous section on log loss, Fluent Bit can process logs at a high rate without using more than 100 MB of memory. However, it is still safer to not use a hard memory limit.
Finally, I ran a FireLens Task that uses Fluent Bit to send logs to Kinesis Data Firehose. I let this Task run for two weeks, to ensure that its memory usage remained stable over time. The results verify that there are no long term memory leaks or other issues; it is stable over time. This is to be expected- Fluent Bit is an established tool with a size-able user base.

FireLens Fluent Bit Memory Usage over 2 weeks
Conclusion
In this post, you learned why we built FireLens, and how it works. Knowing how it works, you learned tips on how to write custom configuration files for Fluentd and Fluent Bit. Finally, you learned the results of my resource usage and log loss tests, from which you learned tips on provisioning resources for your log router, and optimize for reliability.
We would like your feedback as we continue to optimize the logging experience for AWS Containers customers. What should we add to FireLens or to our Fluent Bit integration? Please open issues or comment on GitHub at our aws/container-roadmap and aws/aws-for-fluent-bit repositories. We take feedback received there seriously; the number of +1s and comments on issues help us determine which features are most important to our customers.
Finally, AWS re:Invent 2019 is around the corner. If you are attending, consider signing up for one of the following sessions on FireLens and Fluent Bit. They will be led by myself and Eduardo Silva, creator of Fluent Bit.