The Internet of Things on AWS – Official Blog
Use AWS IoT Device Management fleet indexing to identify and visualize fleet state
Note: This article references Node.js 8.10 (now deprecated) and Amazon CloudWatch Events (now Amazon EventBridge) – please use Node.js 20.x+ runtime and Amazon EventBridge console for current implementations.
In this blog post, we’ll show you how to use new capabilities of AWS IoT Device Management fleet indexing. Starting now, you can use aggregation queries in conjunction with AWS Lambda and Amazon CloudWatch to automate fleet monitoring.
When managing Internet of Things (IoT) devices, it can be challenging to monitor the state of the fleet. The complexity is due to many factors: the number of devices, number of dynamic states to monitor, and number of notification mechanisms for fleet state change. AWS IoT Device Management is a service that enables you to onboard, organize, monitor, and manage remotely connected devices at scale.
Within AWS IoT Device Management, fleet indexing allows you to index the registry, device shadow, and connection state for every device in your fleet, and search for devices based on any combination of these attributes. You can use fleet indexing to query which devices are running a particular version of firmware, or to query which devices are actively connected to AWS IoT services.
At a high level, this blog post walks through four steps:
- Enable fleet indexing.
- Define AWS Identity and Access Management (IAM) role and permissions for the Lambda function.
- Define and configure the Lambda function.
- Build fleet management dashboard and configure alarms using CloudWatch.
The blog post uses the AWS Management Console to execute the steps. You can also execute the same steps by using the AWS Command Line Interface (AWS CLI).
Enable fleet indexing
You can enable fleet indexing by choosing Settings in the AWS IoT Device Management console. Be sure that thing connectivity indexing is enabled, as we’ll be using connectivity fields in the aggregation queries.

Using aggregation count queries
In the AWS IoT Device Management console, choose Things, Search Things to test the aggregation query before building the Lambda function. The following is an example request and response.

You can change the query string to include any registry or shadow parameters.
IAM role definition for the Lambda function
The Lambda function needs permissions to publish metrics to CloudWatch, and to allow iot::GetStatistics action on the index resource. These permissions are additional to the standard Lambda permission to publish logs to CloudWatch to debug runtime issues with the Lambda function.
GetStatistics permission is required to run aggregation queries. There are two steps for this permission definition: first, a policy needs to be created, then a role can be created and the policy in the first step can be attached to the role.
CREATE POLICY
The policy needs permissions to publish the CloudWatch logs, publish CloudWatch metrics, and allow the iot:GetStatistics action on the index resource. Create the policy in the IAM console by choosing Policies, Create Policy.
Let’s us create a policy named IoTFleetMetricPublishPolicy. The following JSON document can be used to define the policy. Replace ACCOUNT_ID with an actual account ID.
{
    "Version": "2012-10-17",
       "Statement": [
            {
                "Effect": "Allow",
                "Action": "cloudwatch:PutMetricData",
                "Resource": "*"
            },
            {
                "Effect": "Allow",
                "Action": [
                    "iot:GetStatistics"
                ],
                "Resource": "arn:aws:iot:*:ACCOUNT_ID:*"
            },
            {
                "Effect": "Allow",
                "Action": [
                    "logs:CreateLogGroup",
                    "logs:CreateLogStream",
                    "logs:PutLogEvents"
                ],
                "Resource": "arn:aws:logs:*:*:*"
            }
    ]
}
CREATE ROLE
In this step, a new role named IoTFleetMetricPublishRole will be created, and the IoTFleetMetricPublishPolicy created in the previous step will be attached to the role. Create the role in the IAM console by choosing Roles, Create role.
Select AWS Lambda as the service that will use this role

Attach IoTFleetMetricPublishPolicy to the new role

Add any optional tags

Review and create the role

Define and configure the Lambda function
In this step, we create and define a Lambda function named IoTFleetMetricPublisher. The function will query the fleet index every five minutes to find the number of connected devices, and then publish it as a metric to CloudWatch.
CREATE AND CONFIGURE THE LAMBDA FUNCTION
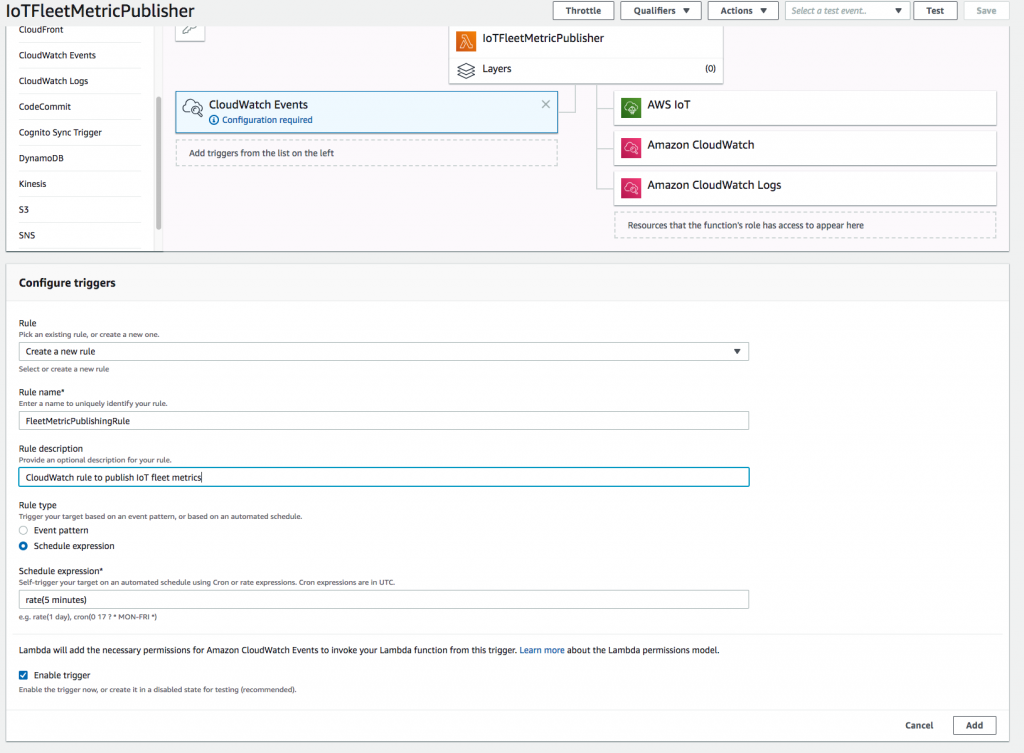
In this step, we create a Lambda function and configure it to run every five minutes. Create the Lambda function in the Lambda console by choosing Functions, Create function.
Create the Lambda function named IoTFleetMetricPublisher

Configure the IoTFleetMetricPublisher to run every five minutes by adding an Amazon CloudWatch Events trigger
Define the lambda function
We’ll choose Node.js as the programming language for creating the Lambda function (Java and Python are the other alternatives). The Lambda function calls fleet indexing to find the number of connected devices. The result of the call is published as a CloudWatch metric named ConnectedDevices under the namespace IoTFleetManagement. The Node.js code is shown below.
// Configuring the AWS SDK
var AWS = require('aws-sdk');
// Configuring the AWS Region
AWS.config.update({ region: 'us-east-1' });
exports.handler = (event, context, callback) => {
  // Create a CloudWatch service object
  var cw = new AWS.CloudWatch({ apiVersion: '2010-08-01' });
  // Create an AWS IoT service object
  var iot = new AWS.Iot({ apiVersion: '2015-05-28' });
  var queryParams = {
    queryString: 'connectivity.connected:true'
  };
  iot.getStatistics(queryParams, function(err, data) {
    if (err) console.log(err, err.stack); // an error occurred
    else {
      console.log(data); // successful response
      // Create parameters JSON for putMetricData
      var params = {
        MetricData: [{
          MetricName: 'ConnectedDevices',
          Dimensions: [],
          Unit: 'None',
          Value: data.statistics.count
        }, ],
        Namespace: 'IoTFleetManagement'
      };

      cw.putMetricData(params, function(err, data) {
        if (err) {
          console.log("Error", err);
        }
        else {
          console.log("Success", JSON.stringify(data));
        }
      });
    }
  });
};
In this step, for Code entry type, choose Edit code inline, and for Runtime, choose Node.js 8.10. Then copy the previous code listing to the inline code editor window, as shown below.

Save the Lambda function.
Define a Lambda Layer to use the latest AWS SDK
The default version of AWS SDK available under the Lambda run time is not latest. In this step we will define a Lambda layer and associate the Lambda layer to the Lambda function. First we have to create a zip file which contains the latest AWS SDK. Execute the following commands in a command line to create the zip file.
mkdir nodejs
cd nodejs
npm init
npm install --save aws-sdk
cd ..
zip -r nodejs.zip nodejs/
After creating the zip file, you can define the Lambda Layer by choosing Lambda,Layers,Create layer. Create a Lambda layer called awsSDKLambdaLayer. Select the nodejs.zip created in the previous step for uploading.

The last step is to attach the newly created Lambda layer, awsSDKLambdaLayer to the IoTFleetMetricPublisherLambda function.


Build a fleet management dashboard and configure alarms using CloudWatch
After the previous step, Lambda will automatically start publishing the metric to Cloudwatch every five minutes. In this step, we build a dashboard and configure an alarm in CloudWatch using the metric published by the Lambda function.
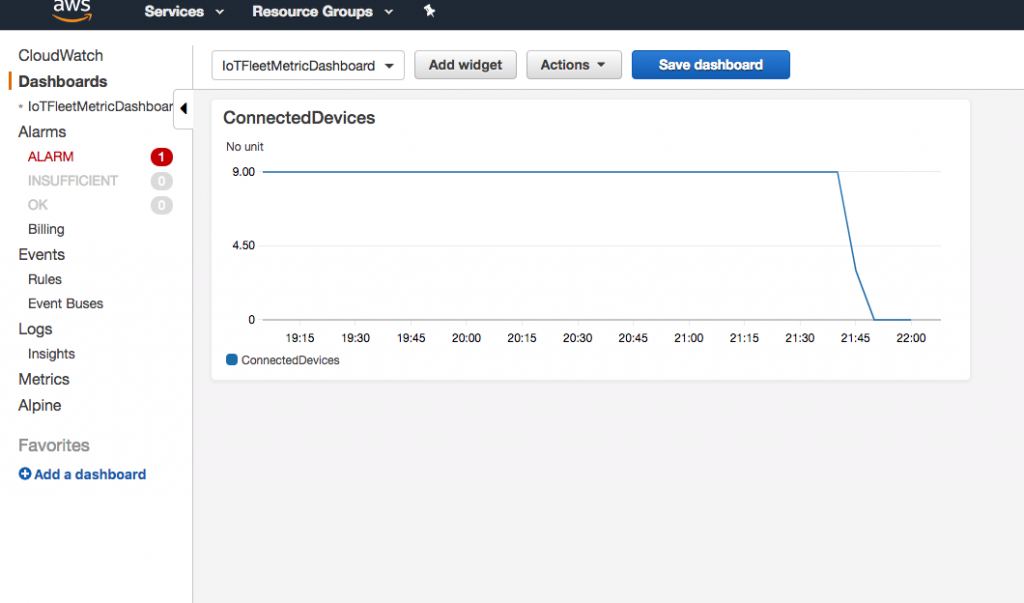
CREATE a dashboard
You can define the dashboard in the CloudWatch console by choosing Dashboards, Create Dashboard. The Create Dashboard workflow allows you to choose a name for the dashboard, and then pick the metrics to show in the dashboard.
Create an alarm on the CONNECTED DEVICES METRIC
You can create alarms in the CloudWatch console by choosing Alarms, Create Alarm. In this step, we create an alarm named ConnectedDevicesAlarm that is triggered if the number of connected devices metric falls below 5 for two data points within a 15-minute window.

Wrapping up
In this blog post, we looked at how to create an IoT fleet management dashboard. You can modify the Lambda function to specify additional queries and other metrics. Some examples of metrics you can build include finding all devices that are connected with thing “type X” and firmware “version Y”, finding all devices that are connected with battery usage more than 90 percent, or finding all devices that have shadow.reported.state.temperature greater than 50.
You can also use aggregation queries against the thing group index.
Although the example here is a start, there’s much more that AWS IoT Device Management offers to onboard, organize, monitor, and remotely manage connected devices at scale.
Learn more
AWS IoT Device Management
https://aws.amazon.com/iot-device-management
AWS IoT Device Management Features
https://aws.amazon.com/iot-device-management/features/
AWS CloudWatch
https://aws.amazon.com/cloudwatch/
AWS Lambda
https://aws.amazon.com/lambda/
AWS IAM Roles
https://aws.amazon.com/iam/