AWS Partner Network (APN) Blog
Hosting Rapidly Scaling Video Applications on Amazon EKS Clusters
By Avi Fruchter, Fellow Software Engineer at Synamedia
By Mike Miller, Sr. Technical Leader at Synamedia
 |
 |
Synamedia is the world’s largest independent video software provider, trusted by over 200 top satellite DTH, cable, telco, and OTT operators, broadcasters, and media companies.
An AWS Select Technology Partner, Synamedia helps service and content providers around the world deliver, protect, and monetize video content so they can win in the age of infinite entertainment.
To replace its self-managed Kubernetes cluster running directly on Amazon Elastic Compute Cloud (Amazon EC2) instances, Synamedia selected Amazon Elastic Kubernetes Service (Amazon EKS) for its Infinite Platform product.
This post will discuss how Amazon EKS and other elastic technologies from Amazon Web Services (AWS) maintain a consistently responsive user experience despite frequent spikes of 5x the traffic in a matter of minutes.
Traffic Demands in Digital Television
Digital television’s experience and expectations differ greatly from those of a typical web service. Most personal web applications can accept periodic performance slowdowns and even an occasional reload of a page.
When low latency is required, client-side JavaScript is generally used for the user interface (UI), and fetching new data from the server can take several seconds without negatively impacting the user experience.
Since the days of analog, TV is expected to just work, with immediate channel changes and a responsive UI. Even video-on-demand (VOD) catalogs are expected to respond quickly (generally under 300 ms), and certainly Linear (Live) TV must be responsive.
Furthermore, the demand for normal web content rises and falls relatively slowly, but Linear TV follows a fixed schedule. Broadcast events on many channels all begin at the exact same second, and millions of viewers generally begin to tune in within a matter of seconds.
This spike is far steeper than those associated with a typical web application; a 3x increase in requests in a span of seconds is not uncommon. These time periods are both the most challenging technically, as well as the most important to a broadcaster’s reputation.
The graph in Figure 1 shows the load pattern of a typical day. Note how around 18:00 there is a sharp spike, representing an increase in requests per seconds of approximately 2.5x. This corresponds with the beginning of a broadcast slot during prime time, when many users tune in at the exact start of the program.
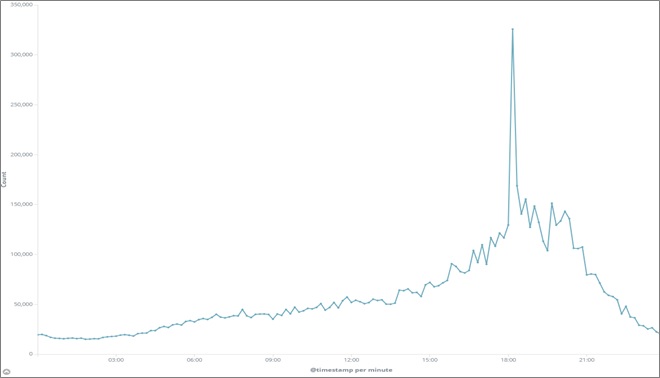
Figure 1 – TV load pattern for a typical day.
Zooming in to this spike shows the majority of the increase takes place within one minute.
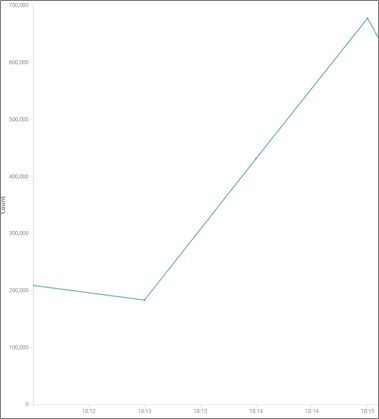
Figure 2 – Zooming into the heaviest load time.
Additionally, there are occasional unexpected moments of load. Global events and breaking news coverage often create similar, if not steeper, spikes at unexpected times. A presidential address or developing crisis triggers many subscribers to immediately tune in to their favorite news station. By definition, no one can know when this will occur.
Finally, whereas television was once primarily a broadcast (one-way) medium and the UI was identical for all users, modern solutions are heavily personalized. Users are shown their content—and content selected specifically for them–in addition to the standard, shared data. This puts a much higher load on the server than previous generation TV requirements, while performance expectations have not been lowered.
In a legacy, on-premises world, these issues were not as critical. Hardware was purchased for the largest possible load and was left running 24/7 regardless of actual demand. Using the cloud allows companies to avoid maintaining enormous data centers; however, to keep a fully-provisioned system online at all times is cost prohibitive.
Kubernetes Tools for Rapid Scaling
Kubernetes Pods are sized by setting four numbers for each Pod. A developer can (and should) set a request and limit for both CPU and memory. The scheduler guarantees that each Pod can receive no less than the requested amount of CPU and memory, while allowing the Pod to burst, subject to capacity on the node, up to the limit.
Kubernetes defines a resource called a Horizontal Pod Autoscaler (HPA), which is attached to a Deployment. In the simplest case, as the average CPU of a Deployment’s Pod rises, the HPA scales up (i.e. it increases the number of Pods in) the deployment to keep the load on each individual Pod reasonable.
This target is expressed as a percentage of the requested CPU. To prevent thrashing when the average CPU is right around the target, there’s a certain hysteresis built into the algorithm. For example, to ensure a target CPU of 70 percent (the default), it only begins scaling up when the CPU reaches 77 percent (10 percent above the target) and does not scale down until the target CPU is below 63 percent (10 percent below the target).
In addition to automatically scaling the number of Pods, Kubernetes includes a Cluster Autoscaler (CA) that automatically provisions new nodes to handle an increase in Pods. Similarly, when the number of Pods drops, the CA can combine Pods onto nodes and remove several nodes from service. When used with Amazon EKS, this is done by adjusting the desired count of the Amazon EC2 instances within an Auto Scaling group.
Challenges
These tools are powerful, but it’s not enough to simply apply an HPA and CA and expect a system to be fully responsive.
In the case of the Infinite Platform, while we have already completed a migration from monoliths to decoupled stateless microservices, several pods contained legacy applications that had been containerized using a lift and shift design. As a result, they came with certain assumptions that were not scale friendly. For example, some Pods would run a long setup procedure at the start.
While not a problem for a virtual machine (VM), by delaying the time between starting a Pod and when the Pod is ready to receive traffic, we limit our ability to rapidly scale. Examples of problematic startup steps include Java compilation and data ingest steps. Large images can also contribute to a slow startup, as it may take time to pull them from the Amazon Elastic Container Registry (Amazon ECR) for Amazon EKS.
Similarly, the default CA configuration only begins adding nodes when the first Pod is Pending, meaning that it does not have a place on the existing nodes. Until a cluster is 100 percent full (or more precisely, incapable of scheduling at least one Pod), it will not scale. In our experience, the time to add a new node averages roughly 90 seconds.
As mentioned in the introduction, a delay of 90 seconds (plus Pod startup time!) is quite fast in the scale of an entire day. However, it is unacceptable for television. In Linear broadcasts, where events on multiple channels all begin at the same time and users perform the majority of channel change operations during the interstitial commercial breaks, we need to be ready within seconds, not minutes.
Another important consideration is the size of the nodes themselves. When using instances that are relatively large, the addition of one Pod beyond the current capacity results in provisioning an entire EC2 instance, of which only a small percent might be used. Conversely, if the image type is small, and we have a mixed load of small and large Pods, a cluster can easily be both mostly empty and unable to handle new Pods at the same time.
This packing problem is a well-known issue in computer science, but Kubernetes simplifies its workload by never revisiting a scheduling decision once made. Once a Pod is assigned to a node, it remains there forever.
More precisely, the Kubernetes scheduler never attempts to move Pods. While Pods are sometimes moved between nodes as part of the CA’s attempts to shrink the number of nodes in the cluster by consolidating Pods, the only consideration here is whether it can reduce the number of nodes in use. Load and resource consumption is not taken into account, and therefore no attempt at balancing the load on each node is made.
Additionally, many systems include Daemonsets, whose purpose is to run one Pod per node. Sometimes, the size of the Daemonset Pods is fixed, but in other cases, it might vary based on the size of the node.
For example, a Daemonset that is responsible for exporting metrics like CPU usage of the node will probably have a fixed size regardless of the size of the node, whereas one responsible for collecting logs from the Pods running on the node will need to vary based on the number of Pods (or perhaps number of cycles used) on the node.
This can make mixing node sizes a tricky proposition.
Mitigation
Given these challenges, the Synamedia development team made several changes to the workload and added new techniques to our Amazon EKS clusters to make them more responsive.
First, we reviewed our Pods to ensure they’re as responsive as possible:
- We removed any unnecessary operations from Pod startup, whether remnants of a legacy VM design such as a package installation (which we moved to build time) or slow processing. For example, we’ve replaced processing compressed config data with uncompressed files, as we saw that CPU was scarcer than network I/O in our case.
. - We reviewed all of our application Pods for unneeded layers and files, to minimize the size of the images that will need to be transferred.
To avoid delays from waiting for the CA to bring up new nodes, we want to always have a certain reserve capacity of nodes available. We do this by scheduling a low-priority group of Pods that effectively act as seat-fillers.
When a regular application Pod is scheduled, the scheduler immediately evacuates one of these filler Pods, while simultaneously rescheduling it in the background (and, if necessary, triggering a scale-up of the cluster). This gives us a reasonable buffer for unexpected spikes, as well as sufficient capacity to ensure an acceptable user experience. This is referred to as headroom.
We then use pre-scaling. In order to preserve the optimal user experience during periods of known high usage (for example, prime time viewing hours), several minutes prior to an expected time of high demand we explicitly increase the number of Pods to roughly match the anticipated load.
Because we have HPAs attached to the Deployments, we can’t simply modify the Desired count, as the HPAs will put it right back. Instead, we achieve this scaling by artificially raising the min_replicas of the HPA, which tricks the HPA into creating more instances. As soon as the load rises, we can reduce the min_replicas, and the actual load will hold the scale at the appropriate level for as long as required.
These schedules are run automatically within the cluster using Kubernetes cronjobs. Note that Amazon EKS clusters always use UTC for their internal clocks.
For example, with a deployment and Pods like this:
A sample configuration might look like this:
With a cronbjob such as this, where the –1 job applies the YAML above at 1930 UTC, and the –2 job restores the default configuration:
When deciding on scaling criteria, the most important metric is the response times to the user. However, we cannot simply scale based on response time alone. In a microservice-based architecture, a front-end service may be slow because it’s overloaded, or it may be slow because it was waiting for data from a back-end component.
Simply scaling every component that is slower than expected will not necessarily target the actual bottlenecks. As such, we generally use CPU usage as our target metric. This tuning can be tricky; setting a target that is too low means we are wasting a lot of instances during steady operations in preparation for a spike that may not come, whereas setting the target too high means that a steeper spike might overwhelm the system.
Additionally, the target CPU percentage is calculated as a function of the actual CPU versus the requested CPU, and is not an absolute number. Absolute percentage is now also a possibility, since it was added in Kubernetes auto scaling v2.
Prior to deciding on a target percentage, Pods must be sized correctly. A multi-threaded or asynchronous single process server should never use more than one vCPU; allocating a full core is often excessive. Components that are lightly loaded during off-peak times should not waste two full cores (we need at least two instances to ensure high availability), and other components begin to exhibit performance degradations before reaching 100 percent of a vCPU.
Sometimes this is due to an easily removed bottleneck such as a connection pool, but other cases are not as easily remedied. In practice, most of our Node.js workloads request 500 millicores, which is roughly the point where response time begins to increase even before any CPU throttling is seen.
Similarly, Pods containing many containers scale based on the average of all containers (even though the CPU request is set per-container), and if the balance between the different containers is not consistent, the HPA does not correctly identify the actual bottleneck. This can often occur when running sidecars for functions like logging or metrics.
In these cases, we made sure to decouple all containers that do not scale in lockstep. By running our caches separately from the backends, we can ensure both scale appropriately regardless of whether a specific period is predominantly served by the cache, or whether we’re experiencing frequent cache misses that are forwarded to the business logic containers, with the accompanying load on the backend.
Below are illustrations of a typical unexpected load period where an individual POD was able to scale up by more then 100 percent (from 42 instances to 113 instances) in a short duration, even before the cluster scaled the nodes to handle the increase.
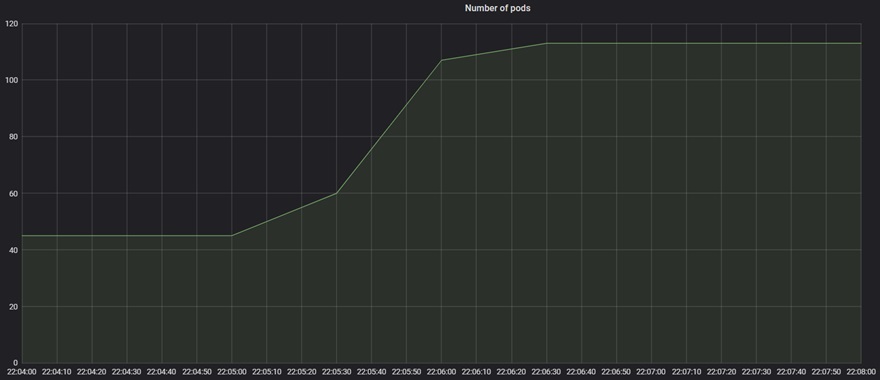
Figure 3 – Unexpected major spike that increased individual service by over 100 percent.
Next, you can see the autoscaler did scale the cluster, in an expected delay of over a minute. Note there was still the need to scale for the headroom nodes that were evicted (to be ready for another unexpected load).
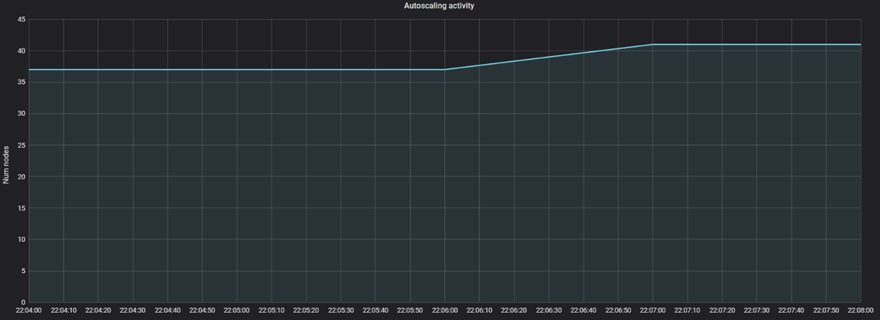
Figure 4 – Nodes scaled when headroom pods were evicted.
Conclusion
We started with a custom orchestration of Kubernetes on Amazon EC2 machines. While we could have continued to develop and maintain this, moving to Amazon EKS allowed us to free up resources and focus on our product and not our infrastructure.
Because Amazon EKS is a full implementation of Kubernetes, Synamedia was able to maintain a unified orchestration with our on-premises customers (who obviously need a local installation of Kubernetes). Although we did need to supplement the default EKS scaling tools, the unique challenges we faced would have required this work in any case, and EKS gave us an excellent framework upon which to add our scaling additions.
Similarly, prior to the move to EKS, we were managing our Amazon EC2 scaling manually. While technically sufficient, the extra effort involved in the manual work meant that inevitably, the scaling was never done promptly.
Furthermore, hesitancy over manual recovery (for example, if we scale down too much and someone needs to be paged and woken to spin up new nodes) meant we were often overcautious when we did scale. By using the Amazon EKS that provides the Kubernetes standard cluster autoscaler integrated with the EC2 Auto Scaling Group, we were able to be both more aggressive and more confident in sizing decisions.
Having converted several production workloads to EKS already, we can confirm this is not just a theory; we do indeed see reliability improvements as well as cost savings over our previous, self-managed, model. Removing the human factor has saved us at least 20 percent on our cluster costs, in addition to the obvious savings of not needing to maintain our own orchestration.
The content and opinions in this blog are those of the third-party author and AWS is not responsible for the content or accuracy of this post.
.

.
Synamedia – AWS Partner Spotlight
Synamedia is an AWS Select Technology Partner that helps service and content providers deliver, protect, and monetize video content so they can win in the age of infinite entertainment.
Contact Synamedia | Partner Overview
*Already worked with Synamedia? Rate the Partner
*To review an AWS Partner, you must be a customer that has worked with them directly on a project.