AWS Partner Network (APN) Blog
How to Monitor Amazon CloudWatch Synthetics from Dynatrace
By Philipp Kastner, Technical Product Manager at Dynatrace
By Shashiraj Jeripotula, Sr. Partner Solutions Architect at AWS
 |
Amazon CloudWatch Synthetics monitors your RESTful APIs, URLs, and website content endpoints via synthetic traffic (canaries) every minute, 24×7. It alerts you when your application endpoints don’t behave as expected.
CloudWatch Synthetics enables you to continually verify your customer experience even when there is no customer traffic on your applications. This lets you discover issues before your customers do, and react quickly to fix them.
Learn more about Amazon CloudWatch Synthetics in this AWS blog post by Jeff Barr.
Dynatrace also offers powerful, integrated synthetic capabilities. However, if you use both CloudWatch and Dynatrace, you have to switch between their consoles to check status.
You can now integrate CloudWatch Synthetics into Dynatrace so you can check for unexpected behavior across both platforms from a single dashboard in your Dynatrace account. You can do so without switching back and forth between consoles.
In addition to offering fully integrated synthetic capabilities, Dynatrace also offers an API that displays results from CloudWatch Synthetics within the Dynatrace console. In this post, we show you how to integrate CloudWatch Synthetics into Dynatrace and monitor both directly from a Dynatrace account.
Dynatrace is an AWS Partner Network (APN) Advanced Technology Partner with AWS Competencies in DevOps, Migration, and Containers. Dynatrace provides software intelligence to simplify enterprise cloud complexity and accelerate digital transformation.
Customer Value
Until now, you had to sign into the AWS Management Console to work with Amazon CloudWatch Synthetics.
With the ability to embed CloudWatch Synthetic data in Dynatrace, you can do more with your synthetic results. For instance, you can make them part of Dynatrace’s AI-powered root cause detection—the Davis artificial intelligence (AI) engine. When a problem occurs, the Davis AI engine automatically correlates CloudWatch Synthetic data.
Integrating existing CloudWatch Synthetic canaries with Dynatrace provides several additional benefits. You can cover more advanced use cases like the broken link checker offered by Amazon CloudWatch Synthetics.
Ingested CloudWatch Synthetic data behaves in Dynatrace just like all other synthetic solutions. It shows up in the same list as other solutions in the Dynatrace menu. This means you can monitor and explore CloudWatch Synthetic data directly within Dynatrace.
You can also chart metrics, visualize them via dashboards, and even create custom alerts and reports based on those metrics.
Solution Overview
Amazon CloudWatch Synthetics enable you to create canaries to monitor your endpoints and APIs.
Canaries are configurable scripts that follow the same routes and perform the same actions as a customer. This enables the outside-in view of your customer experiences, and your service availability from their point of view.

Figure 1 – How canaries monitor for unauthorized changes.
Walkthrough
Our walkthrough has the following sections:
- Prerequisites
- Configuring Dynatrace
- Configuring Amazon CloudWatch Synthetics
- Working with canary data in Dynatrace
- Troubleshooting
Prerequisites
Before you configure Dynatrace, make sure you have access to these accounts:
- AWS account
- Amazon CloudWatch console with permissions to manage CloudWatch Synthetics
- Dynatrace account with permissions to configure CloudWatch Synthetics
Configuring Dynatrace
- Open a new browser and log in to your Dynatrace environment; for example, https://DOMAINNAME.live.dynatrace.com/.
- Generate an API token.
- In the left navigation bar, under Dynatrace menu, go to Settings > Integration, and choose Dynatrace API.
- Choose Generate Token, and enter a name (for example, Amazon CloudWatch Synthetic Integration).
- To define the access scope of your Dynatrace API token, select the switch titled Create and read synthetic monitors, locations, and nodes, and then click Generate. You can find additional details in the Dynatrace documentation about generating API tokens.

Figure 2 – Creating an API token.
- In the left navigation, under the Dynatrace menu, choose Synthetic.
- Choose the Create a Synthetic Monitor button, and follow the Explore the Options link.
- Select the Amazon CloudWatch button from the section titled “Import synthetic data from.”
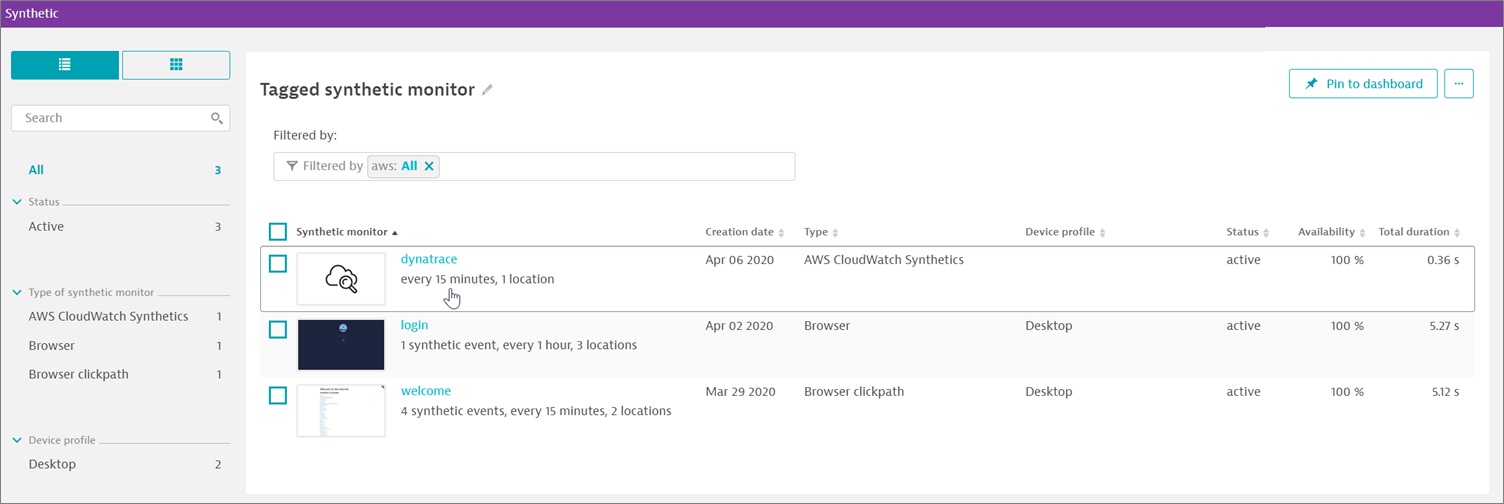
Figure 3 – Importing Synthetic data from Amazon CloudWatch.
Configuring Amazon CloudWatch Synthetics
Follow these steps to configure Amazon CloudWatch Synthetics:
- Log in to the AWS console and navigate to Amazon CloudWatch.
- From the CloudWatch menu, select Synthetics > Canaries.
- Create a new canary or edit an existing one.
- To create a new canary, go to the Dynatrace GitHub repository and follow the instructions in the
ReadMe.mdfile. - If you prefer to edit one of the existing canaries in the Synthetics window, be sure to add the Dynatrace exporter (
dynatrace-canary-exporter.js) to the end of the script.
- To create a new canary, go to the Dynatrace GitHub repository and follow the instructions in the
- Make sure to adapt these variables to your environments:
dynatraceHost(for example,dynatraceHost = soddgwvydy.live.dynatrace.com), but replacesoddgwvydywith your Dynatrace environment ID.dynatraceApiToken(use the API token generated in the preceding section).
Working with Canary Data in Dynatrace
If you navigate to the Synthetic monitor list in Dynatrace (Dynatrace menu > Synthetic), the canaries show up in Dynatrace as soon as they are executed. Amazon CloudWatch Synthetics are displayed next to all other synthetic monitors in Dynatrace.
Figure 4 – Amazon CloudWatch Synthetics displayed in Dynatrace menu.
The synthetics from Amazon CloudWatch behave like other synthetics in Dynatrace. You can examine their details and connect web applications to see Real User Monitoring (RUM) data next to synthetic data, as well as the reverse.
You can also define alerts. They are automatically picked up by the Davis AI engine and correlated to other problems happening in your Dynatrace environment.
With Dynatrace, you can group canaries together into one entity, even if they are executed in different AWS regions.
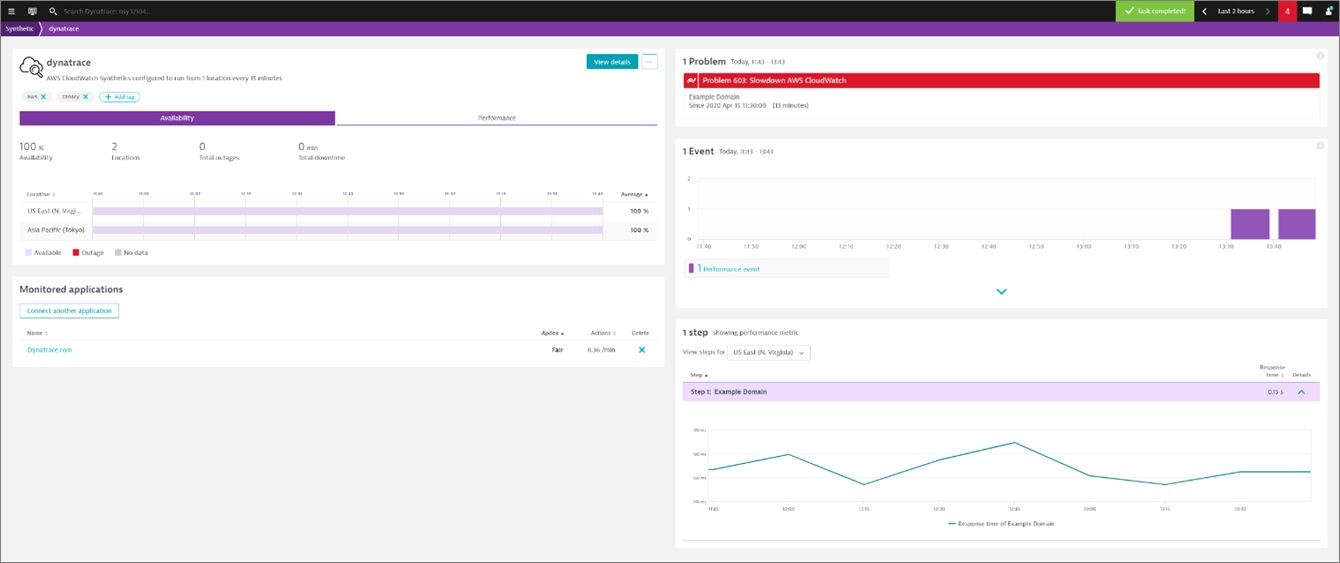
Figure 5 – Group canaries into one entity.
You can display the CloudWatch Synthetics in Dynatrace charts, as well as put them on your dashboards.
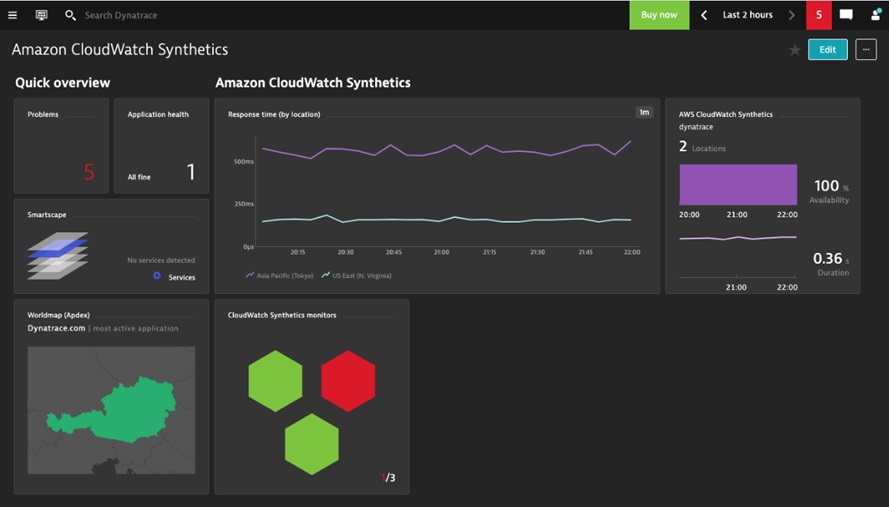
Figure 6 – Charting Amazon CloudWatch Synthetics.
Troubleshooting
If canary data does not show up in Dynatrace, make sure the Dynatrace host and API token parameters in the canary are correct. Then, check the canary log for potential error messages. For example, a canary with an invalid Dynatrace token.
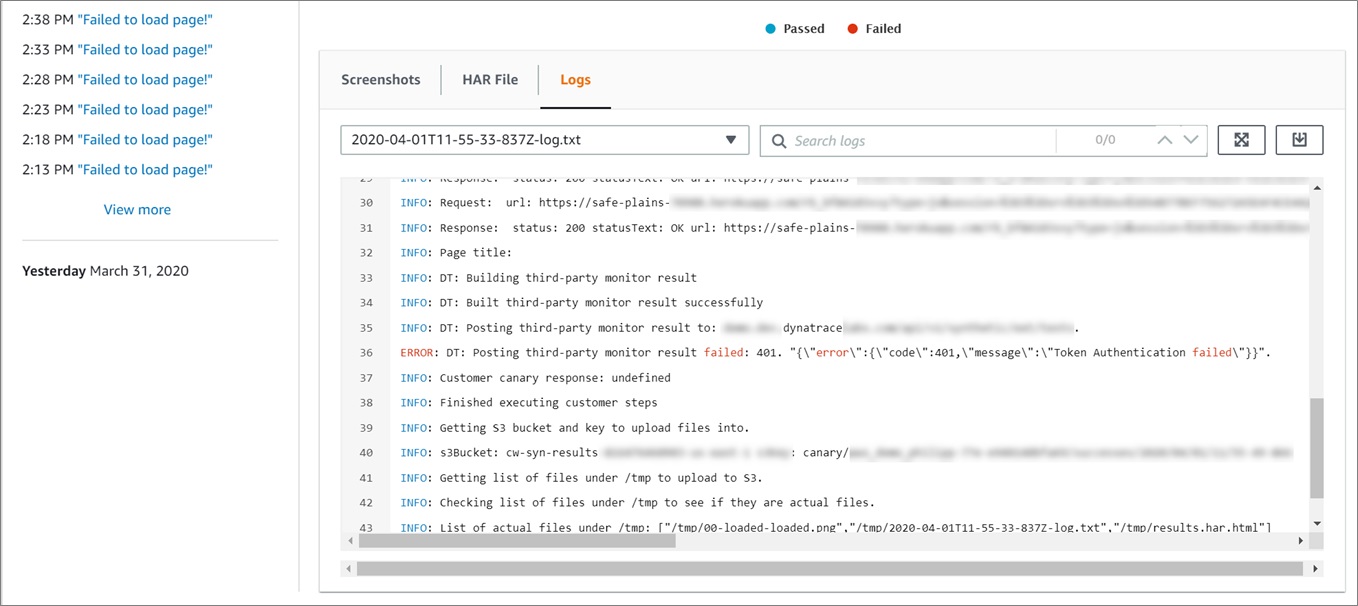
Figure 7 – Checking the canary log for error messages.
Summary
Amazon CloudWatch Synthetics makes it easier to monitor endpoints for RESTful APIs, URLs, and website content. They monitor your customer experience even when there is no customer traffic on your applications.
Integrating CloudWatch Synthetics into Dynatrace allows you to monitor both your Dynatrace and CloudWatch canaries directly from within the Dynatrace account.
To learn more, see the CloudWatch Synthetics documentation. If you have any questions, please post them on the Amazon CloudWatch service forum.
Learn more about monitoring AWS with Dynatrace, or sign up for a free Dynatrace trial.
.

.
Dynatrace – APN Partner Spotlight
Dynatrace is an AWS Competency Partner. Its AI-powered, full stack, and completely automated solution provides answers, not just data, based on deep insight into every user, every transaction, across every application.
Contact Dynatrace | Solution Overview | AWS Marketplace
*Already worked with Dynatrace? Rate this Partner
*To review an APN Partner, you must be an AWS customer that has worked with them directly on a project.