AWS Partner Network (APN) Blog
Improve Development Velocity and Reduce Troubleshooting Time By Up to 70% Using Epsagon
By Chinmay Gaikwad, Tech Evangelist – Epsagon
By Siva Sadhu, Sr. Partner Solutions Architect – AWS
 |
| Epsagon |
 |
Amazon Elastic Kubernetes Service (Amazon EKS) is a managed service that removes the undifferentiated heavy lifting of managing the Kubernetes control plane. Amazon EKS is increasingly being used by customers who are building modern applications on Amazon Web Services (AWS).
Kubernetes provides constructs like namespaces, roles and role bindings, and network policies to create a logical separation for cluster resources. In a multi-tenant setup, these constructs can prevent tenants from accessing or manipulating each other’s resources.
As application architectures evolve, traditional approaches to application and infrastructure monitoring will also have to adapt to the new technology paradigm.
While monitoring informs when there’s an anomaly in an application or infrastructure, observability helps understand why it occurs and how the application is behaving.
This provides deeper insights into issues, such as errors, faults, and latency problems by correlating external signals like logs, metrics, and traces across different components. These insights empower teams to innovate quickly while improving their development velocity and reducing operational costs.
The Amazon EKS console provides observability of the Kubernetes clusters so you can swiftly identify and resolve issues.
In this post, we’ll look at how an AWS customer leveraged Epsagon to reduce their troubleshooting time and how other users can do the same.
Epsagon is an AWS Partner with multiple Competency designations that allows teams to troubleshoot less and fix issues faster by providing automated data correlation and end-to-end observability within microservice environments.
Personal AI’s Journey to Kubernetes
Personal AI is a startup focused on safekeeping thoughts and memories that are worth recalling. Since they are focused on storing personal data, data isolation is of the utmost importance.
Amazon EKS is Personal AI’s platform of choice so they can leverage the power of Kubernetes to set up infrastructure per user base and have namespace separation to isolate the data.
One of the major requirements for Personal AI was having the ability to track user actions, as they wanted to track the flow of the request per user.
Distributed tracing does a great job of providing visibility into the lifecycle of a user request. Therefore, Personal AI decided to look for a distributed tracing-based observability solution. In addition, they were looking for a solution that would be easy to set up, scale with their application, and enable faster troubleshooting in EKS environments.
How Epsagon Solved Personal AI’s Observability Needs
Personal AI chose Epsagon because it satisfied all of their observability requirements. Specifically, Epsagon provided Personal AI with an observability solution that’s easy to set up, requires minimal training to use, and provides powerful visualizations and troubleshooting abilities.
Setting up Epsagon on Amazon EKS with Python applications requires minimal code change. With a few lines of additional code, users can instrument Epsagon in their Python application. The Epsagon token is the unique token given to users after they create an Epsagon account.
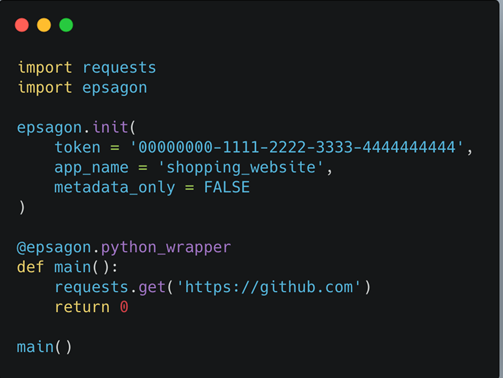
Figure 1 – Setting up Epsagon for Python applications.
After instrumenting applications, the service maps are automatically created. Service maps give a holistic view of the entire application and let users quickly understand if there are any problems in the application.
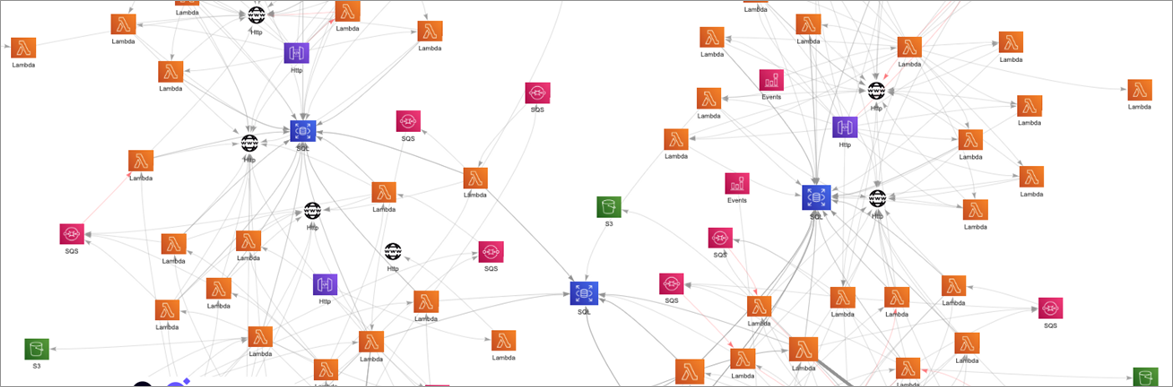
Figure 2 – Service maps in Epsagon.
Setting Up Epsagon on Amazon EKS
Getting started with Epsagon on Amazon EKS is simple and can be done in a few minutes.
To install the Epsagon’s Kubernetes agent:
- Install Helm.
- Install the Epsagon cluster agent using Helm to send all of the cluster resources, and then view them in Epsagon Explorer:
- Replace <EPSAGON_TOKEN> with Epsagon Token.
- Choose a <CLUSTER_NAME> for your cluster; the chosen name will be displayed in Epsagon.
- Then, run:
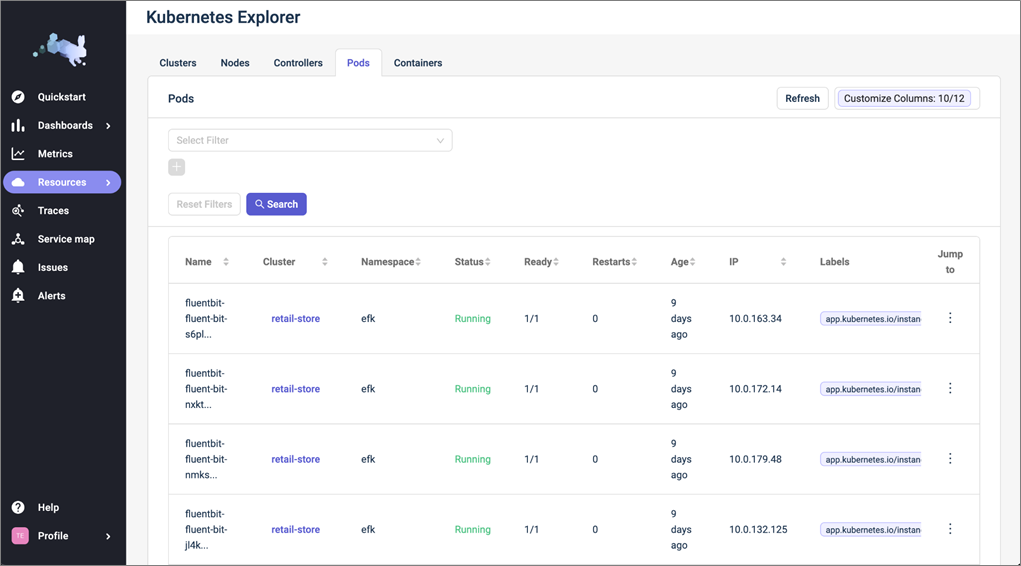
Figure 3 – Kubernetes Explorer.
Once the above steps are followed, the Kubernetes Explorer screen enables visibility into the Kubernetes infrastructure at different levels (cluster, nodes, containers, controllers, and pods).
Clicking on each component displays details about that component, as shown below. These details help with knowing if the configuration changed, and also help correlate metrics, events, logs, and traces.
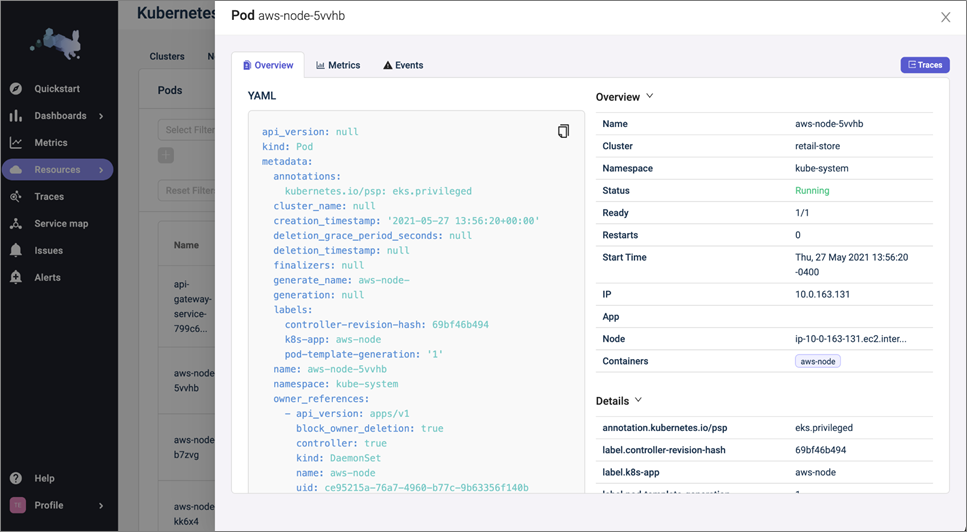
Figure 4 – Details of Kubernetes components.
Dashboards offer a single pane for a high-level view of all resources, plus users can drill down to analyze the details. Users can even customize various views of metrics and create alarms.
With Epsagon, Out-of-the-box (OOTB) Kubernetes dashboard can be used to monitor Kubernetes at a high level. The Kubernetes Overview dashboard offers an overview of the applications running in your cluster to help you create and modify resources like Deployments and DaemonSets. It also indicates the current state of cluster resources, as well as any errors.
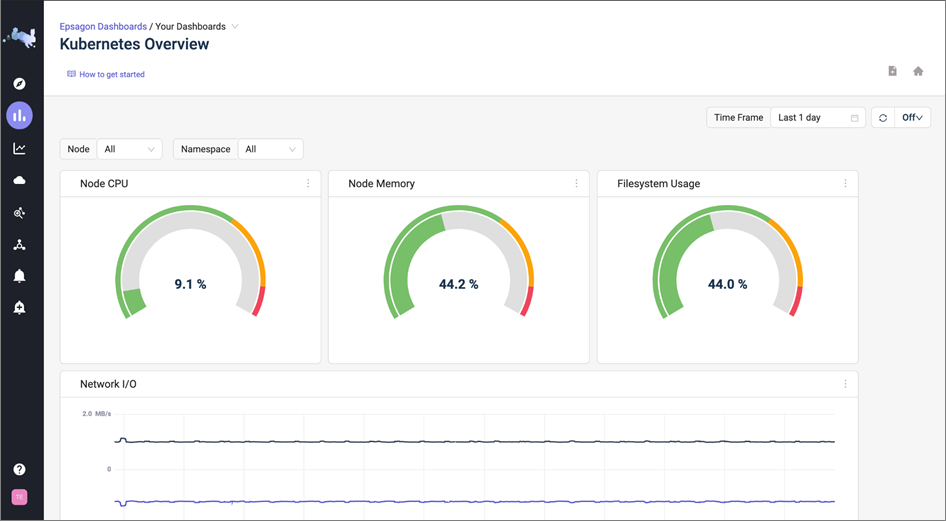
Figure 5 – Kubernetes Overview dashboard.
The OOTB Kubernetes dashboard gives insights into pods and containers and the CPU and memory usage for those resources. In this way, it is convenient to figure out if the CPU and memory usage is within the desired threshold.
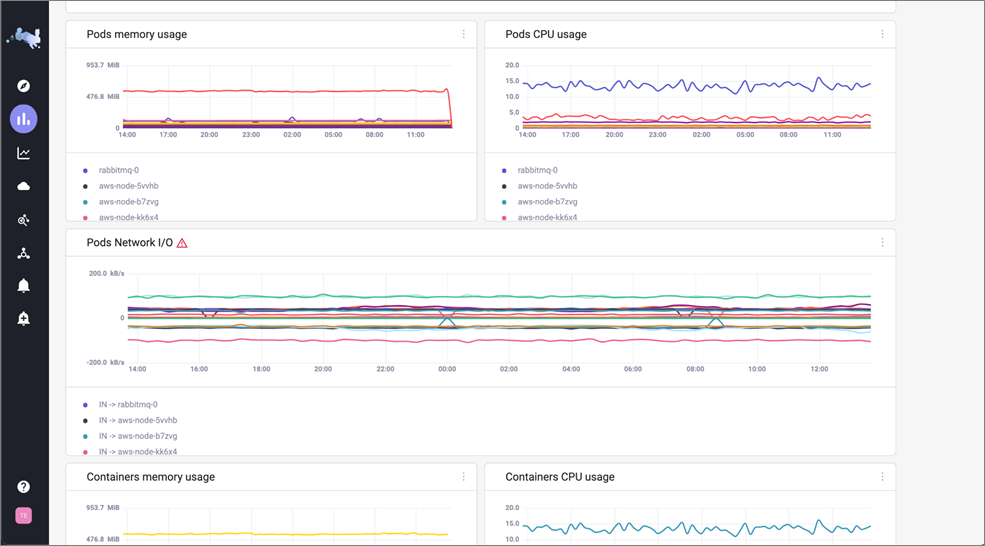
Figure 6 – OOTB Kubernetes dashboard.
Personal AI monitored pods very closely using Epsagon. The network receive and send for each pod was especially critical for them to monitor because user actions created network traffic. So, having zero network traffic was a huge red flag.
Epsagon helped simplify this process, and due to the simple setup and automated visibility into applications and the environment, Personal AI was able to save valuable engineering time.
Metrics, Logs, and Traces Reduced Troubleshooting Time
Personal AI was looking to reduce their troubleshooting time whenever an error occurred. Using kubectl and logs did not help troubleshoot faster, but Epsagon helps correlate metrics, logs, and traces. This can be incredibly powerful when troubleshooting distributed applications.
Service Maps and Trace Search helped the customer debug issues faster.
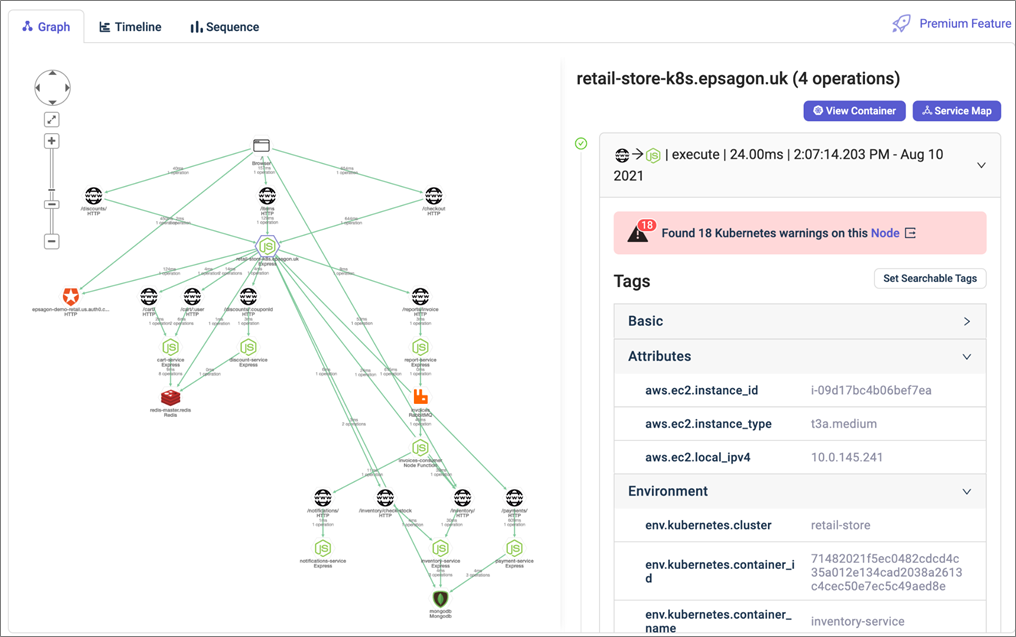
Figure 7 – Trace Search helps correlate metrics, logs, traces, and events.
Contextual Alerts Reduced Mean-Time-to-Detection (MTTD)
Creating alerts on distributed applications is tricky. Users can be overwhelmed by the number of alerts, leading to alerts fatigue. Epsagon’s alerts gave situational awareness about the Kubernetes environment to Personal AI.
Users can add context while creating the alert, including a small human-readable description.
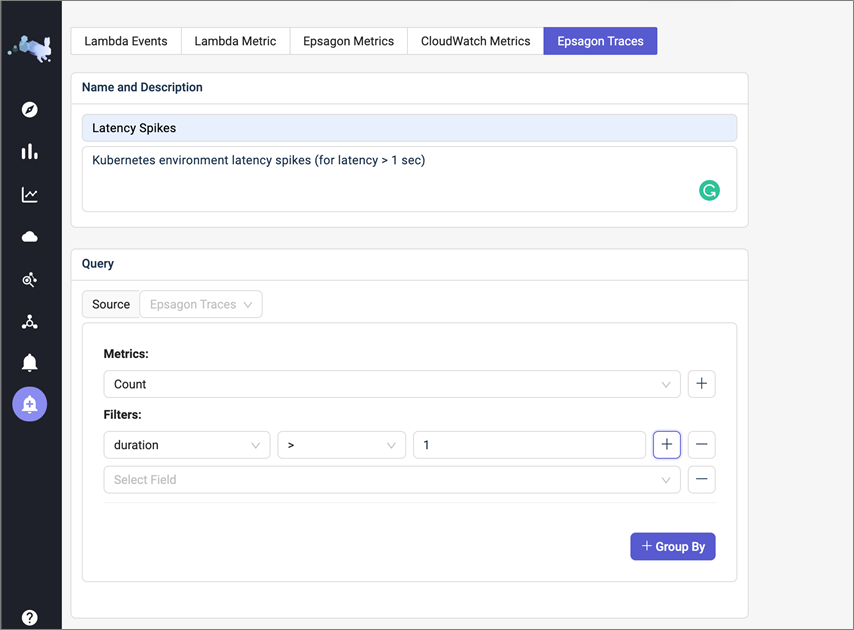
Figure 7 – Creating contextual alerts to reduce alerts fatigue.
The alerts screen clearly shows the alerts which are important and the status of each one. Epsagon integrates with many alerting platforms including Slack, VictorOps, Microsoft Teams, and more.
Personal AI used PagerDuty to alert them. Due to the contextual alerts, Personal AI was able to reduce their issues detection time.
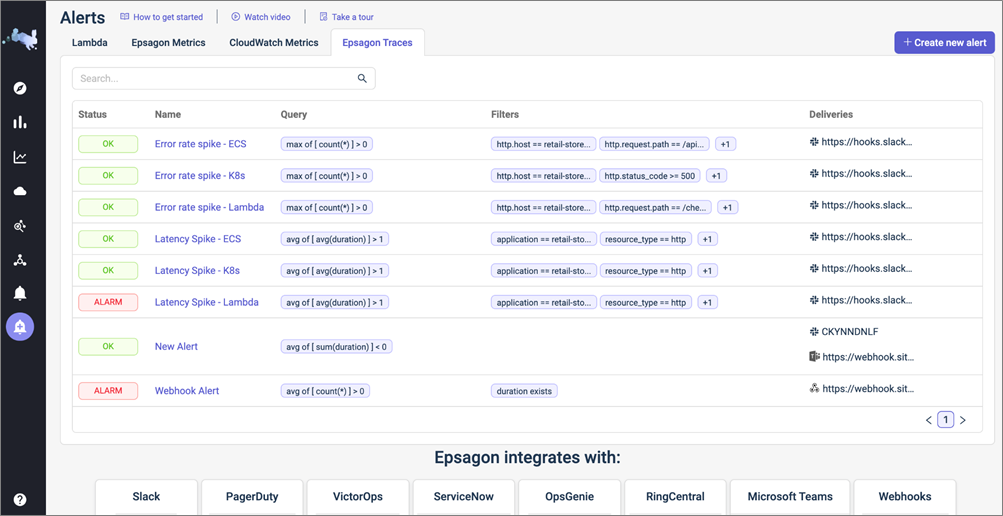
Figure 8 – Alerts overview.
The combination of contextual alerts and correlating metrics, logs, events, and traces helped Personal AI reduce their troubleshooting time by 70%.
Also, as Personal AI added more users Epsagon helped scale their application seamlessly by providing observability at Kubernetes and application layers.
Conclusion
Companies like Personal AI look for a cloud provider and tools to help them build resilient applications that can scale seamlessly. With a combination of AWS and Epsagon, Personal AI found the right solution to address their technical and business needs.
To get started with Epsagon, check out the demo of how Epsagon works with Kubernetes and serverless environments. You can also learn more about integrating your environment and instrumenting your applications with Epsagon.
.

.
Epsagon – AWS Partner Spotlight
Epsagon is an AWS Competency Partner specializing in automated tracing for cloud microservices. Its solution builds on AWS tools by providing automated end-to-end tracing across distributed AWS services, and services outside of AWS.
Contact Epsagon | Partner Overview
*Already worked with Epsagon? Rate the Partner
*To review an AWS Partner, you must be a customer that has worked with them directly on a project.