AWS News Blog
New for Amazon CodeGuru – Python Support, Security Detectors, and Memory Profiling

|
Amazon CodeGuru is a developer tool that helps you improve your code quality and has two main components:
- CodeGuru Reviewer uses program analysis and machine learning to detect potential defects that are difficult to find in your code and offers suggestions for improvement.
- CodeGuru Profiler collects runtime performance data from your live applications, and provides visualizations and recommendations to help you fine-tune your application performance.
Today, I am happy to announce three new features:
- Python Support for CodeGuru Reviewer and Profiler (Preview) – You can now use CodeGuru to improve applications written in Python. Before this release, CodeGuru Reviewer could analyze Java code, and CodeGuru Profiler supported applications running on a Java virtual machine (JVM).
- Security Detectors for CodeGuru Reviewer – A new set of detectors for CodeGuru Reviewer to identify security vulnerabilities and check for security best practices in your Java code.
- Memory Profiling for CodeGuru Profiler – A new visualization of memory retention per object type over time. This makes it easier to find memory leaks and optimize how your application is using memory.
Let’s see these functionalities in more detail.
Python Support for CodeGuru Reviewer and Profiler (Preview)
Python Support for CodeGuru Reviewer is available in Preview and offers recommendations on how to improve the Python code of your applications in multiple categories such as concurrency, data structures and control flow, scientific/math operations, error handling, using the standard library, and of course AWS best practices.
You can now also use CodeGuru Profiler to collect runtime performance data from your Python applications and get visualizations to help you identify how code is running on the CPU and where time is consumed. In this way, you can detect the most expensive lines of code of your application. Focusing your tuning activities on those parts helps you reduce infrastructure cost and improve application performance.
Let’s see the CodeGuru Reviewer in action with some Python code. When I joined AWS eight years ago, one of the first projects I created was a Filesystem in Userspace (FUSE) interface to Amazon Simple Storage Service (Amazon S3) called yas3fs (Yet Another S3-backed File System). It was inspired by the more popular s3fs-fuse project but rewritten from scratch to implement a distributed cache synchronized by Amazon Simple Notification Service (Amazon SNS) notifications (now, thanks to the many contributors, it’s using S3 event notifications). It was also a good excuse for me to learn more about Python programming and S3. It’s a personal project that at the time was made available as open source. Today, if you need a shared file system, you can use Amazon Elastic File System (Amazon EFS).
In the CodeGuru console, I associate the yas3fs repository. You can associate repositories from GitHub, including GitHub Enterprise Cloud and GitHub Enterprise Server, Bitbucket, or AWS CodeCommit.

After that, I can get a code review from CodeGuru in two ways:
- Automatically, when I create a pull request. This is a great way to use it as you and your team are working on a code base.
- Manually, creating a repository analysis to get a code review for all the code in one branch. This is useful to start using GodeGuru with an existing code base.
Since I just associated the whole repository, I go for a full analysis and write down the branch name to review (apologies, I was still using master at the time, now I use main for new projects).

After a few minutes, the code review is completed, and there are 14 recommendations. Not bad, but I can definitely improve the code. Here’s a few of the recommendations I get. I was using exceptions and global variables too much at the time.

Security Detectors for CodeGuru Reviewer
The new CodeGuru Reviewer Security Detector uses automated reasoning to analyze all code paths and find potential security issues deep in your Java code, even ones that span multiple methods and files and that may involve multiple sequences of operations. To build this detector, we used learning and best practices from Amazon’s 20+ years of experience.
The Security Detector is also identifying security vulnerabilities in the top 10 Open Web Application Security Project (OWASP) categories, such as weak hash encryption.
If the security detector discovers an issue, it offers a suggested remediation along with an explanation. In this way, it’s much easier to follow security best practices for AWS APIs, such as those for AWS Key Management Service (AWS KMS) and Amazon Elastic Compute Cloud (Amazon EC2), and for common Java cryptography and TLS/SSL libraries.
With help from the security detector, security engineers can focus on architectural and application-specific security best-practices, and code reviewers can focus their attention on other improvements.
Memory Profiling for CodeGuru Profiler
For applications running on a JVM, CodeGuru Profiler can now show the Heap Summary, a consolidated view of memory retention during a time frame, tracking both overall sizes and number of objects per object type (such as String, int, char[], and custom types). These metrics are presented in a timeline graph, so that you can easily spot trends and peaks of memory utilization per object type.
Here are a couple of scenarios where this can help:
Memory Leaks – A constantly growing memory utilization curve for one or more object types may indicate a leak (intended here as unnecessary retention of memory objects by the application), possibly leading to out-of-memory errors and application crashes.
Memory Optimizations – Having a breakdown of memory utilization per object type is a step beyond traditional memory utilization monitoring, based solely on JVM-level metrics like total heap usage. By knowing that an unexpectedly high amount of memory has been associated with a specific object type, you can focus your analysis and optimization efforts on the parts of your application that are responsible for allocating and referencing objects of that type.
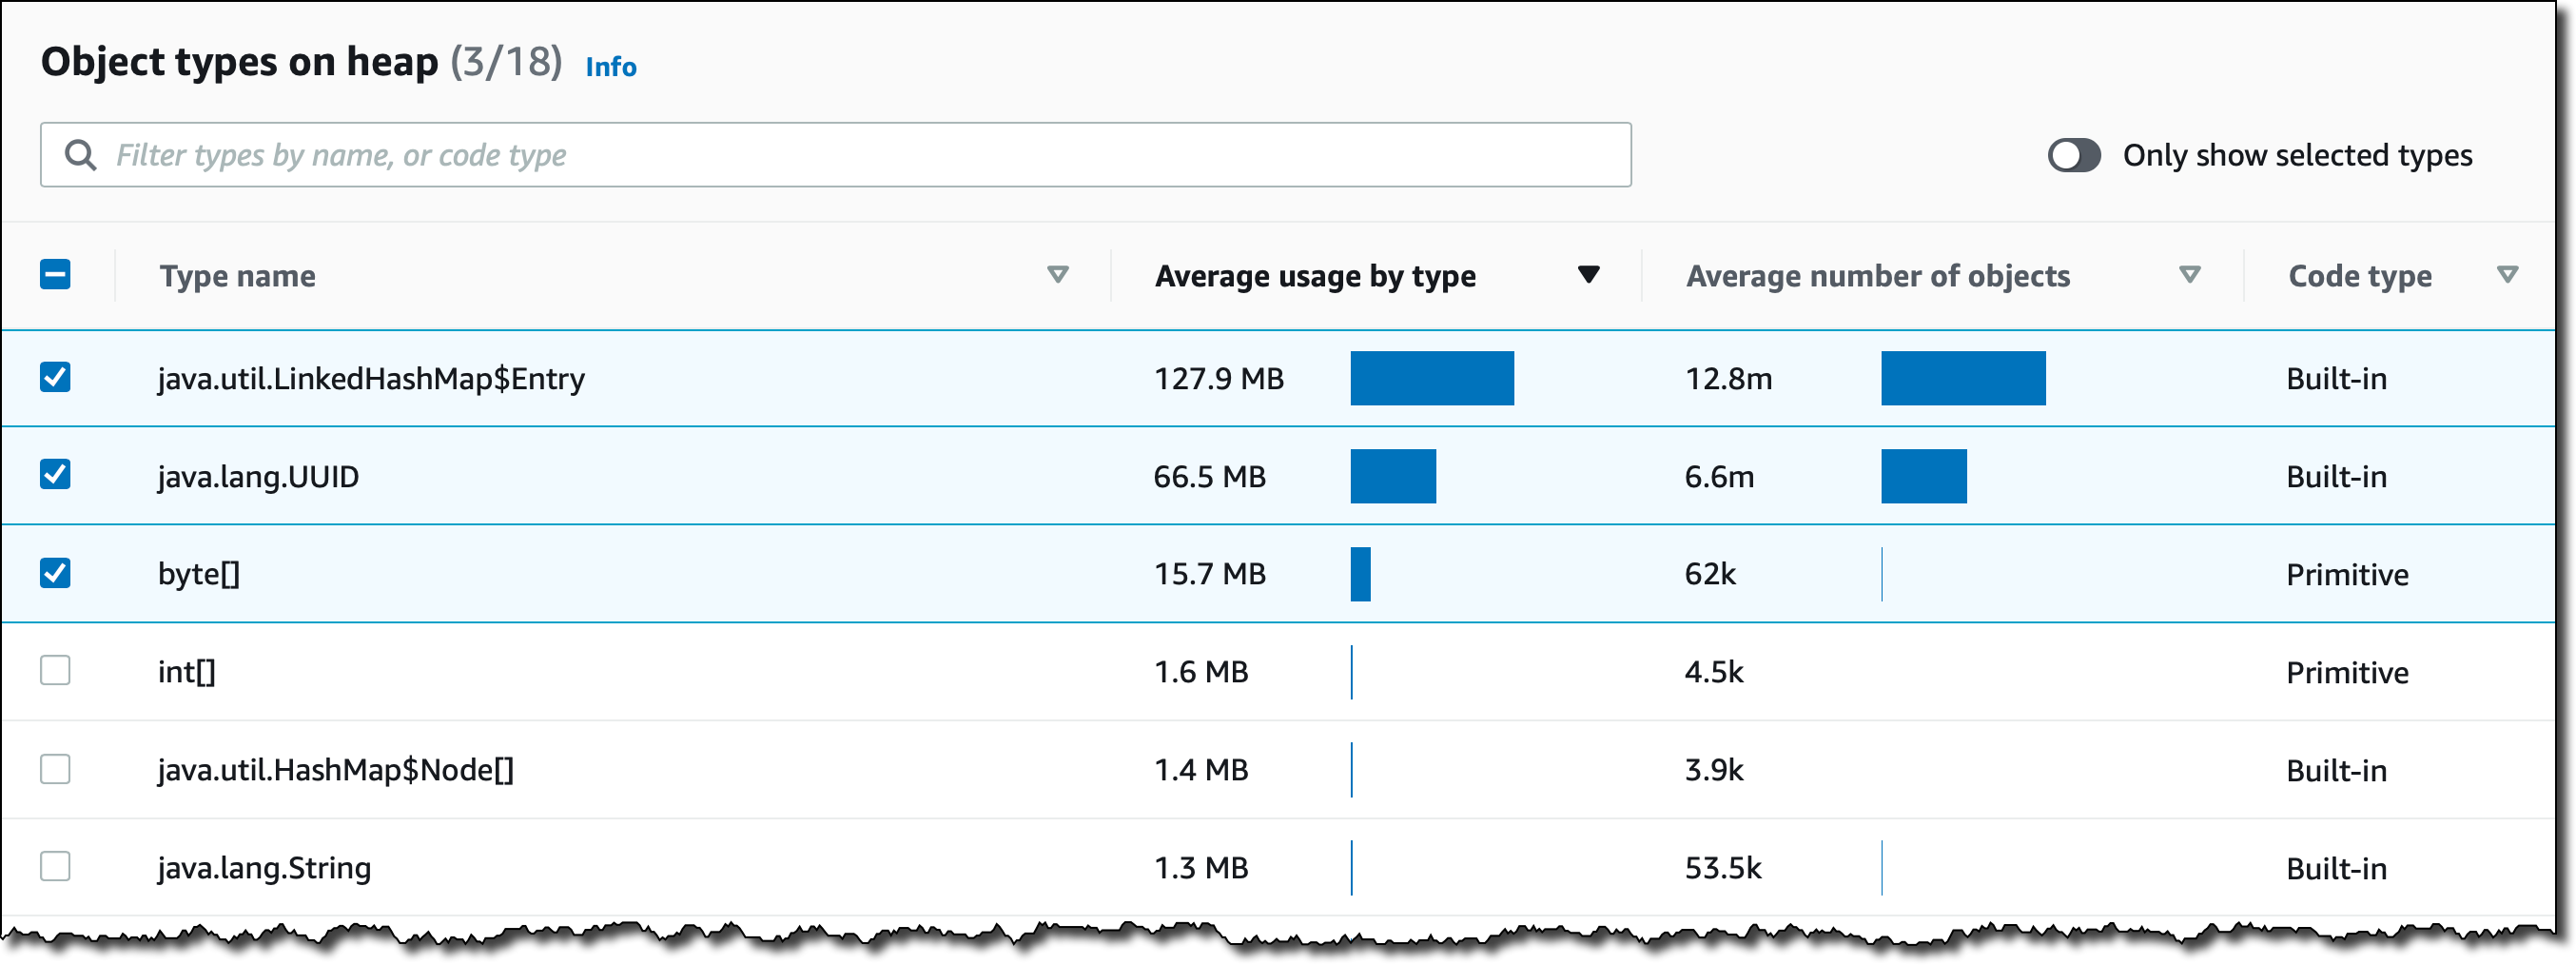
For example, here is a graph showing how memory is used by a Java application over an interval of time. Apart from the total capacity available and the used space, I can see how memory is being used by some specific object types, such as byte[], java.lang.UUID, and the entries of a java.util.LinkedHashMap. The continuous growth over time of the memory retained by these object types is suspicious. There is probably a memory leak I have to investigate.

In the table just below, I have a longer list of object types allocating memory on the heap. The first three are selected and for that reason are shown in the graph above. Here, I can inspect other object types and select them to see their memory usage over time. It looks like the three I already selected are the ones with more risk of being affected by a memory leak.
Available Now
These new features are available today in all regions where Amazon CodeGuru is offered. For more information, please see the AWS Regional Services table.
There are no pricing changes for Python support, security detectors, and memory profiling. You pay for what you use without upfront fees or commitments.
Learn more about Amazon CodeGuru and start using these new features today to improve the code quality of your applications.
— Danilo