AWS News Blog
New Solution – Clickstream Analytics on AWS for Mobile and Web Applications

|
Starting today, you can deploy on your AWS account an end-to-end solution to capture, ingest, store, analyze, and visualize your customers’ clickstreams inside your web and mobile applications (both for Android and iOS). The solution is built on top of standard AWS services.
This new solution Clickstream Analytics on AWS allows you to keep your data in the security and compliance perimeter of your AWS account and customize the processing and analytics as you require, giving you the full flexibility to extract value for your business. For example, many business line owners want to combine clickstream analytics data with business system data to gain more comprehensive insights. Storing clickstream analysis data in your AWS account allows you to cross reference the data with your existing business system, which is complex to implement when you use a third-party analytics solution that creates an artificial data silo.
Clickstream Analytics on AWS is available from the AWS Solutions Library at no cost, except for the services it deploys on your account.
Why Analyze Your Applications Clickstreams?
Organizations today are in search of vetted solutions and architectural guidance to rapidly solve business challenges. Whether you prefer off-the-shelf deployments or customizable architectures, the AWS Solutions Library carries solutions built by AWS and AWS Partners for a broad range of industry and technology use cases.
When I talk with mobile and web application developers or product owners, you often tell me that you want to use a clickstream analysis solution to understand your customers’ behavior inside your application. Click stream analysis solutions help you to identify popular and frequently visited screens, analyze navigation patterns, identify bottlenecks and drop-off points, or perform A/B testing of functionalities such as the pay wall, but you face two challenges to adopt or build a click stream analysis solution.
Either you use a third-party library and analytics solution that sends all your application and customer data to an external provider, which causes security and compliance risks and makes it more difficult to reference your existing business data to enrich the analysis, or you dedicate time and resources to build your own solution based on AWS services, such as Amazon Kinesis (for data ingestion), Amazon EMR (for processing), Amazon Redshift (for storage), and Amazon QuickSight (for visualization). Doing so ensures your application and customer data stay in the security perimeter of your AWS account, which is already approved and vetted by your information and security team. Often, building such a solution is an undifferentiated task that drives resources and budget away from developing the core business of your application.
Introducing Clickstream Analytics on AWS
The new solution Clickstream Analytics on AWS provides you with a backend for data ingestion, processing, and visualization of click stream data. It’s shipped as an AWS CloudFormation template that you can easily deploy into the AWS account of your choice.
In addition to the backend component, the solution provides you with purpose-built Java and Swift SDKs to integrate into your mobile applications (for both Android and iOS). The SDKs automatically collects data and provide developers with an easy-to-use API to collect application-specific data. They manage the low-level tasks of buffering the data locally, sending them to the backend, managing the retries in case of communication errors, and more.
The following diagram shows you the high-level architecture of the solution.

The solution comes with an easy-to-use console to configure your solution. For example, it allows you to choose between three AWS services to ingest the application clickstream data: Amazon Managed Streaming for Apache Kafka (Amazon MSK), Amazon Kinesis Data Streams, or Amazon Simple Storage Service (Amazon S3). You can create multiple data pipelines for multiple applications or teams, each using a different configuration. This allows you to adjust the backend to the application user base and requirements.
You can use plugins to transform the data during the processing phase. The solution comes with two plugins preinstalled: User-Agent enrichment and IP address enrichment to add additional data that’s related to the User-Agent and the geolocation of the IP address used by the client applications.
By default, it provides a Amazon Redshift Serverless cluster to minimize the costs, but you can select a provisioned Amazon Redshift configuration to meet your performance and budget requirements.
Finally, the solution provides you with a set of pre-assembled visualization dashboards to report on user acquisition, user activity, and user engagement. The dashboard consumes the data available in Amazon Redshift. You’re free to develop other analytics and other dashboards using the tools and services of your choice.
Let’s See It in Action
The best way to learn how to deploy and to configure Clickstream Analytics on AWS is to follow the tutorial steps provided by the Clickstream Analytics on AWS workshop.
The workshop goes into great detail about each step. Here are the main steps I did to deploy the solution:
1. I create the control plane (the management console) of the solution using this CloudFormation template. The output of the template contains the URL to the management console. I later receive an email with a temporary password for the initial connection.
2. On the Clickstream Analytics console, I create my first project and define various network parameters such as the VPC, subnets, and security groups. I also select the service to use for data ingestion and my choice of configuration for Amazon Redshift.


3. When I enter all configuration data, the console creates the data plane for my application.
AWS services and solutions are usually built around a control plane and one or multiple data planes. In the context of Clickstream Analytics, the control plane is the console that I use to define my data acquisition and analysis project. The data plane is the infrastructure to receive, analyze, and visualize my application data. Now that I define my project, the console generates and launches another CloudFormation template to create and manage the data plane.
4. The Clickstream Analytics console generates a JSON configuration file to include into my application and it shares the Java or Swift code to include into my Android or iOS application. The console provides instructions to add the clickstream analysis as a dependency to my application. I also update my application code to insert the code suggested and start to deploy.

5. After my customers start to use the mobile app, I access the Clickstream Analytics dashboard to visualize the data collected.
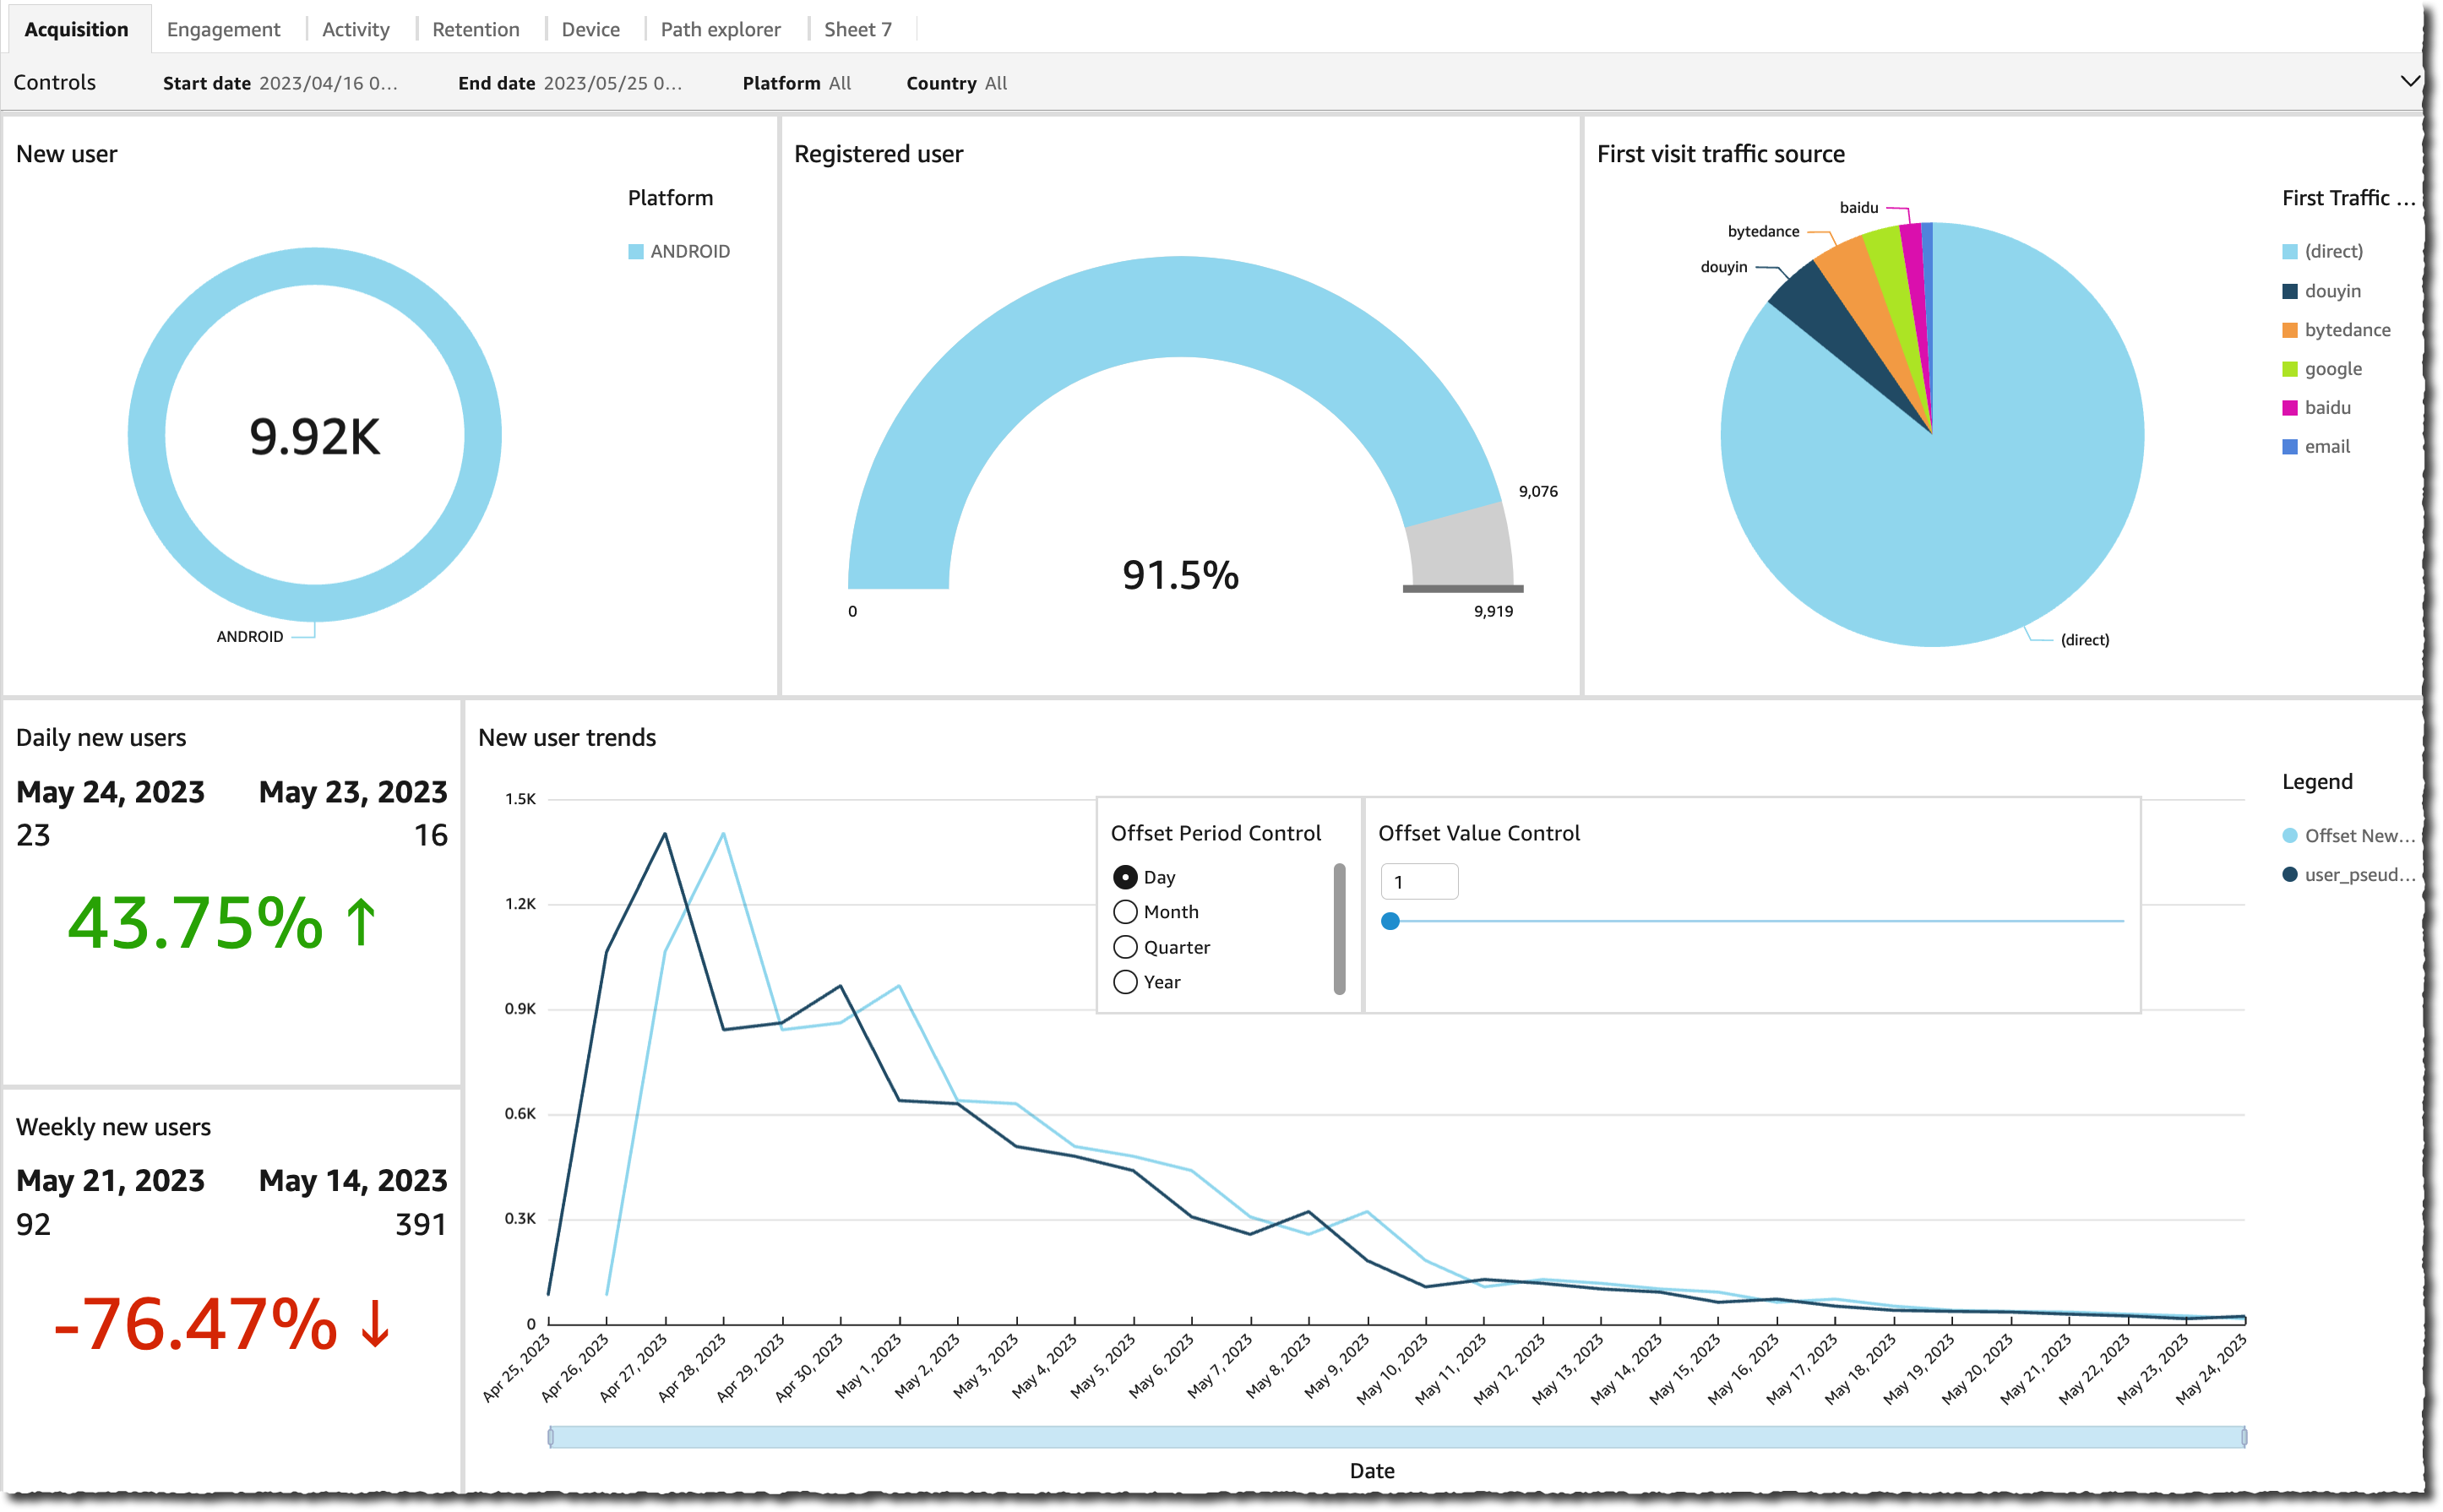
The Dashboards
Clickstream Analytics dashboards are designed to provide a holistic view of the user lifecycle: the acquisition, the engagement, the activity, and the retention. In addition, it adds visibility into user devices and geographies. The solution automatically generates visualizations in these six categories: Acquisition, Engagement, Activity, Retention, Devices, and Navigation path. Here are a couple of examples.
The Acquisition dashboard reports the total number of users, the registered number of users (the ones that signed in), and the number of users by traffic source. It also computes the new users and registered users’ trends.
The Engagement dashboard reports the user engagement level (the number of user sessions versus the time users spent on my application). Specifically, I have access to the number of engaged sessions (sessions that last more than 10 seconds or have at least two screen views), the engagement rate (the percentage of engaged sessions from the total number of sessions), and the average engagement time.

The Activity dashboard shows the event and actions taken by my customers in my application. It reports data, such as the number of events and number of views (or screens) shown, with the top events and views shown for a given amount of time.

The Retention tab shows user retention over time: the user stickiness for your daily, weekly, and monthly active users. It also shows the rate of returning users versus new users.

The Device tab shows data about your customer’s devices: operating systems, versions, screen sizes, and language.

And finally, the Path explorer dashboard shows your customers’ navigation path into the screens of your applications.

As I mentioned earlier, all the data are available in Amazon Redshift, so you’re free to build other analytics and dashboards.
Pricing and Availability
The Clickstream Analytics solution is available free of charge. You pay for the AWS services provisioned for you, including Kinesis or Amazon Redshift. Cost estimates depend on the configuration that you select. For example, the size of the Kinesis and Amazon Redshift cluster you select for your data ingestion and analytics needs, or the volume of data your applications send to the pipeline both affect the monthly cost of the solution.
To learn how to get started with this solution, take the Clickstream Analytics workshop today and stop sharing your customer and application clickstream data with third-party solutions.
— seb