AWS Marketplace
Food supply chain optimization using PredictHQ intelligent event data from AWS Data Exchange for demand forecasting
The U.S. Department of Agriculture (USDA) estimates that 31% of food loss occurs at the retail/consumer level. According to the USDA food waste impacts food security, wastage of agricultural resources, and can contribute to greenhouse gas emissions in landfills. This is in addition to the financial cost that businesses incur from inaccurate supply planning. Accurately forecasting customer demand offers an opportunity to optimize supply chains and potentially prevent waste across an organization. It’s also a chance to contribute to improving an organization’s environmental impact and their pursuit of sustainability goals.
PredictHQ data, available for trial and purchase through AWS Data Exchange, provides intelligent event data that reveals the context of how and why demand fluctuates. This helps enables businesses to make data-driven decisions to improve demand forecasting and subsequent supply decisions. Quick- service restaurants, delivery services, supermarkets, and many other types of businesses use PredictHQ to help improve the accuracy of demand forecasting and planning, including inventory and staffing optimizations. Events such as sports games, concerts, and even school and public holidays can have a major impact on demand. For example, store locations for one national fast-food chain saw an 90% increase of in-store demand on Super Bowl Sunday, while another leader in the fast-casual space saw the exact opposite with a 30% drop of in-store demand. By incorporating event data to better predict demand, organizations can help ensure they are optimizing their supply chain and avoiding wastage. Another example is with a leading national fast-casual restaurant chain that, by using PredictHQ’ s intelligent event data API, was able to help improve the accuracy of their demand forecasting. PredictHQ noted they saw $2.7 million in supply chain gains from improving over and under forecasting. In combination with AWS machine learning services, PredictHQ helps organizations to forecast demand, optimize their supply chain and prevent waste.
In this post, we will show how it may be possible to avoid wastage and better forecast food needs using PredictHQ’s dataset with Amazon Forecast and other machine learning services.
Prerequisites
1. Setting up your AWS Account
To implement this solution, you must have an AWS account and access to AWS Management Console. Ensure your account has access to the following AWS services.
- AWS IAM
- AWS SDK
- AWS Lake Formation
- Amazon S3
- AWS Glue
- Amazon Forecast
- Amazon SageMaker Canvas
- AWS Database Migration Service (DMS)
- AWS Transfer Family
- AWS Data Exchange
2. Setting up SageMaker Canvas
- To set up SageMaker Canvas, in the AWS Management Console, search for and open Amazon SageMaker.
- In SageMaker Canvas, create a new user profile followed by a domain using SageMaker Canvas.
- Ensure you are referring to the intended AWS Region while setting up your domain. Later on, you will invoke Amazon Forecast from SageMaker Canvas from this selected Region only.
- To continue working on SageMaker Canvas, choose the link to open SageMaker Canvas console.
3. Subscribe to PredictHQ Data
- In the AWS Management Console, search for AWS Data Exchange by entering AWS Data Exchange in the search field. From the left sidebar, select Browse Catalog.
- At the top of the page, in the Browse Catalog search field, enter PredictHQ and choose the Search button. This returns the relevant data products for subscription. Choose the PredictHQ Intelligent Event Data API product.
- To subscribe to that product, on the data product’s page left sidebar, choose Continue to subscribe. Enter details of your subscription request and select Send subscription request to provider. PredictHQ will then need to verify your request and provide access to the data.
Solution overview
In this use case, we will show how to build a solution for a fictitious restaurant chain called Yummy Burger Co operating outlets across several locations within a city. Its individual outlets run the Point of Sale (POS) application TouchBistro, inventory management for both ingredients and sellable food items on Oracle Retail, and store analytics such as total sales and sales patterns on Oracle. The restaurant owner uses Oracle Fusion Applications for enterprise resource planning (ERP) and Oracle Customer Relationship Management (CRM) system. There are also third parties involved, such as food ingredients suppliers and delivery vendors.
Yummy Burger Co currently uses manual forecasting with statistical Excel-based formulas to analyze its data sets at different scales. These ad hoc methods may produce unreliable results, causing an increase in wastage as food ingredients are procured based on inaccurate predictions of upcoming demand. Using PredictHQ intelligent event data to increase the accuracy of forecasting, Yummy Burger Co will incorporate several broad data types alongside PredictHQ intelligent event data:
- Store Applications data – These are mostly custom applications running on relational databases like Oracle, MySQL.
- Corporate Data – Oracle Fusion Applications (ERP), Oracle CRM application shared across stores or outlets as SaaS versions.
- Third Party Data – Supplier systems, delivery and logistics vendor systems.
- PredictHQ Data – Intelligent event data available through AWS Data Exchange for APIs.
To implement this solution, Yummy Burger Co follows these four overall steps:
- Data Extraction – Extracting data from these four source systems through an automated data ingestion pipeline by ingesting data into inbound Amazon Simple Storage Service (S3).
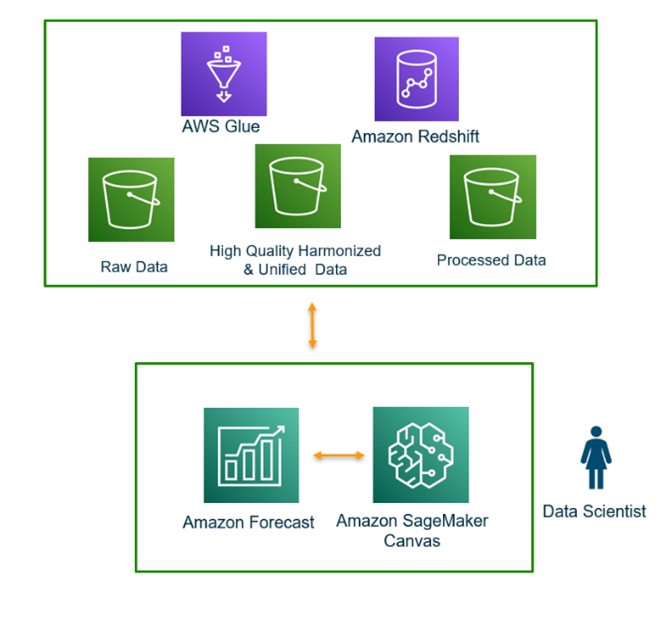
- Data Unification and Harmonization – Keeping the source data refreshed by harmonizing and unifying the data.
- Core Forecasting Engine – Preparing input data for forecasting through Amazon Forecast, invoking Amazon Forecast APIs through Amazon SageMaker Canvas.
- Data Visualization – Custom dashboards built using Amazon QuickSight to display forecast outputs. Amazon QuickSight will keep refreshing the dashboards using newly exported forecast results for users to review and make subsequent organizational actions based on the forecasted results.
Solution walkthrough: Using AWS Data Exchange data in demand forecasting
A. Building an automated data extraction pipeline to move input data into Amazon S3
To build an automated data extraction pipeline, follow these steps:
- Set up and schedule Database Migration Service (DMS) to migrate your store applications data into an inbound Amazon S3. For example, for Yummy Burger Co to migrate its on-premises Oracle data sources, it did the following:
-
- In the AWS Management Console, for the specific purpose of migrating data, create a separate DMS user.
- Grant this user the minimal set of privileges required to migrate your data. Make sure that your firewall rules give the AWS DMS replication server ingress, as the AWS DMS replication server needs access to your source database.
- In the AWS DMS console, create the following resources:
- Replication instance
- Source endpoint (your store Oracle database)
- Target endpoint (Amazon S3)
- A task that runs on the replication instance and connects to endpoints to replicate data from the source database to the target database.
- Follow this step-by-step migration instruction to plan and execute the migration.
- To connect with Oracle Fusion Application (ERP SaaS), Oracle CRM (SaaS) to extract data into inbound Amazon S3, you must set up and connect your data sources with Amazon AppFlow. To do that:
-
- Log in to your AWS account.
- Verify you have the prerequisites listed and then follow this Getting started with Amazon AppFlow tutorial.
- Using the Creating flows in Amazon AppFlow guide, create flows for Oracle Fusion Application and Oracle CRM.
- AWS Transfer Family is a secure transfer service that enables you to transfer files into and out of AWS storage services. To set up AWS Transfer Family services, do the following:
-
- Using the Setting up AWS Transfer Family services guide, set up your service.
- Create a server and a connector, and then transfer files using a connector. To get third-party B2B data elements through FTP/sFTP into inbound Amazon S3, invoke AWS Transfer Family services.
- Invoke AWS Data Exchange for APIs to extract PredictHQ data into the common inbound Amazon S3. To do that, follow this tutorial Subscribe to AWS Data Exchange for APIs (Test Product) on AWS Data Exchange. PredictHQ provides further details on their API parameters here.
The following diagram shows steps A1-4.

B. Joining datasets and creating a predictive ML model for forecasting
To harmonize and unify your data sources into a more accurate forecasting tool, do the following:
- Join your datasets and create a predictive ML model
- In the AWS Management Console search field, enter Amazon SageMaker. In the top left corner, choose Canvas. Create a new user profile. To open the Amazon SageMaker Canvas console, choose Open Canvas.
- In the SageMaker Canvas console, chose Datasets and then Create a new dataset. For the data source, choose Amazon S3. Point to the inbound S3 buckets as your source data. This is the same bucket you point to in step A.
- To create a consolidated data source by joining four distinct data types using referential keys, choose Join Data. To import data into SageMaker Canvas, choose Import Data.
- Choose My Models and then choose New Model. Enter a model name. As the problem type, select Predictive Analysis.
- Select the newly created consolidated data set from above as the input data set of the model. As the target column for forecast output, select future demand. The Model type should automatically point as Time Series. You can optionally configure the model further to define your input parameters.
- To build the model, choose Quick Build. This will take some time, depending on the size of your input dataset. You can now use your new ML model to analyze your dataset and to generate forecasted demand.
- Automate the process for ongoing predictive ML forecasting. To automate the process as datasets update, do the following:
- To trigger an AWS Glue job to harmonize and unify data for forecasting, follow this tutorial: Set up Amazon S3 event notification and Lambda functions.
- Likewise, follow this tutorial to use Amazon SageMaker Canvas to build, train, test and improve the accuracy of your model versions. SageMaker Canvas will internally use Amazon Forecast to generate the forecast into an outbound S3.
- To generate a forecast and to export the forecast results into the outbound Amazon S3 and subsequently into the data lake, follow this tutorial for Code examples for AWS Glue using AWS SDKs. This shows how to set up AWS Glue to automate the call to Amazon Forecast API.
The process is depicted in the figure below as the core engine of your forecasting process.
C. Data visualization and adjusting inventory levels as needed to optimize perishable stock levels
Now that your predictive ML model is created and you have joined your datasets, you can create dashboards for ongoing data analysis and forecasting. To do that, follow these steps:
- In the AWS Management Console search field, enter QuickSight.
- In the the Amazon QuickSight console window, choose New Analysis. To create custom dashboards, select the outbound S3 you created in step B.2. as your data source.
- To set up AWS Glue to automatically trigger a crawler on the exported forecast results into outbound Amazon S3, follow this tutorial Starting jobs and crawlers using triggers. Amazon QuickSight will then automatically refresh the dashboards using newly exported forecast results for users to review and make subsequent organizational actions based on the forecasted results.
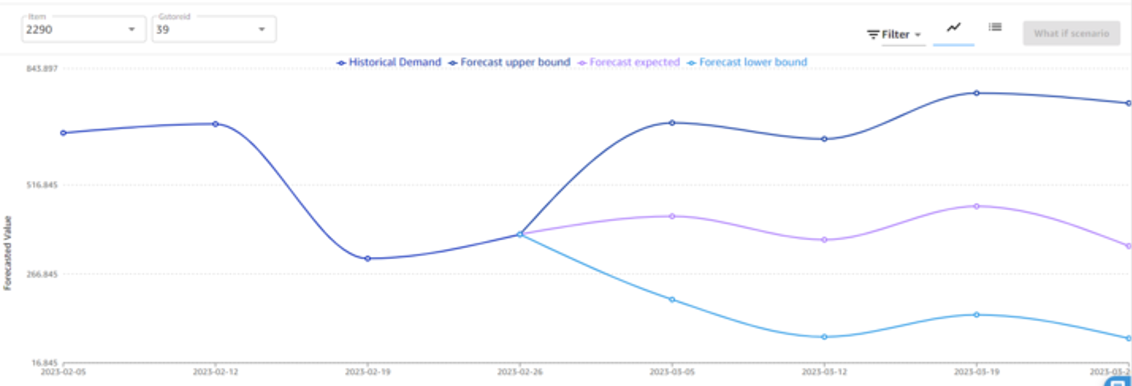
Store managers, armed with real-time demand forecasts that incorporate intelligent events from PredictHQ, are now well-prepared for upcoming demand and able to make inventory adjustments to minimize food wastage.
The following is an example of what a store manager might see for one product e.g., bread (Item 39) for their store at one location e.g., Brooklyn (2290). It shows a demand forecast for the next 4 weeks and includes an average as well as upper and lower bounds. With this information, the store manager can make procurement decisions to ensure optimal inventory levels.
Please remember to delete example resources if they are no longer needed, to avoid incurring future costs.
Conclusion
In this post, we showed how to use PredictHQ intelligent event data to help achieve more accurate demand forecasts. As the foundation for success, better forecasts inform key business strategies such as supply chain optimization and inventory management, helping to ensure stores are not over- or under-stocked on any given day. Not only may this lead to major efficiency savings but also offers up opportunities to potentially prevent food wastage and make more sustainable operational decisions. To learn more about this solution please click here.
About the author
 |
Tania Tian is a Senior Data Scientist at PredictHQ and part of the R&D team. With a focus on delivering demand intelligence products and solutions, coupled with a genuine passion for data science, Tania takes pride in fostering user-led, data-driven innovations. |
 |
Santanu Chattopadhyay is the APAC Tech Lead for Partner Solution Architecture team for Retail & CPG. He helps partners across APAC to build and enhance Retail industry solutions leveraging different AWS services. |
 |
Tina Holyman is a Consumer/Retail Category Manager for the Industry Technology Partnerships team in Asia Pacific & Japan. She helps AWS partners in the Retail, CPG and Travel & Hospitality segment provide solutions to AWS end customers. |