AWS Big Data Blog
Automate discovery of data relationships using ML and Amazon Neptune graph technology
Data mesh is a new approach to data management. Companies across industries are using a data mesh to decentralize data management to improve data agility and get value from data. However, when a data producer shares data products on a data mesh self-serve web portal, it’s neither intuitive nor easy for a data consumer to know which data products they can join to create new insights. This is especially true in a large enterprise with thousands of data products.
This post shows how to use machine learning (ML) and Amazon Neptune to create automated recommendations to join data products and display those recommendations alongside the existing data products. This allows data consumers to easily identify new datasets and provides agility and innovation without spending hours doing analysis and research.
Background
The success of a data-driven organization recognizes data as a key enabler to increase and sustain innovation. It follows what is called a distributed system architecture. The goal of a data product is to solve the long-standing issue of data silos and data quality. Independent data products often only have value if you can connect them, join them, and correlate them to create a higher order data product that creates additional insights. A modern data architecture is critical in order to become a data-driven organization. It allows stakeholders to manage and work with data products across the organization, enhancing the pace and scale of innovation.
Solution overview
A data mesh architecture starts to solve for the decoupled architecture by decoupling the data infrastructure from the application infrastructure, which is a common challenge in traditional data architectures. It focuses on decentralized ownership, domain design, data products, and self-serve data infrastructure. This allows for a new way of thinking and new organizational elements—namely, a modern data community.
However, today’s data mesh platform contains largely independent data products. Even with well-documented data products, knowing how to connect or join data products is a time-consuming job. Data consumers spend hours, days, or months to understand and analyze the data. Identifying links or relationships between data products is critical to create value from the data mesh and enable a data-driven organization.
The solution in this post illustrates an approach to solving these challenges. It uses a fictional insurance company with several data products shared on their data mesh marketplace. The following figure shows the sample data products used in our solution.
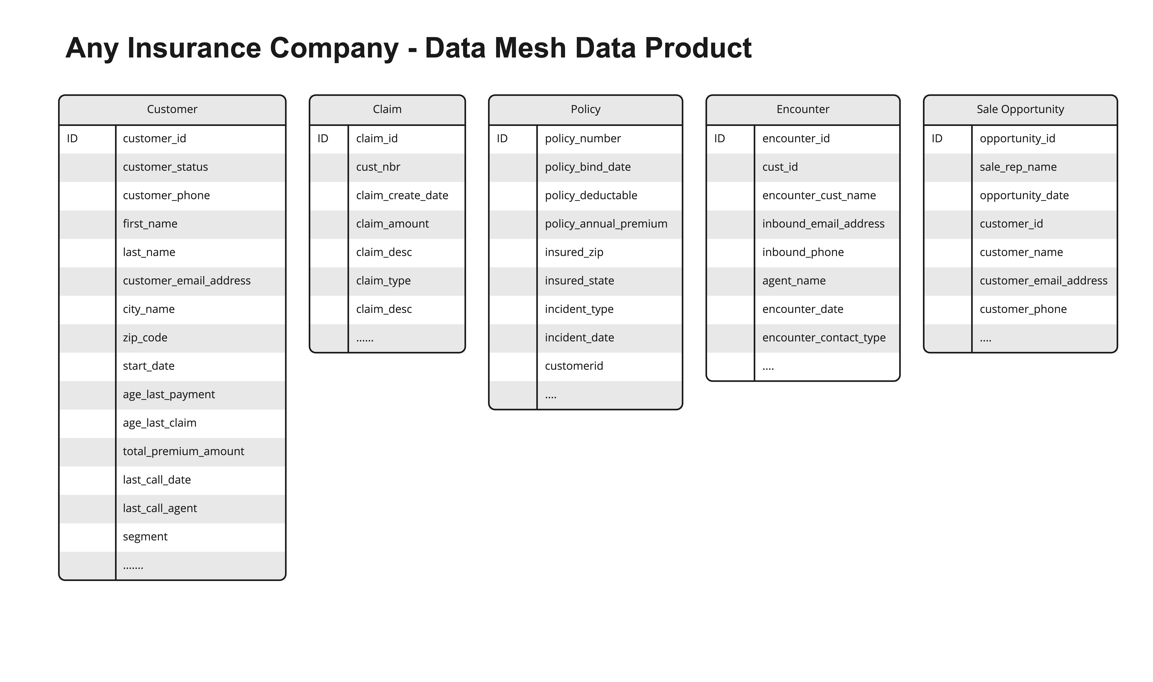
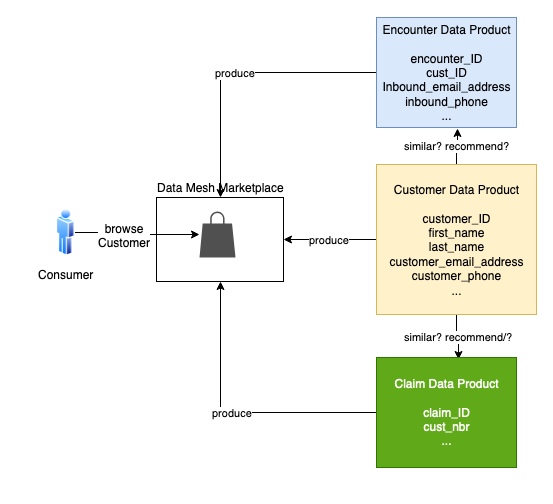
Suppose a consumer is browsing the customer data product in the data mesh marketplace. The consumer wonders if the customer data could be linked to claim, policy, or encounter data. Because these data products come from different lines of business (LOBs) or silos, it’s hard to know. A consumer would have to review each data product and do the necessary analysis and research to know this with any certainty.
To solve this problem, our solution uses ML and Neptune to create recommendations for the data consumer. The solution generates a list of data products, product attributes, and the associated probability scores to show join ability. This reduces the time to discover, analyze, and create new insights.
We use Valentine, a data science algorithm for comparing datasets, to improve data product recommendations. Neptune, the managed AWS graph database service, stores information about explicit connections between datasets, improving the recommendations.
Example use case
Let’s walk through a concrete example. Suppose a consumer is browsing the Customer data product in the data mesh marketplace. Customer is similar to the Policy and Encounter data products, but these products come from different silos. Their similarity to the Customer is hard to gauge. To expedite the consumer’s work, the mesh recommends how the Policy and Encounter products can be connected to the Customer product.
Let’s consider two cases. First, is Customer similar to Claim? The following is a sample of the data in each product.

Intuitively, these two products have lots of overlap. Every Cust_Nbr in Claim has a corresponding Customer_ID in Customer. There is no foreign key constraint in Claim that assures us it points to Customer. We think there is enough similarity to infer a join relationship.
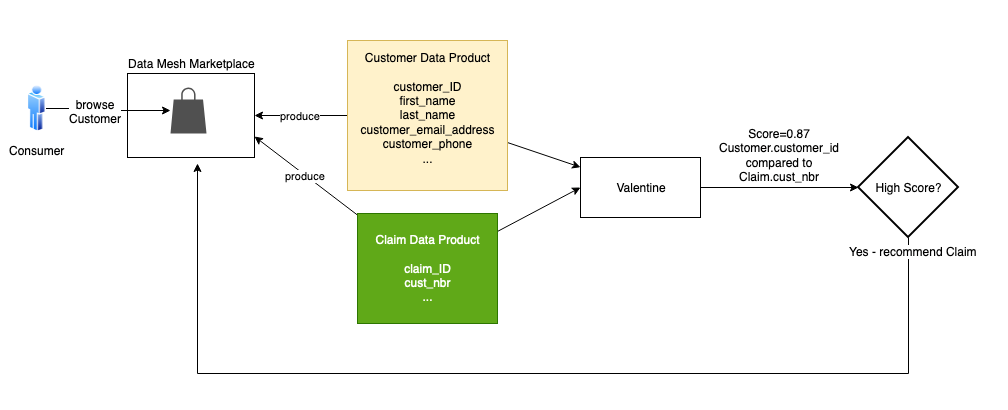
The data science algorithm Valentine is an effective tool for this. Valentine is presented in the paper Valentine: Evaluating Matching Techniques for Dataset Discovery (2021, Koutras et al.). Valentine determines if two datasets are joinable or unionable. We focus on the former. Two datasets are joinable if a record from one dataset has a link to a record in the other dataset using one or more columns. Valentine addresses the use case where data is messy: there is no foreign key constraint in place, and data doesn’t match perfectly between datasets. Valentine looks for similarities, and its findings are probabilistic. It scores its proposed matches.
This solution uses an implementation of Valentine available in the following GitHub repo. The first step is to load each data product from its source into a Pandas data frame. If the data is large, load a representative subset of it, at most a few million records. Pass the frames to the valentine_match() function and select the matching method. We use COMA, one of several methods that Valentine supports. The function’s result indicates the similarity of columns and the score. In this case, it tells us that the Customer_ID for Customer matches the Cust_Nbr for Claim, with a very high score. We then instruct the data mesh to recommend Claim to the consumer browsing Customer.
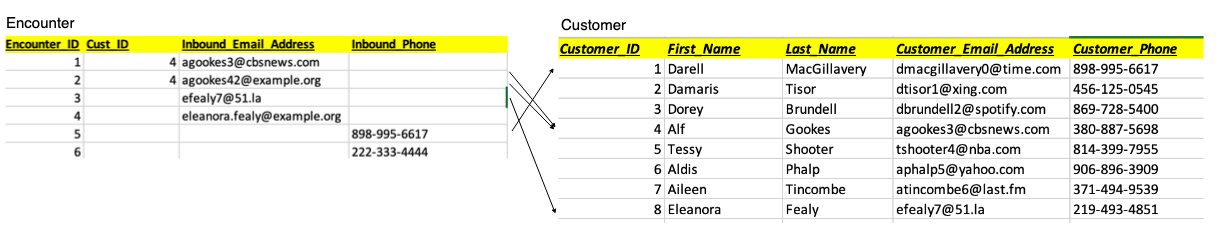
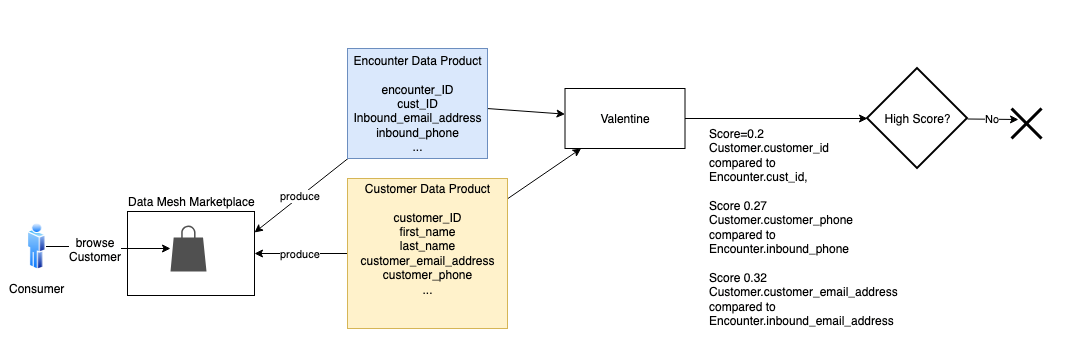
A graph database isn’t required to recommend Claim; the two products could be directly compared. But let’s consider Encounter. Is Customer similar to Encounter? This case is more complicated. Many encounters in the Encounter product don’t link to a customer. An encounter occurs when someone contacts the contact center, which could be by phone or email. The party may or may not be a customer, and if they are a customer, we may not know their customer ID during this encounter. Additionally, sometimes the phone or email they use isn’t the same as the one from a customer record in the Customer product.
In the following sample encounter set, encounters 1 and 2 match to Customer_ID 4. Note that encounter 2’s inbound_email doesn’t exactly match the inbound_email in that customer’s record in the Customer product. Encounter 3 has no Customer_ID, but its inbound_email matches the customer with ID 8. Encounter 4 appears to refer to the customer with ID 8, but the email doesn’t match, and no Customer_ID is given. Encounter 5 only has Inbound_Phone, but that matches the customer with ID 1. Encounter 6 only has an Inbound_Phone, and it doesn’t appear to match any of the customers we’ve listed so far.
We don’t have a strong enough comparison to infer similarity.
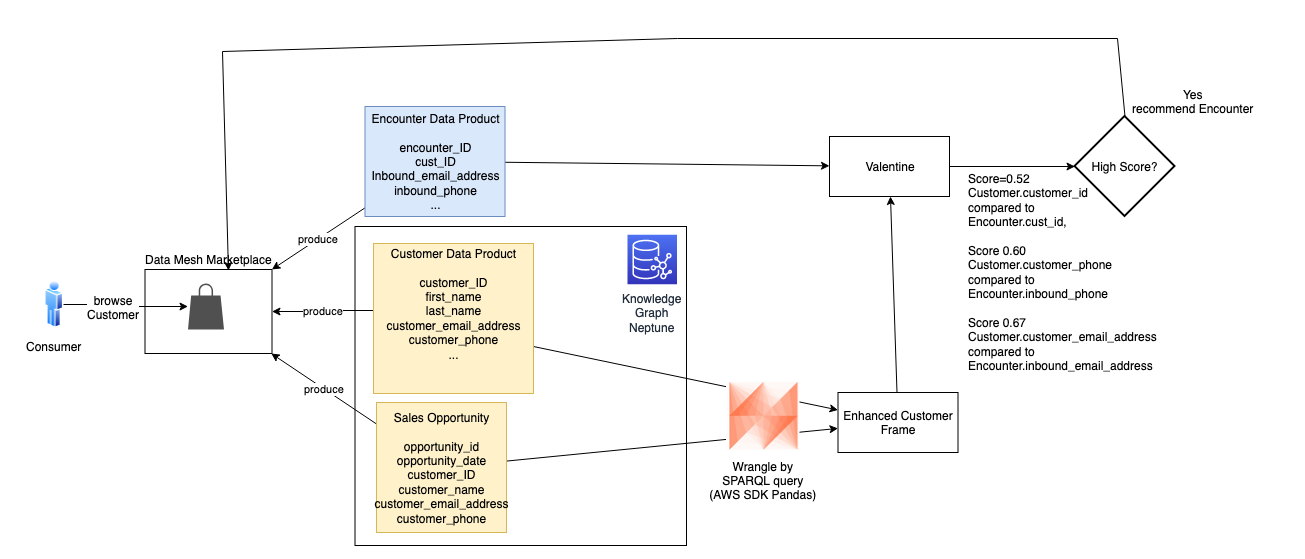
But we know more about the customer than the Customer product tells us. In the Neptune database, we maintain a knowledge graph that combines multiple products and links them through relationships. A knowledge graph allows us to combine data from different sources to gain a better understanding of a specific problem domain. In Neptune, we combine the Customer product data with an additional data product: Sales Opportunity. We ingest each product from its source into the knowledge graph and model a hasSalesOpportunity relationship between Customer and SalesOpportunity resources. The following figure shows these resources, their attributes, and their relationship.
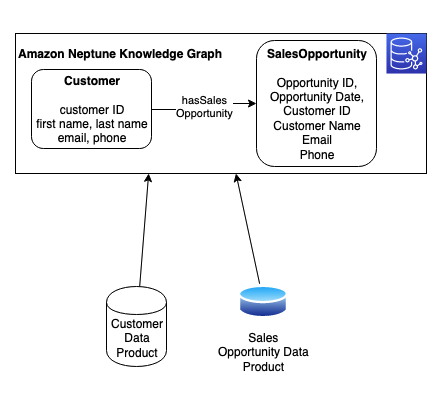
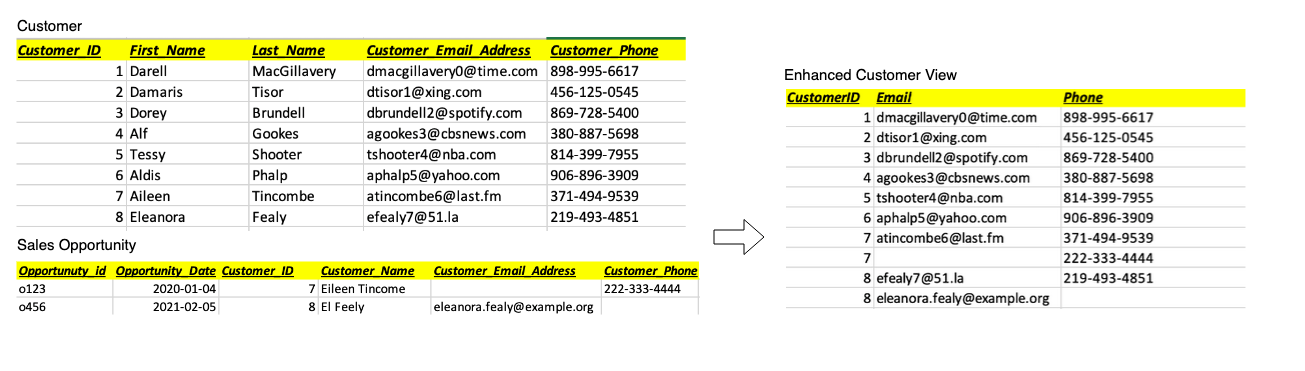
With the AWS SDK for Pandas, we combine this data by running a query against the Neptune graph. We use a graph query language (such as SPARQL) to wrangle a representative subset of customer and sales opportunity data into a Pandas data frame (shown as Enhanced Customer View in the following figure). In the following example, we enhance customers 7 and 8 with alternate phone or email contact data from sales opportunities.
We pass that frame to Valentine and compare it to Encounter. This time, two additional encounters match a customer.
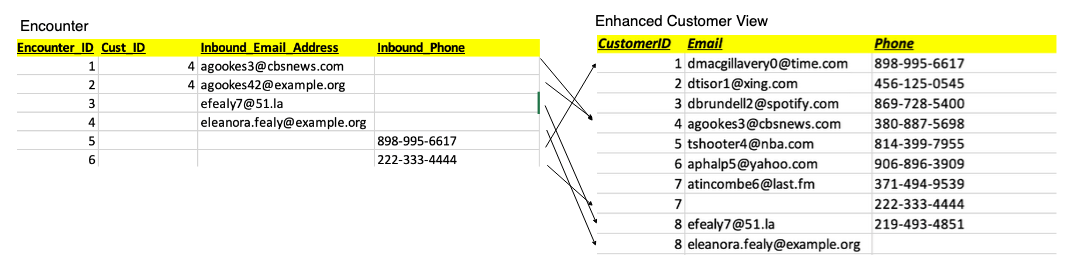
The score meets our threshold, and is high enough to share with the consumer as a possible match. To the customer browsing Customer in the mesh marketplace, we present the recommendation of Encounter, along with scoring details to support the recommendation. With this recommendation, the consumer can explore the Encounter product with greater confidence.
Conclusion
Data-driven organizations are transitioning to a data product way of thinking. Utilizing strategies like data mesh generates value on a large scale. We took this a step further by creating a blueprint to create smart recommendations by linking similar data products using graph technology and ML. In this post, we showed how an organization can augment a data catalog with additional metadata by using ML and Neptune with an automated process.
This solution solves the interoperability and linkage problem for data products. Additionally, it gives organizations real-time insights, agility, and innovation without spending time on data analysis and research. This approach creates a truly connected ecosystem with simplified access to delight your data consumers. The current solution is platform agnostic; however, in a future post we will show how to implement this using data.all (open-source software) and Amazon DataZone.
To learn more about ML in Neptune, refer to Amazon Neptune ML for machine learning on graphs. You can also explore Neptune notebooks demonstrating ML and data science for graphs. For more information about the data mesh architecture, refer to Design a data mesh architecture using AWS Lake Formation and AWS Glue. To learn more about Amazon DataZone and how you can share, search, and discover data at scale across organizational boundaries.
About the Authors
 Moira Lennox
is a Senior Data Strategy Technical Specialist for AWS with 27 years’ experience helping companies innovate and modernize their data strategies to achieve new heights and allow for strategic decision-making. She has experience working in large enterprises and technology providers, in both business and technical roles across multiple industries, including health care live sciences, financial services, communications, digital entertainment, energy, and manufacturing.
Moira Lennox
is a Senior Data Strategy Technical Specialist for AWS with 27 years’ experience helping companies innovate and modernize their data strategies to achieve new heights and allow for strategic decision-making. She has experience working in large enterprises and technology providers, in both business and technical roles across multiple industries, including health care live sciences, financial services, communications, digital entertainment, energy, and manufacturing.
 Joel Farvault is Principal Specialist SA Analytics for AWS with 25 years’ experience working on enterprise architecture, data strategy, and analytics, mainly in the financial services industry. Joel has led data transformation projects on fraud analytics, claims automation, and data governance.
 Mike Havey is a Solutions Architect for AWS with over 25 years of experience building enterprise applications. Mike is the author of two books and numerous articles. His Amazon author page