AWS Big Data Blog
Build a Community of Analysts with Amazon QuickSight
Imagine you’ve just landed your dream job. You’ve always liked tackling the hardest problems and you’ve got one now: You’ll work for a chain of coffee shops that’s struggling against fierce competition, tight budgets, and low morale. But there’s a new management team in place. As head of business intelligence (BI), you think you can be part of the team that turns things around.
Your new company (let’s call them CoffeeCo) has already invested heavily in analytics, and staff at the head office has access to a wealth of reports. But you quickly see that the problem the company faces isn’t a lack of reports—it lies elsewhere.
You know that there’s a manager at each coffee shop who’s working hard to boost sales by running promotions and encouraging use of a reward card. However, CoffeeCo’s tight budgets prevent sharing much of the existing analytics with these managers, so they struggle to see the impact of their actions. In fact, anything beyond a daily email containing limited sales data is considered too expensive. Perhaps more information will give the managers the insights they need to boost their sales. By using AWS, you’re sure you can test your ideas by building a solution that’s easy to use, robust and low cost.
Day one
On your first day, you sit down with the IT team and sketch out the architecture that you’d like built:
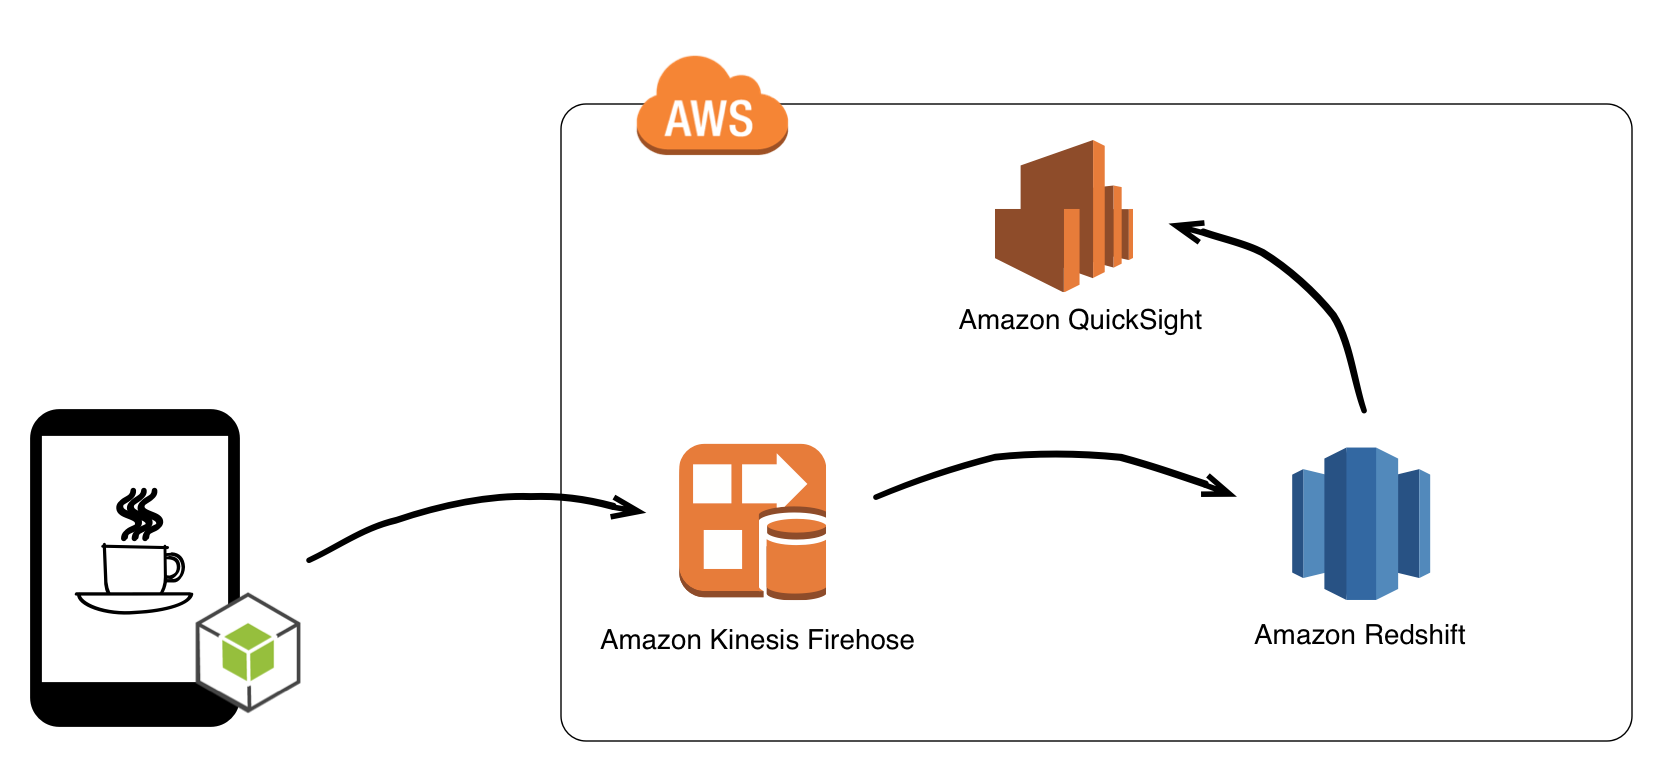
Your architecture is based on fully managed AWS services to ensure cost-effective operation and no long-term lock-in. Data will be sent to Amazon Kinesis Firehose, which is a fully managed service for delivering real-time streaming data to destinations such as Amazon Simple Storage Service (Amazon S3), Amazon Redshift, or Amazon OpenSearch Service. You choose to deliver your data to Amazon Redshift, a fully managed, petabyte-scale data warehouse service. Finally, in order to visualize the data, you will load it into Amazon QuickSight.
Data from each coffee shop needs to be sent to Firehose. At first, you think this might be a difficult task, not least because it involves changing the point of sale (POS) system used in each coffee shop. Fortunately, you discover each POS is an Android tablet, and you can use the AWS SDK for Android to send data.
One architectural decision you need to make is whether to use SPICE or have QuickSight directly query Redshift. SPICE (or Super-Fast Parallel In-memory Calculation Engine) is an in-memory calculation engine that is designed and optimized specifically to power fast, interactive data visualizations. SPICE can complement your Amazon Redshift cluster by off-loading BI requests, ensuring that ad hoc reporting queries don’t unnecessarily affect your production data warehouse. You can use SPICE to build a reporting data mart, combining data from many different sources such as Redshift, Amazon RDS, Amazon Aurora, files such as Excel or csv, or web apps like Salesforce. SPICE can manage access to your data; you can give business users access to your reporting data mart rather than granting direct access to your data sources.
Since you introduced your IT team to Amazon Redshift, they’ve decided to load additional data to build out a full data warehouse. You therefore decide to use SPICE so that your ad hoc reporting queries don’t have a negative impact on this new and important project.
Preparing data
It doesn’t take your IT team long to build your architecture and provide you with sign-in information for the AWS Management Console and Amazon Redshift. Now that you have access to the environment, your first task is to prepare the data that you will use in your analysis. To do this, you sign in to Amazon QuickSight and create a new dataset by choosing the Manage Data button and then choosing New data set. Because Amazon QuickSight allows you to come back later and change the dataset, it doesn’t matter if you don’t get everything the coffee shop managers need in the first pass. You can always iterate to improve.
When your IT team configured your solution, they gave Amazon QuickSight permission to autodiscover Amazon Redshift clusters. This permission means that when you choose to connect to an Amazon Redshift data source, you see a list of clusters that are running in your region. You still need to enter a user name and password to get access to the data, but don’t need to worry about remembering connection strings or server names.
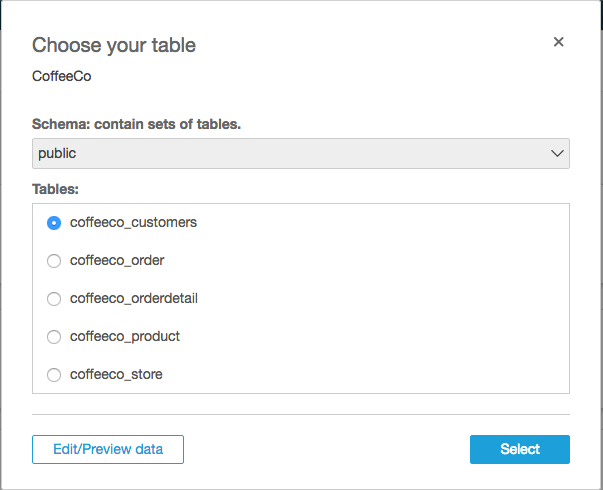
Once the connection to Amazon Redshift has been established, you choose the schema and table you want to work with. Because your data contains more than one table, you choose the Edit/Preview data button at the bottom left of the screen:
When you prepare data, you can choose to:
- Choose whether to use SPICE
- Add extra tables to the dataset and configure the joins
- Include or exclude fields from the dataset
- Change the name of fields or alter the data type
- Add calculated fields to the dataset
- Filter the dataset, so that not all rows from the data source are imported
Your IT team have used Amazon Redshift to build a standard retail data model in third normal form:
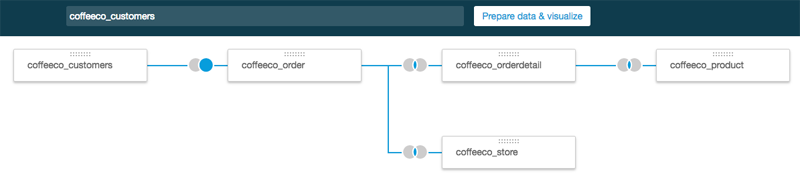
At the center of the model is an order (coffeeco_order in the diagram) that will contain one or more lines (coffeeco_orderdetail table). The order table links to the store where the purchase was made and the customer who made the purchase. The order detail table links to the product that was purchased. All the joins have been marked as inner, except for the right join between the customer and order tables. Although most purchases are anonymous, those that are made using a loyalty card will join to the customer table.
Choosing Prepare data & visualize at the top of the screen will import your data into SPICE. Then you’re ready to start your first analysis.
Sharing knowledge
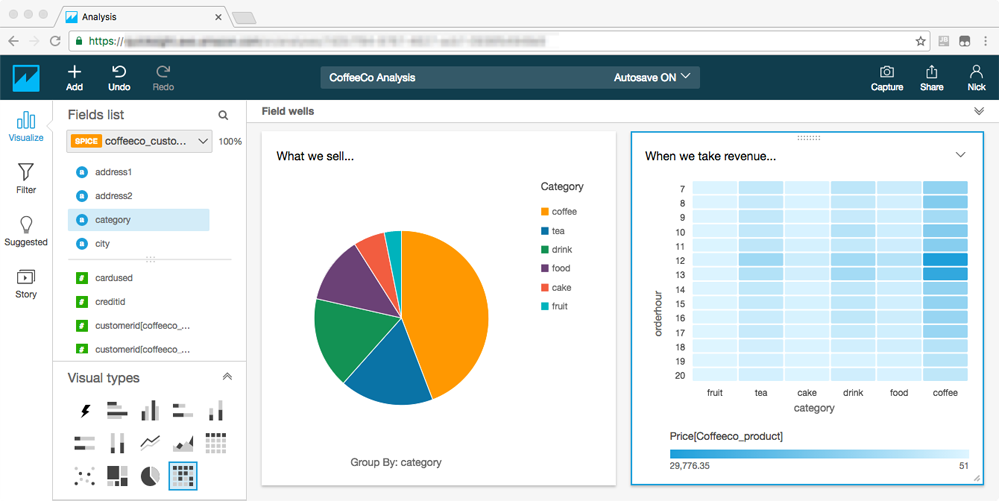
In Amazon QuickSight, you use an analysis to create and interact with visuals and stories. You can think of an analysis as a blank canvas onto which you can drop graphical representations of your data, or visuals.
You quickly use Amazon QuickSight to build an analysis containing visuals that show some of the metrics you think will interest the coffee shop managers. The easiest way to share this with the coffee shop managers is to build a dashboard. This is a read-only view of your analysis that can you can give to other Amazon QuickSight users. Before sharing, you use the button on the left of the screen to add a filter which allows users to restrict the results shown to a particular coffee shop. You are now ready to share your dashboard—all you need now is some managers who are prepared to help you test the system.
A few phone calls later, you’ve found some managers who are willing to help beta test. You sign them up as Amazon QuickSight users and share the dashboard with them. To do this, you just need to choose the Share button at the top right of the screen and choose Create Dashboard. The dashboard will then appear on the managers’ Dashboards tab when they sign in to Amazon QuickSight.
None of the managers are database experts, but this doesn’t matter when they use Amazon QuickSight. All interaction is through the UI, and they can easily manipulate the dashboard using either the website or the mobile app.
The coffee shop managers can’t change anything on the dashboard apart from the filter. Feedback from the beta testers is good, and most seem content to use the information you’ve provided. However, after a few days you notice that a couple of the testers want to dive deeper into the data and keep phoning up to ask you to change the metrics that are displayed on the dashboard. You decide the easiest way is to share the analysis with these managers. By choosing the Share button and then choosing Share analysis, you can give other users full access to an analysis. When the mangers sign in to Amazon QuickSight, they will see the analysis on their home screen:

The managers are now free to alter the visuals on your analysis and add their own. However, they won’t see the dataset if they choose the Manage data button. This protects the dataset from being accidently altered by the users.
Telling stories
Over the next few weeks, you don’t hear much from your beta testers, as they spend time with Amazon QuickSight getting to know their data. Then, you get a call from one manager. That manager has found something interesting and wants to show you. You explain that the easiest way to do this is to build a story.
We’re all used to showing slide decks to present a case for business change. An Amazon QuickSight story is similar; it allows users to create a narrative through a series of sequential scenes. However, when you build a story in Amazon QuickSight, the visuals are captured rather than the data. This means that when you play back the story, each scene is recalculated, so the story always reflects the current data.
Every analysis in Amazon QuickSight comes with an empty, default story, and extra stories can always be added. You can add a scene to a story by choosing the Capture button in the top right hand of the screen.
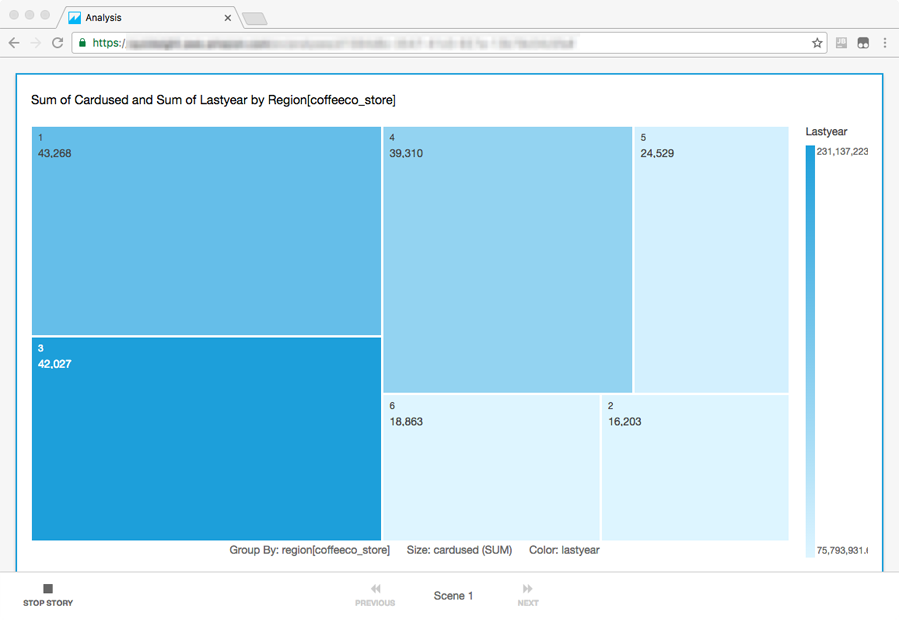
The manager has spent time looking at different sales regions and how effectively the promotion card is used. The first scene in the story shows that cards are used a lot more frequently in one particular region:
Through a series of scenes, the story goes on to reveal more details of the promotions being run in this region and explains why they are successful. It turns out that, in this case, locally organized campaigns work much better than those initiated by the head office. Plus, CoffeeCo sees the best results when the promotion is tied to a local event such as a half-marathon or parade. You quickly see that this is a strategy other coffee shops can adopt. If you run fewer promotions from head office and use the money saved to feed local campaigns, then you might see an overall boost to your sales. You can implement the insight that the manager described in the story as an action to help everyone.
Summary
In this post, I have shown how Amazon QuickSight can be used to share dashboards, analyses, and stories. Although fictitious, CoffeeCo, like many companies, benefits from distributing information to people who understand its context and can act on the insights that it contains. However, just giving information sometimes isn’t enough; it needs to be in a format that’s easy to understand and easy to manipulate. At one-tenth of the cost of traditional BI solutions and no long-term lock-in, Amazon QuickSight allows you to quickly build a community of users in your organization, delivering rich BI functionality.
You can start using Amazon QuickSight today by visiting www.quicksight.aws.
If you have any questions or suggestions, leave a comment below.
About the author
 Nick Corbett is a Senior Consultant for AWS Professional Services. He works with our customers to provide leadership on big data projects, helping them shorten their time to value when using AWS. In his spare time, he follows the Jürgen Klopp revolution.