AWS Big Data Blog
How 1Strategy simplified their spreadsheet ETL process using AWS Glue DataBrew
This is a guest blog post by Pat Reilly and Gary Houk at 1Strategy. In their own words, “1Strategy is an APN Premier Consulting Partner focusing exclusively on AWS solutions. 1Strategy consultants help businesses architect, migrate, and optimize their workloads on AWS, creating scalable, cost-effective, secure, and reliable solutions. 1Strategy holds the AWS DevOps, Migration, Data & Analytics, and Machine Learning Competencies, and is a member of the AWS Well-Architected and the AWS Public Sector partner programs.”
Accurately reporting hours billed to each customer is critical to 1Strategy’s business operations. Each consultant is responsible for keeping records up to date. To promote visibility into work completed and hours used vs. hours remaining, 1Strategy provides customers with a weekly report.
Historically, this data was in the hands of a select few managers who alerted their teams when hours were getting low or the contract was nearing expiry. This data was delivered in the form of an Excel spreadsheet as an extract from the system of record for billable hours and sent every morning to those managers. This top-down method of sharing information meant that the people delivering the work were often the last to receive it. Frequently, reports were received too late to add any meaningful support to a customer conversation.
As part of an AWS Data Lab, the 1Strategy team built a data lake to empower reporting across consultants within the company. The main data source was a spreadsheet, which held billable daily hours for every employee in our company. At the time, the only method available for ingesting this was AWS Glue. It was better than nothing; however, it introduced more complexity than warranted given the use case. For example, AWS Glue does not support parsing Excel file formats out of the box so you are required to provide your own Python libraries to use in the job.
For this reason, we used two AWS Glue jobs: one to parse the spreadsheet into CSV format, and another to convert it to Parquet. Coupled with AWS Glue crawlers so our Data Catalog is current, this process can take up to 40 minutes to complete and spans multiple Amazon Simple Storage Service (Amazon S3) buckets.
AWS Glue DataBrew changes that. AWS Glue DataBrew is a new visual data preparation tool that enables customers to clean and normalize data without writing code. DataBrew makes writing extract, transform, and load (ETL) jobs against an Excel spreadsheet immensely easier and faster to build than anything currently available in the AWS data landscape. Aside from simplifying the engineering, the interface is built to be friendly to less technical end users. In the context of the 1Strategy data lake, this lowers the barrier for people who want to use the data by taking the development out of the hands of engineers, who can spend their time on more critical or more complex problems.
Solution overview
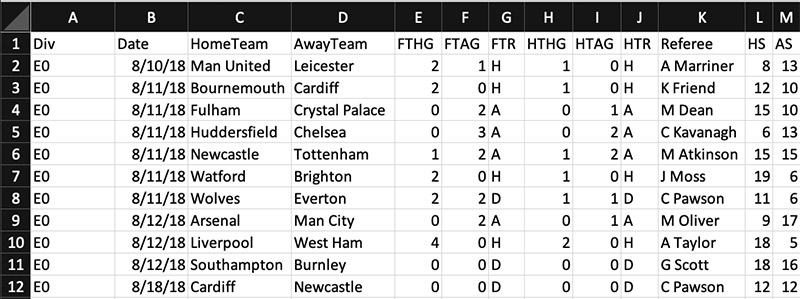
As an illustration of how you can use DataBrew to write ETL, let’s walk through how to do this using a sample dataset from the English Premier League (EPL). The data consists of 380 rows by 58 columns with data from individual football matches in an Excel spreadsheet. The following screenshot shows a small sample of the raw data.
To implement our solution, you complete the following high-level steps:
- Create your dataset.
- Create a project.
- Add recipe steps and fill in missing values.
- Concatenate columns.
- Format and split columns.
- Rename the columns.
- Create your DataBrew job.
- Review the results in Amazon S3.
- Analyze the results.
Creating your dataset
We start by creating a dataset.
- Convert the CSV format into an Excel spreadsheet.
DataBrew supports CSV, but for this post, we use an Excel file.
- Upload your spreadsheet to an S3 location.
To give DataBrew the data, we create a dataset, which can take the form of a file upload, an S3 object or path, or metadata stored in your Data Catalog. For this post, we use an Excel spreadsheet stored in Amazon S3.
- On the DataBrew console, in the navigation pane, choose Datasets.
- Choose Connect new dataset.

- For Dataset name, enter a name.
- For Enter your source from S3, enter the full S3 object key name.

- Choose Create dataset.
Creating a project
Projects are a collection of transformation steps called recipes, which are run on your data. They offer a user interface to interact with your data using a functionality that is very familiar to people who regularly use spreadsheets.
- On the DataBrew console, in the navigation pane, choose Projects.
- Choose Create project.

- For Project name, enter a name for your project.
- For Select a dataset, select My datasets.
- Search for and select your dataset.
- In the Permissions section, for Role name, choose Create new IAM role.
This step creates an AWS Identity and Access Management (IAM) role to give DataBrew the necessary permissions to access your data.
- For New IAM role suffix, add an optional suffix.
- Choose Create project.

- Wait for DataBrew to parse your spreadsheet and generate statistics.
When DataBrew is done parsing your spreadsheet, you’re presented with an interface. The menu bar contains familiar spreadsheet-like functions. You can apply these as transformations to your data and add them as steps to your recipe.

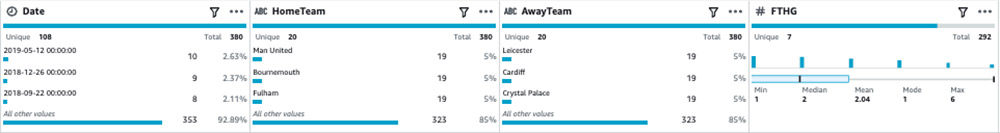
DataBrew also profiles your sample data automatically to describe the distribution of values so you can more quickly understand your data.
Adding recipe steps and filling in missing values
Recipes are the lists of transformation steps your data goes through to meet your business requirements. They also serve as the logic every time a job from a specific recipe is run.
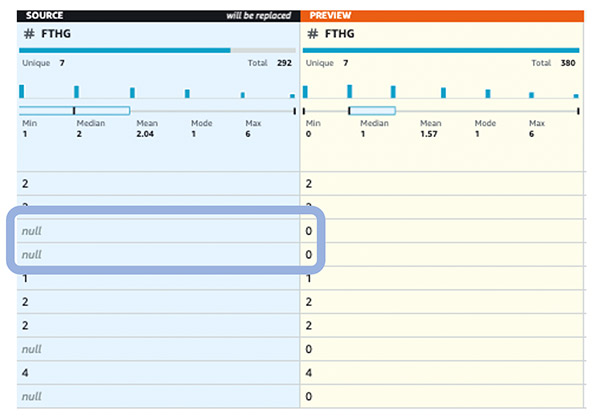
We start by replacing null values in the Full-Time Home Goals (FTHG) and Full-Time Away Goals (FTAG) columns.
- On your project page, choose the … icon for the column to adjust.
- Choose Remove or fill missing values.
- Choose Fill with custom value.
- Use the custom value
0.

- Choose Preview changes to verify the changes.
- To confirm the changes, choose Apply.
You should now see zeroes instead of null values in your columns.
Concatenating columns
Now you create a Full-Time Score column by concatenating the FTHG and FTAG columns with a hyphen. The results should look something like “3-2” where the 3 is the FTHG and the 2 is the FTAG.
- In the Recipe pane, choose Add step.

This appends your step to the end of your current list. Alternatively, you can import an existing recipe to add those steps to your recipe. Do so by choosing the … icon and Import recipe. We don’t use this method for this post.

- In the Add step section, choose the merge step.
- Choose Merge columns.

- For Source column, choose FTHG and FTAG.
- For Separator, enter
-(hyphen). - For New column name¸ enter
FT_SCORE.

- To confirm the changes, choose Apply.
Formatting and splitting columns
Now we split the date column into its year, month, and day parts so that each is its own column. We use these columns to partition our data in our job output.
- Choose Format column.
- For Source column, choose Date.
- For Format column to, choose Date-time format.
- For Choose date-time format, select mm/dd/yyyy.
- For Apply transform to, select All rows.
- Choose Apply.

You now split the column using a single delimiter.
- On the Date column, choose the … icon.
- Choose Format.
- Choose date-time formats.
- Choose mm/dd/yyyy.

- For Split column, choose Date.
- For Split column options, choose Using delimiters.
- For Split column, select On a single delimiter.
- For Delimiter, select Enter custom value
- Enter
/(forward slash).
We use the forward slash as our delimiter because our date format always has two slashes.
- For Number of times to split¸ choose 2.
- Choose Apply.

Renaming columns
To rename your columns, complete the following steps:
- On the source column, choose the … icon.
- Choose Rename.

- Rename each new column to its unit of date.
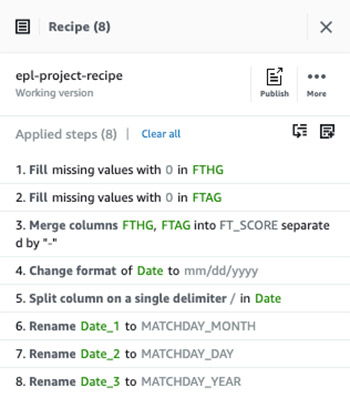
Your recipe steps should look like the following screenshot when you’re finished. Note the naming of the new day, month, and year columns.
Creating a DataBrew job
Now we create the DataBrew job that runs our recipe steps in succession and outputs the result set to Amazon S3 in snappy Parquet format.
- In the navigation pane, choose Jobs.
- Choose Create job.

- For Job name, enter a name for your job.
- For Job type, select Create a recipe job.
- For Job input, select Project.
- For Select a project, choose the project you created.

- In the Job output settings section, for File type¸ choose Parquet.
Apache Parquet is an open-source columnar storage file format that is optimized for use in Hadoop frameworks you find in Amazon EMR, AWS Glue, and more. It’s also well supported by Amazon Redshift. Other commonly known file types are also available to use.
- For Compression, choose Snappy.
At scale, compressing our output conserves Amazon S3 storage costs.
- Under Additional configuration, for Custom partition by column values, match the year, month, and day columns in that order.
This step separates data into separate S3 prefixes based on the date of the match. Partitioning by date is a common approach to organizing data at scale to reduce scans on your data. Queries that use these partitions to find data only scan prefixes relevant to their filter or where clause.
- In the Permissions section, for Role name, choose the DataBrew IAM role we created.
- Choose Create and run job.

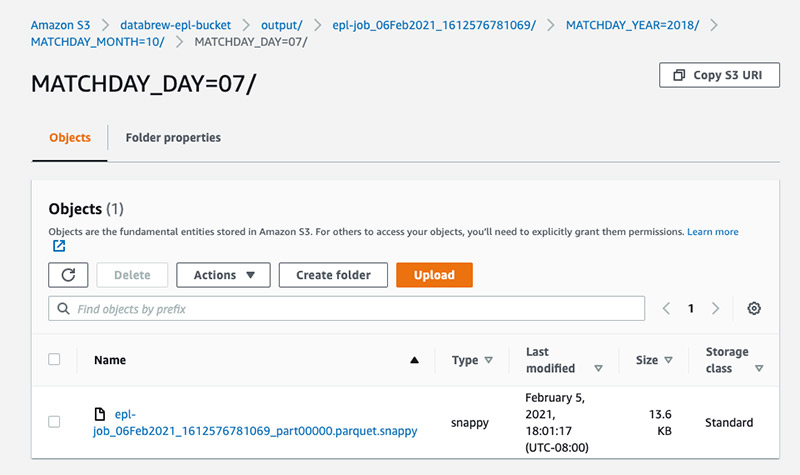
Viewing results in Amazon S3
Verify the data is stored in our S3 location and partitioned by the columns specified. The file format should be .parquet.snappy.
Analyzing the results
You’ve completed the DataBrew portion of this post. You can now add an AWS Glue crawler to infer the schema of your data, and query it using Amazon Athena. The crawler automatically infers the schema, and our new column FT_SCORE is now available. Because adding the crawler is beyond the scope of this article, we only present the results of this process in the following screenshot.

Conclusion
In this post, we created a basic DataBrew job with a recipe that transforms our spreadsheet. This job outputs our data to Amazon S3 in snappy Parquet format, and you can schedule the job using DataBrew or other AWS services like AWS Step Functions (for more information, see Orchestrating an AWS Glue DataBrew job and Amazon Athena query with AWS Step Functions).
DataBrew makes the development process for common ETL transformations simpler and easier to implement across your data lake. This empowers you to write logic to your exact specifications and lowers the barriers to developing ETL from nearly any data source.
About AWS Glue DataBrew
AWS Glue DataBrew is a visual data preparation tool for AWS Glue that allows data analysts and data scientists to clean and transform data with an interactive, point-and-click visual interface, without writing any code. With DataBrew, you can easily access and visually explore any amount of data across your organization directly from your S3 data lake, Amazon Redshift data warehouse, and Amazon Aurora and Amazon Relational Database Service (Amazon RDS) databases. You can choose from over 250 built-in functions to combine, pivot, and transpose the data without writing code. DataBrew recommends data cleaning and normalization steps like filtering anomalies, normalizing data to standard date and time values, generating aggregates for analyses, and correcting invalid, misclassified, or duplicative data. For complex tasks like converting words to a common base or root word (such as converting “yearly” and “yearlong” to “year”), DataBrew also provides transformations that use advanced machine learning (ML) techniques like natural language processing (NLP). You can then save these cleaning and normalization steps into a workflow (called a recipe) and apply them automatically to future incoming data. If changes need to be made to the workflow, data analysts and data scientists simply update the cleaning and normalization steps in the recipe, and the steps are automatically applied to new data as it arrives. DataBrew publishes the prepared data to Amazon S3, which makes it easy for you to immediately use it in analytics and ML. DataBrew is serverless and fully managed, so you never need to configure, provision, or manage any compute resources.
About the Authors
 Pat Reilly is a Sr. Data Engineer for 1Strategy, an AWS Premier Consulting Partner, and specializes in Data Engineering and Analytics. He builds data pipelines and event-driven data architectures to support data-driven decision making. He is not a former NBA basketball coach, but he is passionate about soccer and spending time with his family.
 Gary Houk is a Data Science and Cloud Engineering Consultant. He researches, designs, and productionizes well-architected AWS Machine Learning (ML) solutions in partnership with clients in order to help them develop the skills necessary to maintain and expand their ML capabilities. He is passionate about running and Scrabble.