AWS Big Data Blog
Improve reliability and reduce costs of your Apache Spark workloads with vertical autoscaling on Amazon EMR on EKS
Amazon EMR on Amazon EKS is a deployment option offered by Amazon EMR that enables you to run Apache Spark applications on Amazon Elastic Kubernetes Service (Amazon EKS) in a cost-effective manner. It uses the EMR runtime for Apache Spark to increase performance so that your jobs run faster and cost less.
Apache Spark allows you to configure the amount of Memory and vCPU cores that a job will utilize. However, tuning these values is a manual process that can be complex and ripe with pitfalls. For example, allocating too little memory can result in out-of-memory exceptions and poor job reliability. On the other hand, too much can result in over-spending on idle resources, poor cluster utilization and high costs. Moreover, it’s hard to right-size these settings for some use cases such as interactive analytics due to lack of visibility into future requirements. In the case of recurring jobs, keeping these settings up to date taking into account changing load patterns (due to external seasonal factors for instance) remains a challenge.
To address this, Amazon EMR on EKS has recently announced support for vertical autoscaling, a feature that uses the Kubernetes Vertical Pod Autoscaler (VPA) to automatically tune the memory and CPU resources of EMR Spark applications to adapt to the needs of the provided workload, simplifying the process of tuning resources and optimizing costs for these applications. You can use vertical autoscaling’s ability to tune resources based on historic data to keep memory and CPU settings up to date even when the profile of the workload varies over time. Additionally, you can use its ability to react to real-time signals to enable applications recover from out-of-memory (OOM) exceptions, helping improve job reliability.
Vertical autoscaling vs existing autoscaling solutions
Vertical autoscaling complements existing Spark autoscaling solutions such as Dynamic Resource Allocation (DRA) and Kubernetes autoscaling solutions such as Karpenter.
Features such as DRA typically work on the horizontal axis, where an increase in load results in an increase in the number of Kubernetes pods that will process the load. In the case of Spark, this results in data being processed across additional executors. When DRA is enabled, Spark starts with an initial number of executors and scales this up if it observes that there are tasks sitting and waiting for executors to run on. DRA works at the pod level and would need an underlying cluster-level auto-scaler such as Karpenter to bring in additional nodes or scale down unused nodes in response to these pods getting created and deleted.
However, for a given data profile and a query plan, sometimes the parallelism and the number of executors can’t be easily changed. As an example, if you’re attempting to join two tables that store data already sorted and bucketed by the join keys, Spark can efficiently join the data by using a fixed number of executors that equals the number of buckets in the source data. Since the number of executors cannot be changed, vertical autoscaling can help here by offering additional resources or scaling down unused resources at the executor level. This has a few advantages:
- If a pod is optimally sized, the Kubernetes scheduler can efficiently pack in more pods in a single node, leading to better utilization of the underlying cluster.
- The Amazon EMR on EKS uplift is charged based on the vCPU and memory resources consumed by a Kubernetes pod.This means an optimally sized pod is cheaper.
How vertical autoscaling works
Vertical autoscaling is a feature that you can opt into at the time of submitting an EMR on EKS job. When enabled, it uses VPA to track the resource utilization of your EMR Spark jobs and derive recommendations for resource assignments for Spark executor pods based on this data. The data, fetched from the Kubernetes Metric Server, feeds into statistical models that VPA constructs in order to build recommendations. When new executor pods spin up belonging to a job that has vertical autoscaling enabled, they’re autoscaled based on this recommendation, ignoring the usual sizing done via Spark’s executor memory configuration (controlled by the spark.executor.memory Spark setting).
Vertical autoscaling does not impact pods that are running, since in-place resizing of pods remains unsupported as of Kubernetes version 1.26, the latest supported version of Kubernetes on Amazon EKS as of this writing. However, it’s useful in the case of a recurring job where we can perform autoscaling based on historic data as well as scenarios when some pods go out-of-memory and get re-started by Spark, where vertical autoscaling can be used to selectively scale up the re-started pods and facilitate automatic recovery.
Data tracking and recommendations
To recap, vertical autoscaling uses VPA to track resource utilization for EMR jobs. For a deep-dive into the functionality, refer to the VPA Github repo. In short, vertical autoscaling sets up VPA to track the container_memory_working_set_bytes metric for the Spark executor pods that have vertical autoscaling enabled.
Real-time metric data is fetched from the Kubernetes Metric Server. By default, vertical autoscaling tracks the peak memory working set size for each pod and makes recommendations based on the p90 of the peak with a 40% safety margin added in. It also listens to pod events such as OOM events and reacts to these events. In the case of OOM events, VPA automatically bumps up the recommended resource assignment by 20%.
The statistical models, which also represent historic resource utilization data are stored as custom resource objects on your EKS cluster. This means that deleting these objects also purges old recommendations.
Customized recommendations through job signature
One of the major use-cases of vertical autoscaling is to aggregate usage data across different runs of EMR Spark jobs to derive resource recommendations. To do so, you need to provide a job signature. This can be a unique name or identifier that you configure at the time of submitting your job. If your job recurs at a fixed schedule (such as daily or weekly), it’s important that your job signature doesn’t change for each new instance of the job in order for VPA to aggregate and compute recommendations across different runs of the job.
A job signature can be the same even across different jobs if you believe they’ll have similar resource profiles. You can therefore use the signature to combine tracking and resource modeling across different jobs that you expect to behave similarly. Conversely, if a job’s behavior is changing at some point in time, such as due to a change in the upstream data or the query pattern, you can easily purge the old recommendations by either changing your signature or deleting the VPA custom resource for this signature (as explained later in this post).
Monitoring mode
You can use vertical autoscaling in a monitoring mode where no autoscaling is actually performed. Recommendations are reported to Prometheus if you have that setup on your cluster and you can monitor the recommendations through Grafana dashboards and use that to debug and make manual changes to the resource assignments. Monitoring mode is the default but you can override and use one of the supported autoscaling modes as well at the time of submitting a job. Refer to documentation for usage and a walkthrough on how to get started.
Monitoring vertical autoscaling through kubectl
You can use the Kubernetes command-line tool kubectl to list active recommendations on your cluster, view all the job signatures that are being tracked as well as purge resources associated with signatures that aren’t relevant anymore. In this section, we provide some example code to demonstrate listing, querying, and deleting recommendations.
List all vertical autoscaling recommendations on a cluster
You can use kubectl to get the verticalpodautoscaler resource in order to view the current status and recommendations. The following sample query lists all resources currently active on your EKS cluster:
This produces output similar to the following
Query and delete a recommendation
You can also use kubectl to purge recommendation for a job based on the signature. Alternately, you can use the --all flag and skip specifying the signature to purge all the resources on your cluster. Note that in this case you’ll actually be deleting the EMR vertical autoscaling job-run resource. This is a custom resource managed by EMR, deleting it automatically deletes the associated VPA object that tracks and stores recommendations. See the following code:
You can use the --all and --all-namespaces to delete all vertical autoscaling related resources
Monitor vertical autoscaling through Prometheus and Grafana
You can use Prometheus and Grafana to monitor the vertical autoscaling functionality on your EKS cluster. This includes viewing recommendations that evolve over time for different job signatures, monitoring the autoscaling functionality etc. For this setup, we assume Prometheus and Grafana are already installed on your EKS cluster using the official Helm charts. If not, refer to the Setting up Prometheus and Grafana for monitoring the cluster section of the Running batch workloads on Amazon EKS workshop to get them up and running on your cluster.
Modify Prometheus to collect vertical autoscaling metrics
Prometheus doesn’t track vertical autoscaling metrics by default. To enable this, you’ll need to start gathering metrics from the VPA custom resource objects on your cluster. This can be easily done by patching your Helm chart with the following configuration:
Here, prometheus-helm-values.yaml is the vertical autoscaling specific customization that tells Prometheus to gather vertical autoscaling related recommendations from the VPA resource objects, along with the minimal required metadata such as the job’s signature.
You can verify if this setup is working by running the following Prometheus queries for the newly created custom metrics:
kube_customresource_vpa_spark_rec_memory_targetkube_customresource_vpa_spark_rec_memory_lowerkube_customresource_vpa_spark_rec_memory_upper
These represent the lower bound, upper bound and target memory for EMR Spark jobs that have vertical autoscaling enabled. The query can be grouped or filtered using the signature label similar to the following Prometheus query:
Use Grafana to visualize recommendations and autoscaling functionality
You can use our sample Grafana dashboard by importing the EMR vertical autoscaling JSON model into your Grafana deployment. The dashboard visualizes vertical autoscaling recommendations alongside the memory provisioned and actually utilized by EMR Spark applications as shown in the following screenshot.
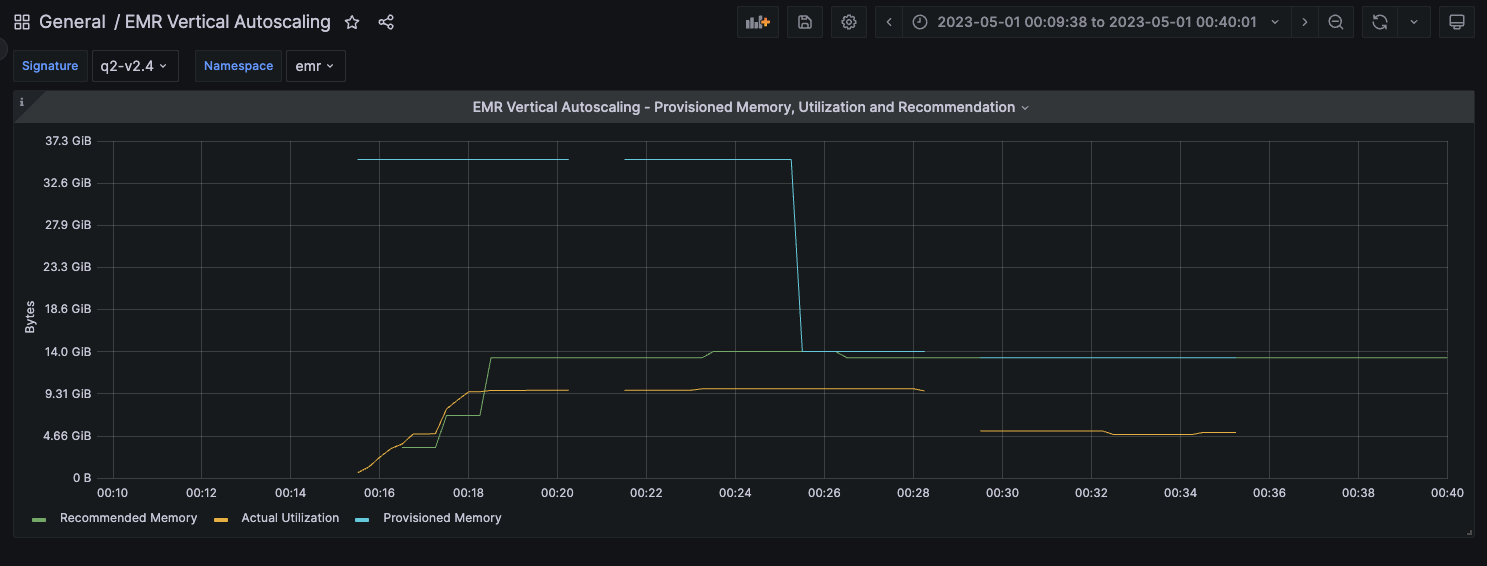
Results are presented categorized by your Kubernetes namespace and job signature. When you choose a certain namespace and signature combination, you’re presented with a pane. The pane represents a comparison of the vertical autoscaling recommendations for jobs belonging to the chosen signature, compared to the actual resource utilization of that job and the amount of Spark executor memory provisioned to the job. If autoscaling is enabled, the expectation is that the Spark executor memory would track the recommendation. If you’re in monitoring mode however, the two won’t match but you can still view the recommendations from this dashboard or use them to better understand the actual utilization and resource profile of your job.
Illustration of provisioned memory, utilization and recommendations
To better illustrate vertical autoscaling behavior and usage for different workloads, we executed query 2 of the TPC-DS benchmark for 5 iterations — The first two iterations in monitoring mode and the last 3 in autoscaling mode and visualized the results in the Grafana dashboard shared in the previous section.
Monitoring mode
This particular job was provisioned to run with 32GB of executor memory (the blue line in the image) but the actual utilization hovered at around the 10 GB mark (amber line). Vertical autoscaling computes a recommendation of approximately 14 GB based on this run (the green line). This recommendation is based on the actual utilization with a safety margin added in.
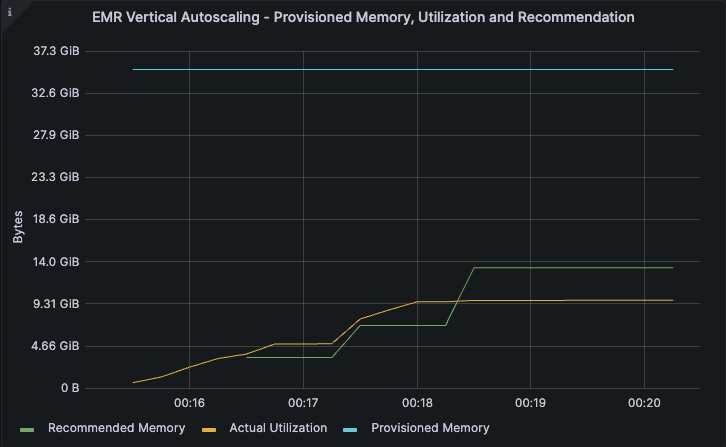
The second iteration of the job was also run in the monitoring mode and the utilization and the recommendations remained unchanged.

Autoscaling mode
Iterations 3 through 5 were run in autoscaling mode. In this case, the provisioned memory drops from 32GB to match the recommended value of 14GB (the blue line).
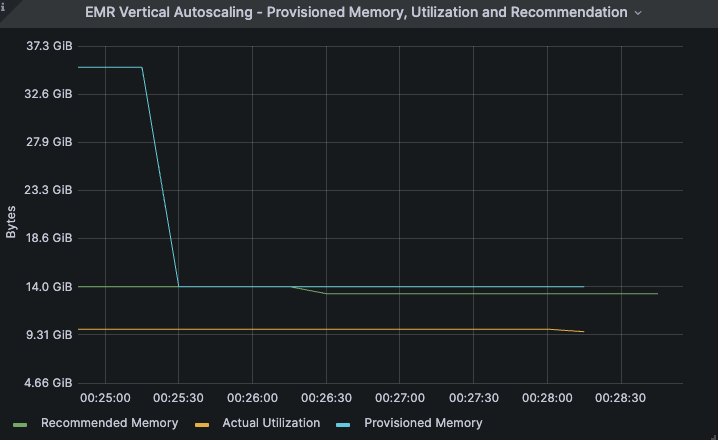
The utilization and recommendations remained unchanged for subsequent iterations in the case of this example. Furthermore, we observed that all the iterations of the job completed in around 5 minutes, both with and without autoscaling. This example illustrates the successful scaling down of the job’s executor memory allocation by about 56% (a drop from 32GB to approximately 14 GB) which also translates to an equivalent reduction in the EMR memory uplift costs of the job, with no impact to the job’s performance.
Automatic OOM recovery
In the earlier example, we didn’t observe any OOM events as a result of autoscaling. In the rare occasion where autoscaling results in OOM events, jobs should usually be scaled back up automatically. On the other hand, if a job that has autoscaling enabled is under-provisioned and as a result experiences OOM events, vertical autoscaling can scale up resources to facilitate automatic recovery.
In the following example, a job was provisioned with 2.5 GB of executor memory and experienced OOM exceptions during its execution. Vertical autoscaling responded to the OOM events by automatically scaling up failed executors when they were re-started. As seen in the following image, when the amber line representing memory utilization started approaching the blue line representing the provisioned memory, vertical autoscaling kicked in to increase the amount of provisioned memory for the re-started executors, allowing the automatic recovery and successful completion of the job without any intervention. The recommended memory converged to approximately 5 GB before the job completed.
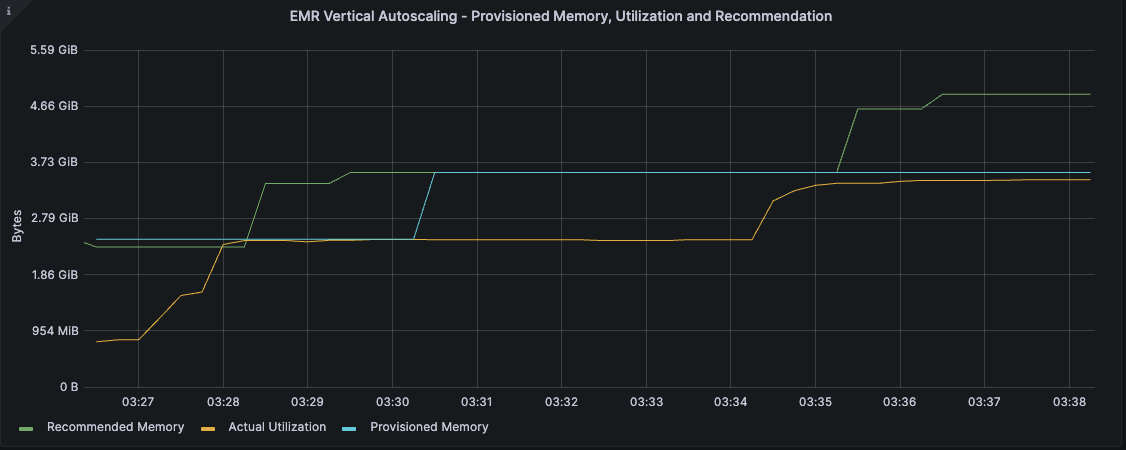
All subsequent runs of jobs with the same signature will now start-up with the recommended settings computed earlier, preventing OOM events right from the start.
Cleanup
Refer to documentation for information on cleaning up vertical autoscaling related resources from your cluster. To cleanup your EMR on EKS cluster after trying out the vertical autoscaling feature, refer to the clean-up section of the EMR on EKS workshop.
Conclusion
You can use vertical autoscaling to easily monitor resource utilization for one or more EMR on EKS jobs without any impact to your production workloads. You can use standard Kubernetes tooling including Prometheus, Grafana and kubectl to interact with and monitor vertical autoscaling on your cluster. You can also autoscale your EMR Spark jobs using recommendations that are derived based on the needs of your job, allowing you to realize cost savings and optimize cluster utilization as well as build resiliency to out-of-memory errors. Additionally, you can use it in conjunction with existing autoscaling mechanisms such as Dynamic Resource Allocation and Karpenter to effortlessly achieve optimal vertical resource assignment. Looking ahead, when Kubernetes fully supports in-place resizing of pods, vertical autoscaling will be able to take advantage of it to seamlessly scale your EMR jobs up or down, further facilitating optimal costs and cluster utilization.
To learn more about EMR on EKS vertical autoscaling and getting started with it, refer to documentation. You can also use the EMR on EKS Workshop to try out the EMR on EKS deployment option for Amazon EMR.
About the author
 Rajkishan Gunasekaran is a Principal Engineer for Amazon EMR on EKS at Amazon Web Services.