AWS Big Data Blog
Improve the Operational Efficiency of Amazon Elasticsearch Service Domains with Automated Alarms Using Amazon CloudWatch
September 8, 2021: Amazon Elasticsearch Service has been renamed to Amazon OpenSearch Service. See details.
A customer has been successfully creating and running multiple Amazon OpenSearch Service domains to support their business users’ search needs across products, orders, support documentation, and a growing suite of similar needs. The service has become heavily used across the organization. This led to some domains running at 100% capacity during peak times, while others began to run low on storage space. Because of this increased usage, the technical teams were in danger of missing their service level agreements. They contacted me for help.
This post shows how you can set up automated alarms to warn when domains need attention.
Solution overview
Amazon ES is a fully managed service that delivers Elasticsearch’s easy-to-use APIs and real-time analytics capabilities along with the availability, scalability, and security that production workloads require. The service offers built-in integrations with a number of other components and AWS services, enabling customers to go from raw data to actionable insights quickly and securely.
One of these other integrated services is Amazon CloudWatch. CloudWatch is a monitoring service for AWS Cloud resources and the applications that you run on AWS. You can use CloudWatch to collect and track metrics, collect and monitor log files, set alarms, and automatically react to changes in your AWS resources.
CloudWatch collects metrics for Amazon ES. You can use these metrics to monitor the state of your Amazon ES domains, and set alarms to notify you about high utilization of system resources. For more information, see Amazon OpenSearch Service Metrics and Dimensions.
While the metrics are automatically collected, the missing piece is how to set alarms on these metrics at appropriate levels for each of your domains. This post includes sample Python code to evaluate the current state of your Amazon ES environment, and to set up alarms according to AWS recommendations and best practices.
There are two components to the sample solution:
- es-check-cwalarms.py: This Python script checks the CloudWatch alarms that have been set, for all Amazon ES domains in a given account and region.
- es-create-cwalarms.py: This Python script sets up a set of CloudWatch alarms for a single given domain.
The sample code can also be found in the amazon-es-check-cw-alarms GitHub repo. The scripts are easy to extend or combine, as described in the section “Extensions and Adaptations”.
Assessing the current state
The first script, es-check-cwalarms.py, is used to give an overview of the configurations and alarm settings for all the Amazon ES domains in the given region. The script takes the following parameters:
The script first identifies all the domains in the given region (or, optionally, limits them to the subset that begins with a given prefix). It then starts running a set of checks against each one.
The script can be run from the command line or set up as a scheduled Lambda function. For example, for one customer, it was deemed appropriate to regularly run the script to check that alarms were correctly set for all domains. In addition, because configuration changes—cluster size increases to accommodate larger workloads being a common change—might require updates to alarms, this approach allowed the automatic identification of alarms no longer appropriately set as the domain configurations changed.
The output shown below is the output for one domain in my account.
The output messages fall into the following categories:
- System overview, Informational: The Amazon ES version and configuration, including instance type and number, storage, automated snapshot hour, etc.
- Free storage: A calculation for the appropriate amount of free storage, based on the recommended 20% of total storage.
- Warnings: best practices that are not being followed for this domain. (For more about this, read on.)
- Alarms: An assessment of the CloudWatch alarms currently set for this domain, against a recommended set.
The script contains an array of recommended CloudWatch alarms, based on best practices for these metrics and statistics. Using the array allows alarm parameters (such as free space) to be updated within the code based on current domain statistics and configurations.
For a given domain, the script checks if each alarm has been set. If the alarm is set, it checks whether the values match those in the array esAlarms. In the output above, you can see three different situations being reported:
- Alarm ok; definition matches. The alarm set for the domain matches the settings in the array.
- Alarm: Threshold does not match. An alarm exists, but the threshold value at which the alarm is triggered does not match.
- WARNING: Missing alarm!! The recommended alarm is missing.
All in all, the list above shows that this domain does not have a configuration that adheres to best practices, nor does it have all the recommended alarms.
Setting up alarms
Now that you know that the domains in their current state are missing critical alarms, you can correct the situation.
To demonstrate the script, set up a new domain named “ver”, in us-west-2. Specify 1 node, and a 10-GB EBS disk. Also, create an SNS topic in us-west-2 with a name of “sendnotification”, which sends you an email.
Run the second script, es-create-cwalarms.py, from the command line. This script creates (or updates) the desired CloudWatch alarms for the specified Amazon ES domain, “ver”.
As with the first script, this script contains an array of recommended CloudWatch alarms, based on best practices for these metrics and statistics. This approach allows you to add or modify alarms based on your use case (more on that below).
After running the script, navigate to Alarms on the CloudWatch console. You can see the set of alarms set up on your domain.
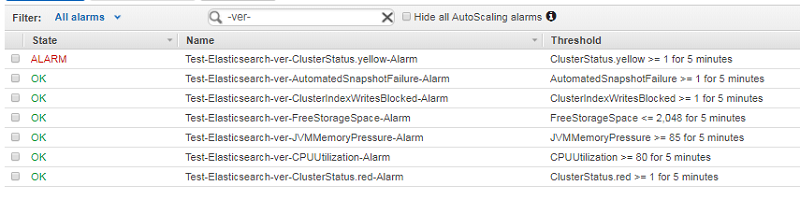
Because the “ver” domain has only a single node, cluster status is yellow, and that alarm is in an “ALARM” state. It’s already sent a notification that the alarm has been triggered.
What to do when an alarm triggers
After alarms are set up, you need to identify the correct action to take for each alarm, which depends on the alarm triggered. For ideas, guidance, and additional pointers to supporting documentation, see Get Started with Amazon OpenSearch Service: Set CloudWatch Alarms on Key Metrics. For information about common errors and recovery actions to take, see Handling AWS Service Errors.
In most cases, the alarm triggers due to an increased workload. The likely action is to reconfigure the system to handle the increased workload, rather than reducing the incoming workload. Reconfiguring any backend store—a category of systems that includes Elasticsearch—is best performed when the system is quiescent or lightly loaded. Reconfigurations such as setting zone awareness or modifying the disk type cause Amazon ES to enter a “processing” state, potentially disrupting client access.
Other changes, such as increasing the number of data nodes, may cause Elasticsearch to begin moving shards, potentially impacting search performance on these shards while this is happening. These actions should be considered in the context of your production usage. For the same reason I also do not recommend running a script that resets all domains to match best practices.
Avoid the need to reconfigure during heavy workload by setting alarms at a level that allows a considered approach to making the needed changes. For example, if you identify that each weekly peak is increasing, you can reconfigure during a weekly quiet period.
While Elasticsearch can be reconfigured without being quiesced, it is not a best practice to automatically scale it up and down based on usage patterns. Unlike some other AWS services, I recommend against setting a CloudWatch action that automatically reconfigures the system when alarms are triggered.
There are other situations where the planned reconfiguration approach may not work, such as low or zero free disk space causing the domain to reject writes. If the business is dependent on the domain continuing to accept incoming writes and deleting data is not an option, the team may choose to reconfigure immediately.
Extensions and adaptations
You may wish to modify the best practices encoded in the scripts for your own environment or workloads. It’s always better to avoid situations where alerts are generated but routinely ignored. All alerts should trigger a review and one or more actions, either immediately or at a planned date. The following is a list of common situations where you may wish to set different alarms for different domains:
- Dev/test vs. production
You may have a different set of configuration rules and alarms for your dev environment configurations than for test. For example, you may require zone awareness and dedicated masters for your production environment, but not for your development domains. Or, you may not have any alarms set in dev. For test environments that mirror your potential peak load, test to ensure that the alarms are appropriately triggered. - Differing workloads or SLAs for different domains
You may have one domain with a requirement for superfast search performance, and another domain with a heavy ingest load that tolerates slower search response. Your reaction to slow response for these two workloads is likely to be different, so perhaps the thresholds for these two domains should be set at a different level. In this case, you might add a “max CPU utilization” alarm at 100% for 1 minute for the fast search domain, while the other domain only triggers an alarm when the average has been higher than 60% for 5 minutes. You might also add a “free space” rule with a higher threshold to reflect the need for more space for the heavy ingest load if there is danger that it could fill the available disk quickly. - “Normal” alarms versus “emergency” alarms
If, for example, free disk space drops to 25% of total capacity, an alarm is triggered that indicates action should be taken as soon as possible, such as cleaning up old indexes or reconfiguring at the next quiet period for this domain. However, if free space drops below a critical level (20% free space), action must be taken immediately in order to prevent Amazon ES from setting the domain to read-only. Similarly, if the “ClusterIndexWritesBlocked” alarm triggers, the domain has already stopped accepting writes, so immediate action is needed. In this case, you may wish to set “laddered” alarms, where one threshold causes an alarm to be triggered to review the current workload for a planned reconfiguration, but a different threshold raises a “DefCon 3” alarm that immediate action is required.
The sample scripts provided here are a starting point, intended for you to adapt to your own environment and needs.
Running the scripts one time can identify how far your current state is from your desired state, and create an initial set of alarms. Regularly re-running these scripts can capture changes in your environment over time and adjusting your alarms for changes in your environment and configurations. One customer has set them up to run nightly, and to automatically create and update alarms to match their preferred settings.
Removing unwanted alarms
Each CloudWatch alarm costs approximately $0.10 per month. You can remove unwanted alarms in the CloudWatch console, under Alarms. If you set up a “ver” domain above, remember to remove it to avoid continuing charges.
Conclusion
Setting CloudWatch alarms appropriately for your Amazon ES domains can help you avoid suboptimal performance and allow you to respond to workload growth or configuration issues well before they become urgent. This post gives you a starting point for doing so. The additional sleep you’ll get knowing you don’t need to be concerned about Elasticsearch domain performance will allow you to focus on building creative solutions for your business and solving problems for your customers.
Enjoy!
Additional Reading
If you found this post useful, be sure to check out Analyzing Amazon OpenSearch Service Slow Logs Using Amazon CloudWatch Logs Streaming and Kibana and Get Started with Amazon OpenSearch Service: How Many Shards Do I Need?
About the Author
 Dr. Veronika Megler is a senior consultant at Amazon Web Services. She works with our customers to implement innovative big data, AI and ML projects, helping them accelerate their time-to-value when using AWS.