AWS Database Blog
Analyzing Amazon Elasticsearch Service Slow Logs Using Amazon CloudWatch Logs Streaming and Kibana
September 8, 2021: Amazon Elasticsearch Service has been renamed to Amazon OpenSearch Service. See details.
Some of our customers have asked for guidance on analyzing Amazon Elasticsearch Service (Amazon ES) slow logs efficiently. Here is what one of these customers said:
“We want to identify, understand, and troubleshoot any slow-running queries in our Amazon Elasticsearch Service environment, so we can fix the application that’s submitting them. We’ve read that Elasticsearch slow logs are now available on Amazon ES. We’ve read a blog post that describes how to view them, but we’d like to have the logs flow into our performance dashboard (also running on Amazon ES). Please help us set this up!”
Do you need to figure out what your slow queries are? Find your worst-performing queries? Debug your index settings? This blog post shows you how.
Solution overview
With the recent announcement of the availability of Elasticsearch slow logs in Amazon ES, you can now configure your Amazon ES clusters to send slow logs to Amazon CloudWatch Logs. There, you can review the slow log messages to gain more insight into the performance of your Amazon ES cluster and identify slow-running search or indexing operations.
CloudWatch Logs supports subscriptions to deliver log messages to other services for post-processing or additional analytics. One of the supported subscriptions is Amazon ES. When you set up a subscription to send the logs to an Amazon ES cluster, the subscription automatically creates a function for you using AWS Lambda. CloudWatch sends all messages to this Lambda function, which then inserts them into the target Amazon ES cluster. The created Lambda function is a generic one that applies to all CloudWatch Logs messages.
However, there is additional structure and information in the slow logs that you can extract and format for easy consumption by your analytics applications. In this post, you use a Kibana dashboard to summarize the slow-running queries and indexing operations. Kibana also makes it easy to locate the details of any items you want to research further.
To implement this solution, you need one Amazon ES cluster that you want to monitor slow logs for, referred to here as the source cluster (or domain). You also need an Amazon ES cluster to receive the slow logs, referred to as the monitoring cluster. For testing purposes, they can be the same domain. To monitor your domains in production, use two different domains.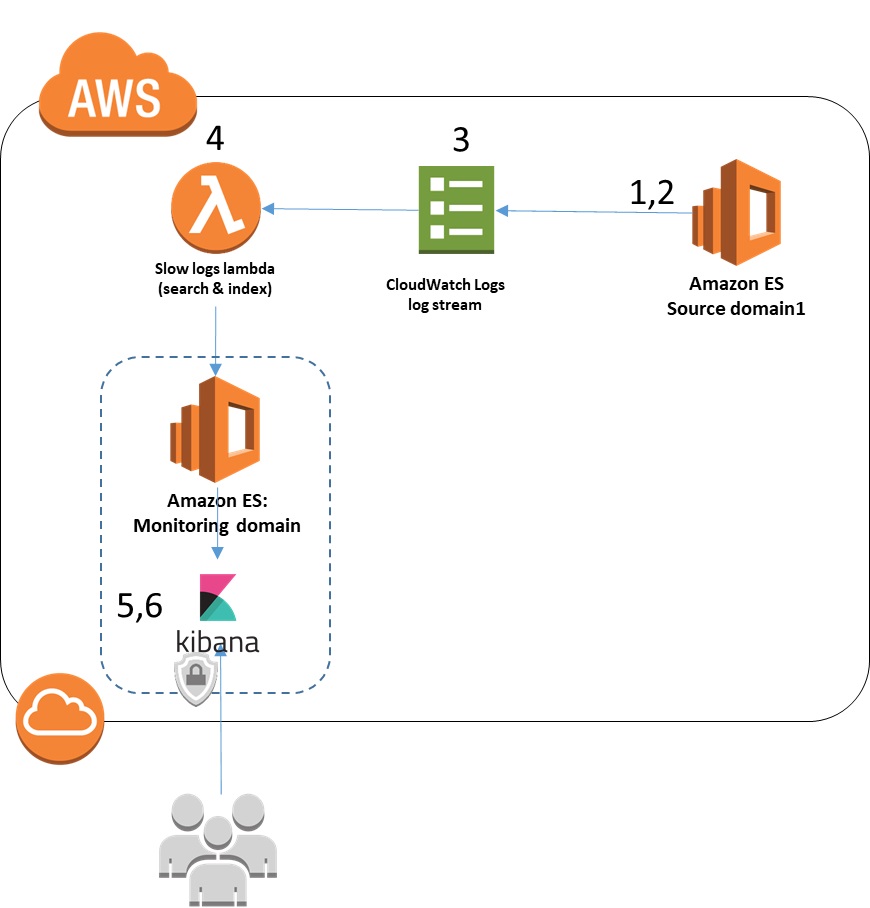
This post walks you through the following steps to implement the solution:
- Configure the source Amazon ES domain to send slow logs to CloudWatch Logs.
- Set the slow logs configuration for the Elasticsearch indexes of interest.
- Set up the CloudWatch log stream to send the slow logs to the monitoring Amazon ES domain.
- Modify the Lambda function that is automatically generated by CloudWatch to format the slow log messages for better usability.
- Set up a Kibana dashboard to graph and review the slow log messages.
- Use the dashboard to diagnose and resolve common problems.
1. Configure the source Amazon ES domain to send slow logs to CloudWatch Logs
To enable slow logs for your Amazon ES cluster (also known as a domain), follow the instructions in Viewing Amazon Elasticsearch Service Slow Logs.
Then, navigate to the CloudWatch console. After the configuration is complete, you see two log groups. If you accepted the default naming convention, the log groups are named /aws/aes/<domain-name>/search-logs, and /aws/aes/<domain-name>/index-logs.
Note that no log streams or events other than the one named es-test-log-stream appear inside the log groups until Amazon ES starts sending slow logs to CloudWatch Logs. This log stream is used only to test access to CloudWatch Logs and is not used thereafter.
The format of the two log groups search-logs and index-logs is similar, but not identical. This affects the processing code you’ll see later.
The following is a line from a slow index log. Note that the last field contains the first section of the inserted data item. You can configure the number of characters of the data item that are included as part of the slow log index setting in Elasticsearch.
In contrast, here’s a line from the search log. Note that the last field shows the query executed:
Now you’ve told Amazon ES to send any slow logs created by your source domain to CloudWatch Logs. But one additional piece must be set up before your slow logs can be sent, and that’s to turn on slow log creation for your indexes of interest. You do that in the next step.
2. Set the slow logs configuration for the Elasticsearch indexes of interest
In this step, you define which indexes and events you want to have logged to the slow logs. As described in the Elasticsearch reference, slow logs are enabled per index. By default, they’re disabled (that is, set to -1) for all indexes. You can specify the slow log settings at index creation time, via an index template (useful if you always want to apply the same settings to each index). They can also be updated dynamically at any time after index creation. For each index, you can define what you want to consider a “slow” query or indexing operation.
The following Elasticsearch command updates an existing index (testmappingdex) to set both index and search slow logs settings to trace all queries and capture the first 255 characters of indexing commands. You can issue this command using the Kibana Dev Tools console plugin (as described in the Kibana User Guide) or via a CURL command (as described in Viewing Amazon Elasticsearch Service Slow Logs).
For another index (testmappingdex2), you might want to focus on indexing operations only, to reduce the volume of logging and focus on the known area of concern. The following command achieves that. It also adds different thresholds for different trace levels and then specifies the trace level above which to log the indexing operations.
You can set different thresholds for different log levels to quickly identify all log messages in a specific performance category (for example, all log messages with a trace level of “info”). The source parameter specifies the number of characters of the indexing operation’s input to place in the log message, so you can get some context for each particular indexing operation.
You need to modify the specific threshold values appropriately for your workloads and your SLAs so that you capture actionable information. Remember that logging creates system load in both log creation and log processing. If you set the threshold too low, almost every operation is logged; this can increase your CloudWatch Log costs.
You now have your slow logs flowing from your source domain to CloudWatch Logs. Next, you need to set up the connection from CloudWatch Logs back to Amazon ES.
3. Set up the CloudWatch log stream to send slow logs to the monitoring Amazon ES domain
In this step, you set up a log stream subscription to send the CloudWatch Logs log streams to a Lambda function, which delivers slow logs to Amazon ES. You also set up custom filters for the index and for search slow logs.
In the Amazon CloudWatch console, choose Logs. In the list of log groups, choose the log group ending in “search-logs” for the Amazon ES domain you used earlier. Then, choose Actions, and choose Stream to Amazon Elasticsearch Service.
On the next screen, choose This Account. In the Amazon ES cluster drop-down list, choose the monitoring domain from the list. This is the destination for your slow logs. Below that, either choose an existing IAM role for the Lambda function to use, or choose Create new IAM Role, and accept the default definitions. The selected IAM role must allow ESHttpPost permission to the target Amazon ES cluster, and logs:CreateLogGroup, CreateLogStream, and PutLogEvents permissions. It must also have a trust relationship with lambda.amazonaws.com.
After filling in your selections, choose Next.
On the next screen, for Log Format, choose Common Log Format.
In the Subscription Filter Pattern, replace the sample pattern with the following:
Choose Test Pattern, and then below the sample log, choose Show test results. If the pattern can be matched, the console displays the first 50 rows of the log with that pattern applied. Check that the fields line up with the columns as expected.
Note that some of the fields contain extraneous information (for example, “took[131micros]”). The messages in Elasticsearch are most easily used without this extraneous content. You remove it in the next step.
Choose Next, review the settings, and then choose Next again. On the next screen, note the name of the Lambda function that you created. It will have a name in the form “LogsToElasticsearch_” followed by the name of your target cluster. Choose Next, and then choose Start Streaming.
Back in the CloudWatch Logs console, you can see that the log group now has an entry under the Subscriptions column, listing the Lambda function to which the logs will be streamed.
Now, repeat the process for the log group ending in “index-logs” for the domain, with the following changes:
-
- Note that when you choose the same Amazon ES cluster as the target for the streamed logs, the Lambda function created previously is automatically reused. Because the two log types have slightly different formats, you have to adjust the Lambda function to recognize and handle both types (as shown in this post).
- For the log format, use the following pattern instead, because the log format is a little different:
Now you have the log streams being sent to the Lambda function, with some basic parsing. But, as noted before, you want to remove the extraneous information associated with some of the fields.
4. Modify the Lambda function generated by CloudWatch to format the slow log messages for better usability
In this step, you modify the Lambda function to further clean up and format the incoming log messages.
Open the AWS Lambda console. Choose the Lambda function created for you by the service. On the Configuration page, scroll down to the function code. Take a moment to review the provided code.
Note that the index name that the log messages are posted to is established in the code, in the transform(payload) function. The provided code sets the index name to cwl-YYYY.MM.DD. This puts all log messages received by this Lambda function into the same Elasticsearch index and creates a new index each day. Creating a new index each day is a best practice for potentially heavily used time-series such as log analytics. It allows dashboards that are focused on recent time periods to read a relatively small amount of the most recent data. It also makes it easier to archive or delete older data that is no longer used. For example, Kibana is optimized to make efficient use of this approach for its dashboards.
However, if you want to store different document types (such as messages from index slow logs and search slow logs) in the same ES cluster, as of Elasticsearch 6.0, you must store them in different indexes. Because you are storing both search and index slow logs in the same cluster, you need to use a different name for each index. The sample code given here changes the name to cwlslowsearch-YYYY.MM.DD for the search logs, and cwlslowindex-YYYY.MM.DD for the index logs.
After you finish reviewing the code, replace the transform(payload) function with the following code. This code strips out the extraneous information described in the prior step, adds some useful fields (the source Elasticsearch domain name extracted from the log group name), and modifies the index names as described.
Now, save the updated Lambda function.
Return to the Amazon ES console for your domain, and choose the Indices tab. After a short wait, if you have indexing and search operations going to your source domain indexes, you should see new indexes with the naming convention cwlslowsearch-YYYY.MM.DD and cwlslowindex-YYYY.MM.DD. You might want to delete any indexes with the cwl-YYYY.MM.DD name that were created just prior to your update to the Lambda function taking effect.
At this point, you now have your source domain creating slow log messages. It’s sending them to CloudWatch Logs, which sends them on to a Lambda function for processing. The Lambda function inserts them into your monitoring ES cluster. In the last steps, you summarize the log information in a dashboard and use it to review your log messages.
If you have multiple source domains that you want to log to the same monitoring domain to achieve a federated view of logging for your Amazon ES environment, set each domain to a separate CloudWatch logging group. The domain information is not part of the slow log message. Therefore, the preceding code parses the log group name to extract the domain, assuming that the default naming convention was used. If the messages from multiple domains are funneled to the same log group, you need to use your system knowledge to map the index name from a log message back to the correct source domain.
If, on the other hand, you use a separate log group for each domain, you need to modify the Lambda function created for each domain’s log groups in the same way described in this section. You might also want to modify the Amazon ES index naming convention shown in the code here. For example, you could use a different naming convention for a subset of critical domains to make the overall collection of logs easier to manage and prioritize.
5. Set up a Kibana dashboard to graph and review the slow log messages
Now, you want to take a look at your results and visualize them on your dashboard. For this step, you use Kibana on your monitoring ES cluster. Kibana comes preinstalled as part of your Amazon ES service.
Use whatever means you usually use to open Kibana on your monitoring domain in your browser (for example, using one of these methods, or using the AWS Management Console link). Now, in Kibana, choose Management in the left navigation bar. Choose Index Patterns.
Choose Configure an Index Pattern (or, Create Index Pattern). For the Index Pattern, type cwlslowindex-*. Then, in the Time Filter drop-down list, choose @timestamp, and then choose Create.
Choose Create Index Pattern, and add another index pattern. This time, type cwlslowsearch-*. Again, in the Time Filter drop-down list, choose @timestamp.
Creating visualizations
Next, you want to create a visualization for each of the indexes.
First, for the slow search index, choose visualize in Kibana’s left navigation panel. Choose the + (plus sign) to create a new visualization, and then choose the line graph. Choose the cwlslowsearch index pattern.
In the Data panel, follow these steps:
- Under Y-Axis:
- For Aggregation, choose Max, because you’re interested in the worst-performing queries.
- For Field, choose took_millis. Give it a custom label of Max_millis.
- Still under Y-Axis, choose Add Metrics. Choose the metrics type of Y-Axis.
- For Aggregation, choose Average, and for Field, choose took_millis.
- Give it a custom label of Avg_millis. This gives you a view of how the maximum query differs from the average. So you can see whether there are many of the poor-performing queries or only a small number of outliers.
- Under X-Axis:
- For Aggregation, choose Date Histogram, and for Field, choose @timestamp.
- For Interval, choose Minute.
- Choose the blue triangle at the top of the panel to apply the settings.
- Check that the graph looks similar to the one on the left in the dashboard screenshot shown in the next section. (If you only have one domain, it shows only one line.)
- At the top of the Kibana page, choose Save, and give the visualization a name, like slowsearchviz. Choose Save
Follow the same procedure to create a visualization for the cwlslowindex index, saving it with a name like slowindexviz.
Creating the slow logs dashboard
Next, in the left navigation bar in Kibana, choose Dashboard. Choose the + (plus sign) to add a new dashboard. Choose Add in the top navigation bar, and choose the two visualizations you just created. Kibana adds them to the dashboard.
Choose Save in the top navigation bar, and give your dashboard a name. Choose Save again to save it. If you have multiple domains funneling data into the same metrics cluster (as I do), you must add a filter (as shown in the screenshot) to narrow the results to the single domain you’re interested in.
On my dashboard, shown following, I added a couple of pie charts and a value (max milliseconds for a search) for interest and convenience.
6. Use the dashboard to diagnose and resolve common problems
A dashboard like this can help you find and fix a variety of problems. Here are three issues that customers frequently see. They can be difficult to diagnose without having this information so easily available.
Problem #1. What’s this occasional slow query?
Now, when you see a particular data point of interest in the dashboard, hover over it to see the value and the time stamp. You can use this information to find the particular query of interest.
Suppose that you’ve identified an outlier—a slow search. Choose Discover in Kibana’s left navigation bar, and choose the cwlslowsearch* index pattern in the inner-left navigation bar. Kibana displays the log entries from the time period selected in the bar at the top-right of the page. You can use the search capabilities of Kibana to narrow down to the specific entry and see the entire log entry, including the query being executed (in the following example, a “match all” query generated by a load-generation script I was running).
Problem #2. Are all queries slow, or just some?
In one situation, a domain was exceeding its reported SLA, based on the SLA calculation of average query response times. Looking at a graph similar to the one shown following (showing the max, average, and median), I saw that the median response was well within the SLA. In addition, the majority of the queries were getting good response—with a small number of outliers, such as the peak shown here. Zooming in on the problem queries established that in every case, the problem query was the same kind of convoluted query. The root cause was an application error when it received invalid input from its user.
Problem #3. Bad index settings
In another situation, a subset of queries were reporting slow response times. Investigating the problem set in the Kibana Discover panel showed that all the slow queries were being executed on the same index and on the same node. Further exploration identified that this heavily used index had been defined (in error) as having one shard and no replicas during a load operation, and was never reset. Adding replicas to the index allowed the query load to be distributed across all the cluster nodes, and quickly brought the query performance back in line with expectations.
Conclusion
Using CloudWatch Logs integration with Amazon Elasticsearch Service makes it easier to ingest your slow logs back into your Elasticsearch environment. You can now view and analyze them with the same tools you already use. By using the power of Kibana to display and explore slow logs, you’ll gain additional control over and insight into your Elasticsearch environment. Enjoy!
- Any code in this blog is licensed under Apache 2.0.
About the Author
 Veronika Megler is a consultant at Amazon Web Services. She works with our customers to provide guidance and technical assistance on database projects, helping them improving the value of their solutions when using AWS.