AWS Big Data Blog
Simplify management of Amazon Redshift clusters with the Redshift console
Amazon Redshift is the most popular and the fastest cloud data warehouse. It includes a console for administrators to create, configure, and manage Amazon Redshift clusters. The new Amazon Redshift console modernizes the user interface and adds several features to improve managing your clusters and workloads running on clusters.
The new Amazon Redshift console provides the following benefits:
- Visibility to the health and performance of clusters from a unified dashboard.
- Simplified management of clusters by streamlining several screens and flows, and reducing the number of clicks for several everyday operations.
- Improved mean-time-to-diagnose query performance issues by adding capabilities to monitor user queries and correlate with cluster performance metrics.
This post discusses how you can use the new console to create your first cluster, and manage and monitor your clusters in your AWS account.
Prerequisites
For the best experience in using the new Amazon Redshift console, make sure you meet the following prerequisites.
If you are using the AmazonRedshiftFullAccess, you don’t need to make any changes to your permissions. The AmazonRedshiftFullAccess grants full access to all Amazon Redshift resources for the AWS account.
If you are using custom policies, either attach AmazonRedshiftFullAccess or add the following code to your IAM user’s policy:
You also have to upgrade your clusters to the latest maintenance patch.
New console launch page
When you log in to the new console and you don’t have a cluster, you see the launch page. You can navigate to your dashboard, clusters, queries, Query Editor, configuration changes, and advisor using the left navigation menu.
You are redirected to the Dashboard page if you have at least one cluster.
The following screenshot shows your Amazon Redshift console and navigation menu.

To expand the menu, choose the expand icon at the top of the menu. See the following screenshot.

Setting up a new Amazon Redshift data warehouse
To use Amazon Redshift, you have to first create a new Amazon Redshift cluster. You can launch a cluster by providing a few parameters such as node type, number of nodes, and the master user password. The rest of the parameters can be default values. You can also get an estimated cost for your cluster, and calculate the best configuration based on the size of your data.

Now that you created an Amazon Redshift cluster, you’re ready to create some tables and load data using the Query Editor.
Query Editor
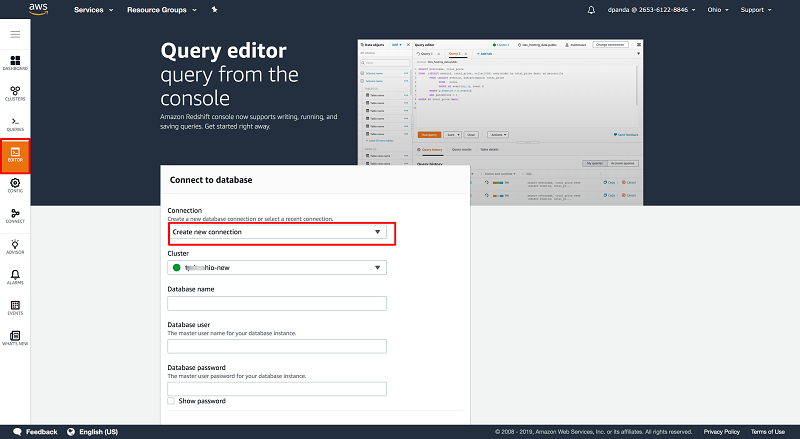
The Query Editor allows you to author and execute queries in your cluster. To connect to your cluster, from Editor, choose Connect to database.
You have to provide your cluster URL and database credentials to connect to your database. See the following screenshot.
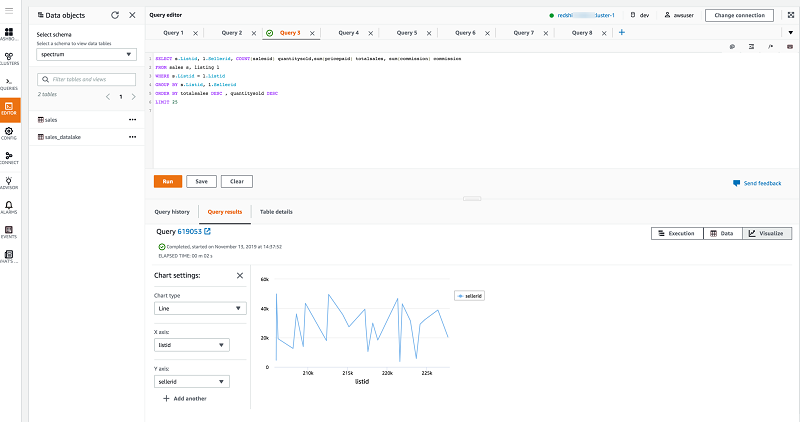
You can run SQL commands to create tables, load data, run queries, and perform visual analysis in the Query Editor.
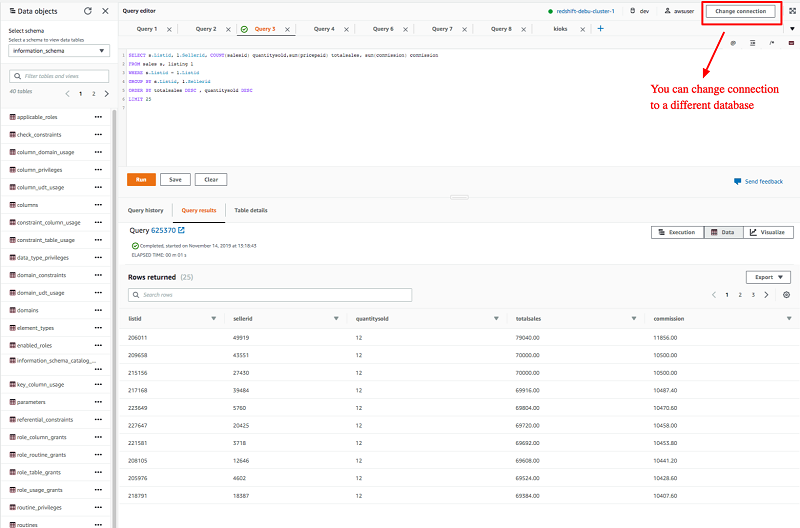
You can switch to a new database connection by clicking on the “Change connection” button as highlighted below.
Monitoring dashboard
More than 15,000 customers use Amazon Redshift to power their analytical workloads to enable modern analytics use cases such as Business Intelligence, predictive analytics, and real-time streaming analytics. As an Amazon Redshift administrator or developer, you want your users, such as data analysts or BI professionals, to get optimal performance for their workloads. Being proactive, you might set up Amazon CloudWatch alarms on different Amazon Redshift metrics.
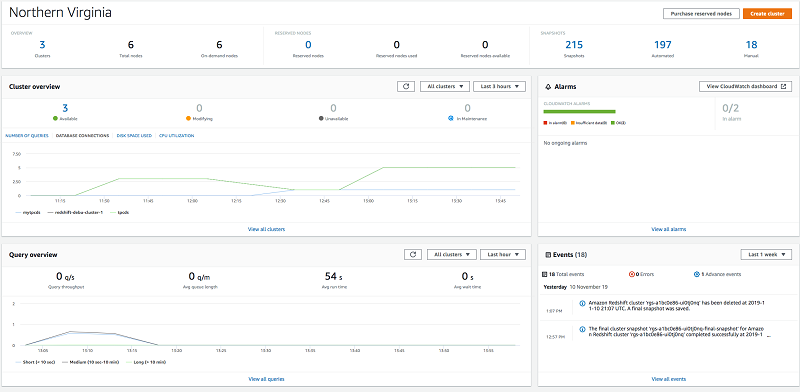
With the existing console, you can navigate to different pages to get a glance of the health and performance of Amazon Redshift clusters. The new dashboard provides unified visibility to the health and performance of your clusters.
The dashboard enables Amazon Redshift administrators and operators to gain visibility into the following:
- The number of clusters, number of nodes, availability, and cluster health status.
- CloudWatch alarms for your clusters.
- Critical performance metrics for the top five clusters, such as the number of queries, database connections, and CPU utilization.
- Performance workloads such as query throughput, average query length, average run time, and average wait time for your clusters.
- Consolidated view of all events for your clusters.
You can filter data in each widget by a specific filter or modify the range to perform a trend analysis for a metric.
The dashboard also allows you to isolate issues in your clusters to focus on the problem. For example, if you have CloudWatch alarm for an Amazon Redshift metric such as DB Connections, as the preceding screenshot shows, you can drill down to view the alarm details or drill down to the cluster to get details such as queries and loads running, and cluster and database metrics.
Cluster management
The Clusters page allows you to view node details and key performance metrics for the clusters, tags, and notifications. You can customize this page to include your preferred metric and areas of focus. In this post, the page includes a maintenance track and release status. Through the Actions menu, you can perform frequent operations such as modify, resize, manage tags, reboot, create a snapshot or configure a cross-region snapshot, or delete your cluster.
The following screenshot shows the Clusters page and options on the Actions menu.

Cluster details
If you are diagnosing a performance problem, you can drill down to view cluster details. The cluster details page shows the details for a specific cluster, organized in the following categories:
- Query monitoring
- Cluster performance
- Maintenance
- Backup
- Properties
The Actions menu allows you to perform everyday operations such as resize, reboot, or change configuration. You can also modify the password for your master user for the database, create a snapshot, or restore a table in your database.
The following screenshot shows the details page for a cluster and the available menus and options.
Query and Load monitoring
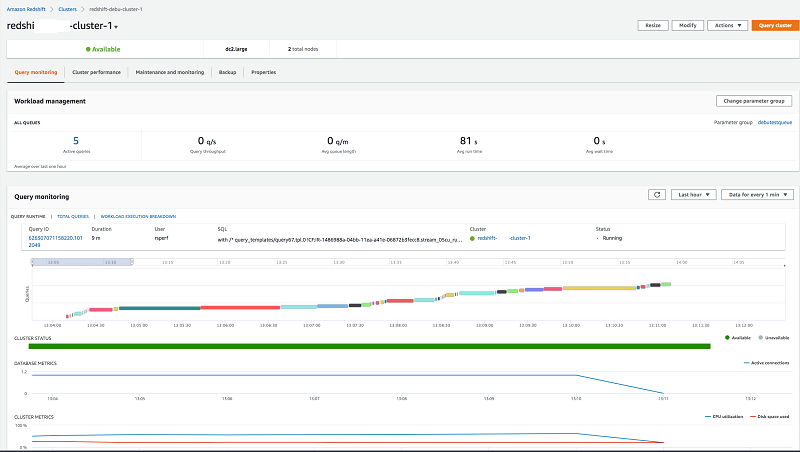
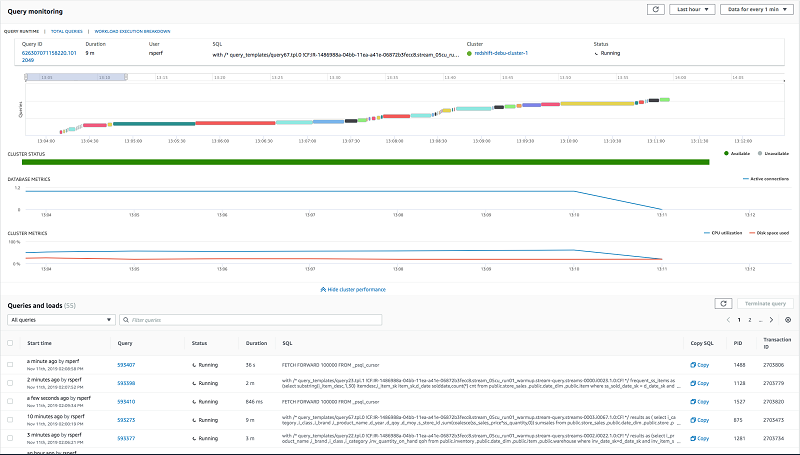
You can monitor the current workload for your WLM queues and view critical metrics such as active queries and query throughput.
The following screenshot shows the Query monitoring section and the time-series view of the breakdown of the workload.
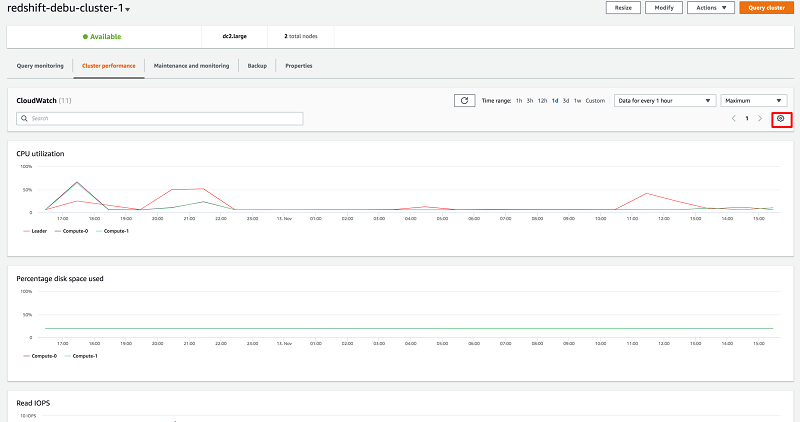
Cluster and database monitoring
You can view cluster and database performance metrics for your cluster, such as CPU utilization, percentage of disk space used, and database connections using the Cluster performance tab. You can also change the time period and period and granularity of data.
The following screenshot shows the Cluster performance section.
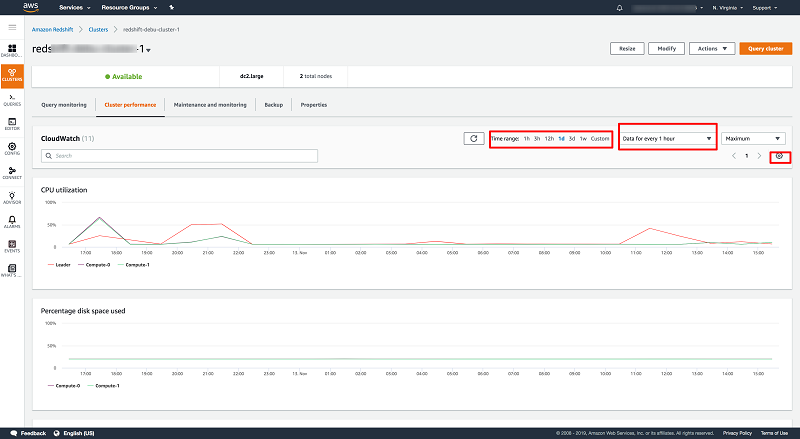
You can change your default metric view to the metrics of your choice by using the config button. You can either add 6, 9, or 20 metrics to this page. It is recommended that you keep these six metrics for optimal page performance.
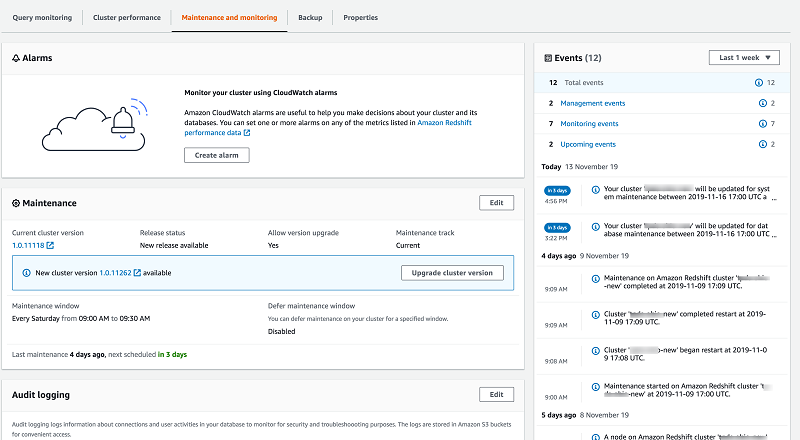
Cluster maintenance
The Maintenance and monitoring tab allows you to view your CloudWatch alarms, events, and maintenance level. You can also enable auditing, create CloudWatch alarms, and create maintenance windows for your cluster.
The following screenshot shows the Maintenance and monitoring section.
Backup and restore
Amazon Redshift automatically takes incremental snapshots (backups) of your data every eight hours or 5 GB per node of data change. Alternatively, you can create a snapshot schedule to control when to create snapshots. You can create a new cluster by restoring from an existing snapshot.
You can view, search your snapshots, enable automatic snapshots, take a manual snapshot, and configure cross-region snapshots from this page.
You can also create a new cluster from an existing snapshot. With this release, Amazon Redshift allows you to restore snapshots to create a cluster with different node types than the original version. You can either migrate your Amazon Redshift data warehouse to a more powerful node type or clone to a smaller node type for development and testing.
You can view snapshots for your clusters by navigating the snapshots submenu from the cluster menu. You can search, view, and delete snapshots generated by existing and deleted clusters. You can restore a cluster from a snapshot, including a snapshot generated from a deleted cluster.
The following screenshot shows the Backup section and available actions in the Snapshots section.

Properties
Amazon Redshift clusters provide several customization options. The properties tab allows you to view and edit standard configurations such as IAM roles, cluster configuration details, database configurations, and network configurations. You can also manage tags for your cluster.
You need the JDBC and ODBC URLs for connecting to a cluster for using with different ETL, Business Intelligence, and developer tools. This post also provides you connection details such as JDBC and ODBC URLs and IP addresses for the nodes in the cluster.
The following screenshot shows the Properties section.

Conclusion
This post showed you the new features in the Amazon Redshift management console, such as monitoring your dashboard and updated flows to create, manage, and monitor Amazon Redshift clusters. The Clusters page logically organizes information for better navigation and simplify everyday operations. Switch today to the new Redshift Console and simplify management of your Amazon Redshift clusters.
In a later post, you can learn how the Amazon Redshift console improves query monitoring and helps you diagnose query performance.
About the Authors
 Debu Panda, a senior product manager at AWS, is an industry leader in analytics, application platform, and database technologies. He has more than 20 years of experience in the IT industry and has published numerous articles on analytics, enterprise Java, and databases and has presented at multiple conferences. He is lead author of the EJB 3 in Action (Manning Publications 2007, 2014) and Middleware Management (Packt).

Raja Bhogi is an engineering manager at AWS. He is responsible for building delightful and easy-to-use web experiences for analytics and blockchain products. His work includes launching web experiences for new analytics products, and working on new feature launches for existing products. He is passionate about web technologies, performance insights, and tuning. He is a thrill seeker and enjoys everything from roller coasters to bungy jumping.