AWS Compute Blog
Operating Lambda: Isolating and resolving issues
In the Operating Lambda series, I cover important topics for developers, architects, and systems administrators who are managing AWS Lambda-based applications. This three-part series discusses application design for Lambda-based applications.
Part 1 explains how to use CloudWatch Logs Insights in your serverless applications. Part 2 discusses how monitoring concepts apply to Lambda-based applications and how to use Amazon CloudWatch Metrics. This post walks through troubleshooting application issues in an example walkthrough and monitoring Lambda code storage usage.
A general approach to debugging Lambda performance issues and errors
Between Amazon CloudWatch Logs, CloudWatch Logs Insights, and AWS X-Ray, you can monitor the performance of Lambda-based applications and also drill into specific errors. It’s recommended that you instrument production applications with these services, or use alternative third-party services, to gain insights quickly for troubleshooting production problems.
Generally, once a problem is reported:
- Reproduce the issue, if possible, or identify the reported errors from logs. Try to identify specific environmental or configuration settings that indicate if the error may be the cause of a downstream outage or specific set of circumstances.
- Use X-Ray to find all the services involved in a request. For larger serverless applications, this is the fastest way to locate all of the interactions involved in the request. From X-Ray, isolate the service where latency or errors are occurring then drill down further.
- If a Lambda function is the source of the problem, ensure that the function is not memory-bound or CPU-bound, and that there is available unreserved capacity to scale up as needed. Performing load tests after making changes can help identify if the issue is resolved and can help simulate typical performance using real-world traffic levels.
- Use CloudWatch metrics to identify any throttling in the services during the lifetime of the request. You can also set alarms whenever throttling metrics increase above zero, since any level of throttling is likely to result in errors or slow performance in your application.
- Update your application once the problem is identified. This includes updating error handling and tests in custom code and requesting increases in Service Quotas, if needed. After these changes, attempt to recreate the problem with load testing to ensure that the new quotas and custom code have either resolved the issue or help provide more metrics and instrumentation if the problem occurs again.
This walkthrough uses the Coffee Lookup example in the GitHub repository. In this scenario, users have provided feedback that the front-end application is slow and frequently showing errors. This section walks through the process of reproducing and diagnosing the cause of the problem.
Reproducing the issue
The first step is to reproduce the problem. Invoking the API using curl or Postman shows that the API is operating but does not highlight any errors. But by running a load test against the backend API with Artillery, simulating the level of load in production, I can reproduce both issues.
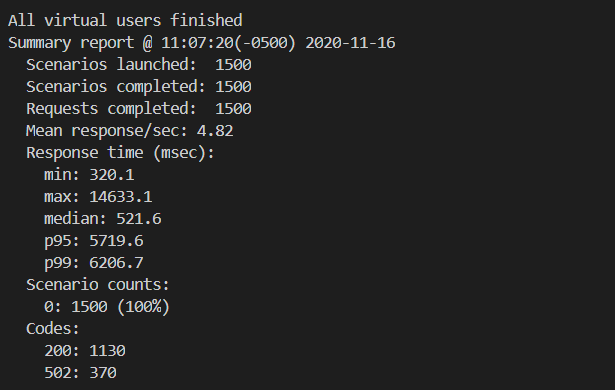
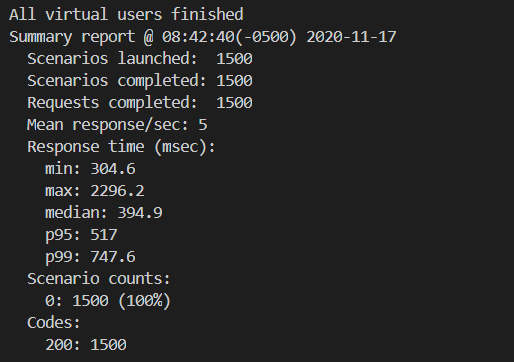
In a load test with 1500 requests over 5 minutes, 25% of the requests are failing with 502 errors and the overall performance is highly variable. While the median response time is 522 ms, which is worse than expected, the p95 response times are over 5.7 seconds. The Artillery report breaks down these findings further:
To learn more about load testing serverless APIs, see “Load testing a web application’s serverless backend”.
Isolating the cause of errors
While the Artillery load test reports round-trip timings for API calls, it’s important to know the portion of latency caused by the backend application. I use X-Ray to investigate latency between the various AWS services used in the application. This helps to exclude networking delays or issues that are local to the client device. After a load test, I can check X-Ray or ServiceLens to verify the roundtrip performance once the requests are received by the API.

The service map shows service latency and failures in about 25% of the requests. X-Ray allows you to drill into requests by status code to further identify the causes of 502 errors. In this case, the error traces show that Amazon DynamoDB performance is normal but the Lambda function is raising an error after 5 seconds:
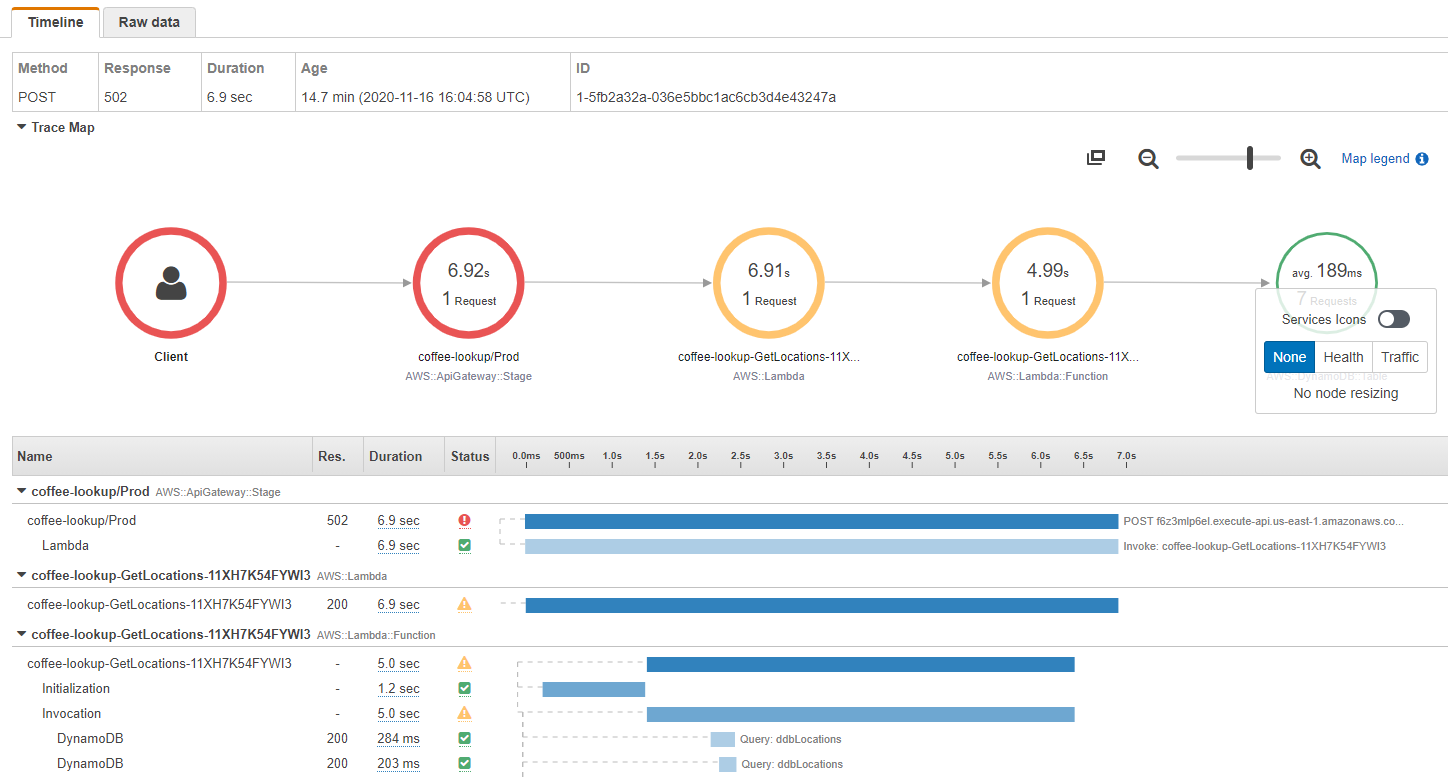
Investigating further in the CloudWatch Logs for the failing function, the error messages indicate that the function has timed out. The function is configured with a maximum duration of 5 seconds. While I can increase this timeout value to eliminate the error, the underlying cause of the error is still unknown. When I increase the timeout or the memory allocated to the Lambda function and run the load test again, this results in a higher percentage of 502 errors.
When Lambda functions generate more errors as resources are increased, this can often indicate a downstream issue. For this application, the next downstream service is DynamoDB. Looking at the metrics for resource consumption on the DynamoDB table, this indicates the source of the problem:
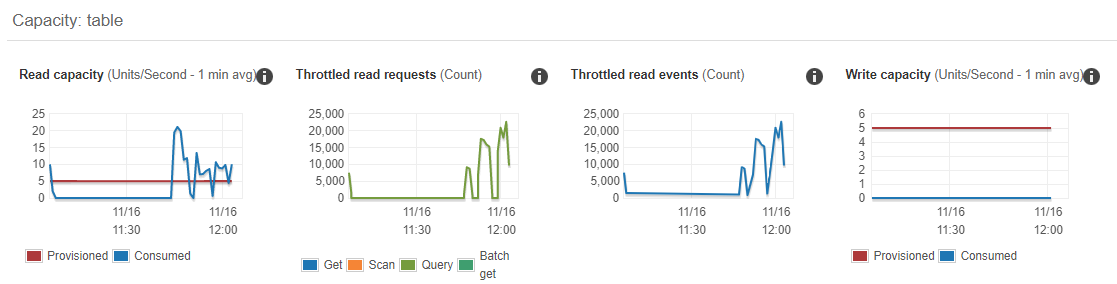
The read capacity of the table is set to 5 RCUs in the AWS Serverless Application Model (AWS SAM) template for the application. The load test is driving RCU usage to above 20 and the DynamoDB table is throttling read requests. This is not handled by the custom code in the Lambda function, resulting in a time-out error. By setting the DynamoDB table’s RCU value to 25 and re-running the test, I can compare the results in X-Ray:
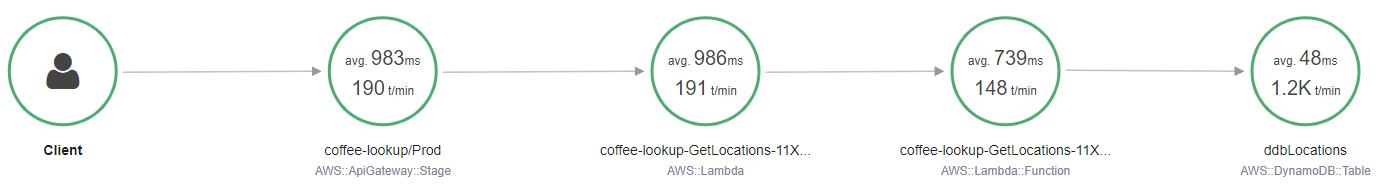
All of the requests are now returning without errors but the performance of the Lambda function is still below expectations.
Isolating the performance issue

In testing the function from an AWS Cloud9 instance and a local development machine, the average performance is faster, averaging 250 ms. The comparatively slow performance when running in Lambda is likely caused by the configuration instead of the code.
First, I check if the Lambda function is running out of memory, since this is a major cause of slow-running functions. Using CloudWatch Insights, I can analyze the amount of memory used by the function during the load test. I use the Percentile report of Lambda memory usage query from the previous section.
The results indicate that the function is using a maximum of 154.5 MB and 5% of all invocations use above 151.6 MB. The function is allocated 256 MB so it is not close to the memory maximum. However, memory settings in Lambda also determine the amount of virtual CPU available, so act as a power control. The function is computationally heavy so may benefit from more memory since this provides more computational power.
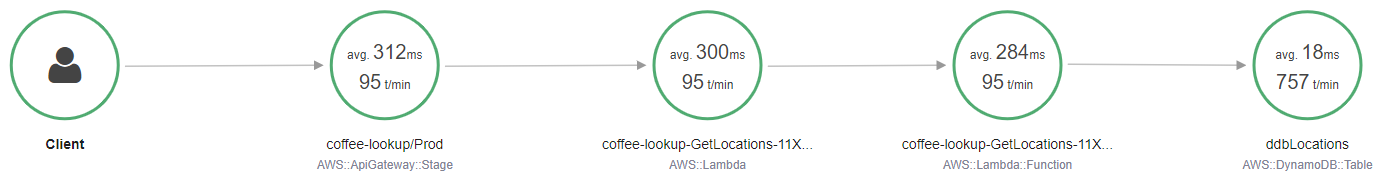
I increase the function’s memory to 1024 MB and re-run the load test. The load test results show an improvement, with a median response time of 395 ms.
The X-Ray service map now also shows faster performance, reducing the average Lambda invocation duration from 739 ms to 284 ms, an improvement of more than 61%.
I can rerun the same test with different Lambda memory settings to determine which configuration provides the fastest performance. While I can do this manually, I can also automate this process to find the ideal balance between duration and cost by using the AWS Lambda Power Tuning tool.
Measuring and improving the performance of outliers
In the latest test, although the average performance is considerably better, the p95 duration is 517 ms and the p99 duration is 747 ms. This means that 5% of all invocations are taking longer than 517 ms and 1% exceed 747 ms. The X-Ray service map shows a response distribution graph for the Lambda function:

Often, the greatest impact contributor to latency in these performance outliers is the effect of cold starts. By running the Percentage of cold starts in total invocations query in CloudWatch Insights, I can find how many cold starts occurred during the load test, and their average duration.
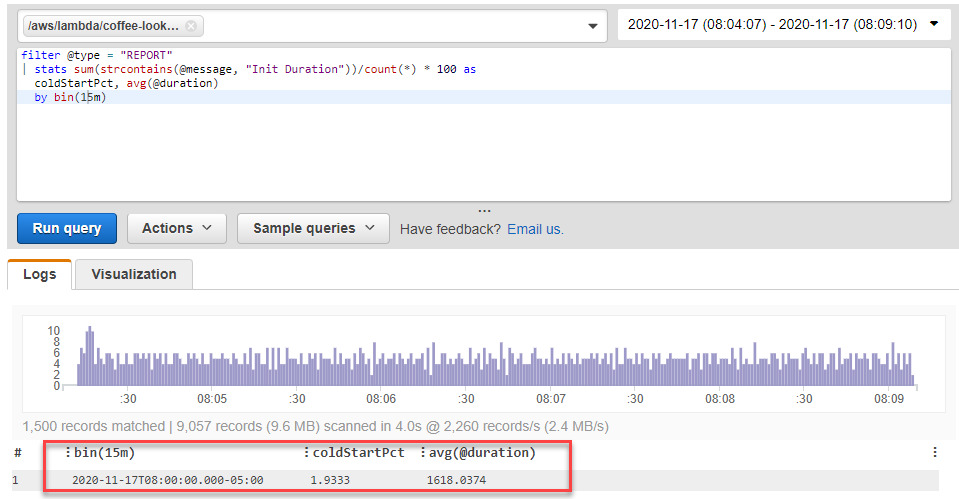
In this case, almost 2% of invocations were cold starts with an average total duration of 1618 ms, which explains the outlier performance. There are many additional optimizations that can be made to the Lambda function to improve the cold start latency, and shown in this AWS Tech Talk broadcast.
Monitoring Lambda code storage
The Lambda service stores your function code in an internal S3 bucket that’s private to your account. Each AWS account is allocated 75 GB of storage in each Region. This is an adjustable quota that can be raised by requesting a quota increase. Code storage includes the total storage used by both Lambda functions and layers. If you reach the quota, you receive a CodeStorageExceededException when you attempt to deploy new functions.
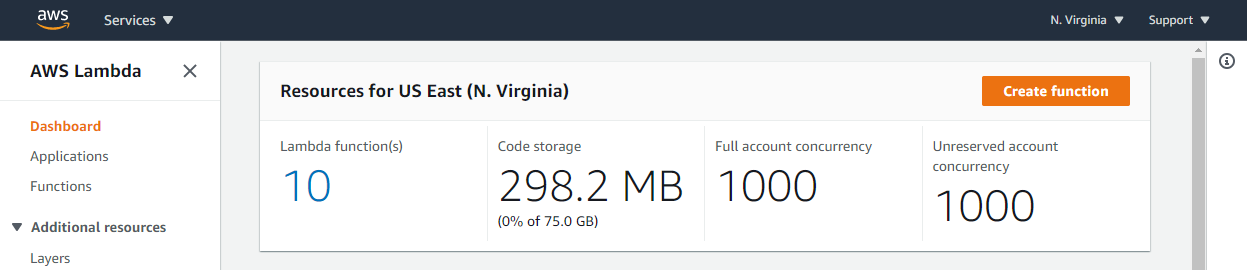
The Lambda console shows the total storage used in the Dashboard submenu:
You can see the storage used by individual functions both in the Functions submenu and by using the Lambda CLI command list-versions-by-function:

This returns each published version of the function together with the $LATEST version. The CodeSize attribute shows the total number of bytes used by code storage of this function.
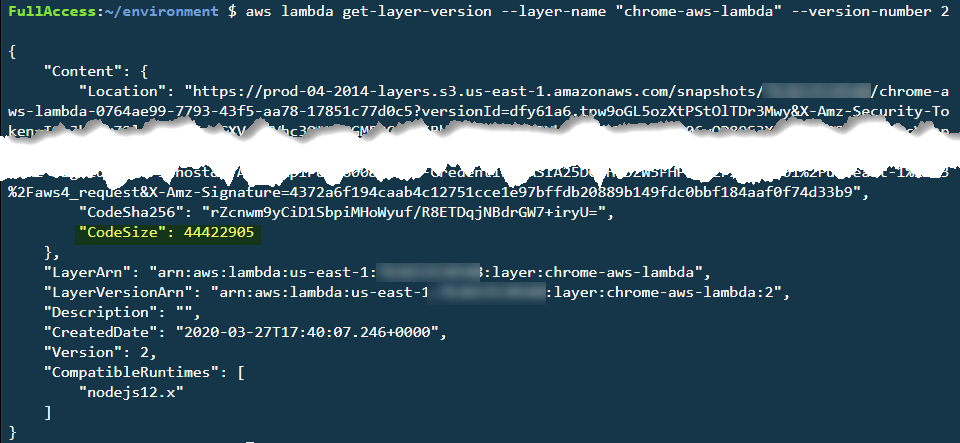
Similarly, for Lambda layers, you can see the code storage used by each layer version by using the CLI command get-layer-version:
Best practices for managing code storage
While you can request storage increases, it’s good practice to manage your code storage effectively. There are a number of strategies you can use to keep code storage to a minimum.
The storage quota is per AWS account, per Region. If you use separate AWS accounts for your production and development environments, functions in development do not impact storage quotas in the production account. It’s good practice to use separate AWS accounts for separate workloads in production systems, especially if you have different groups of developers in your organization working on different projects. This prevents code storage used by another development team in a separate project from impacting the code storage of your team’s projects.
You can also use Lambda layers to reduce code storage. A layer is a zip archive that contains libraries and other dependencies. You can include a layer in your function deployment as a way to keep deployment packages small. For example, three versions of a Lambda function, consisting of libraries and business logic in the deployment package, use three times the storage space:

When the common 10 MB libraries are stored in a Lambda layer and referenced by the Lambda function, the total storage drops by 20 MB. The single layer storage counts towards the quota but the usage in each function does not:

This example shows a single function with multiple published versions but the benefits are compounded when you share libraries across multiple functions in a workload. The functions have the same access to the libraries and assets as when bundled in the deployment package but the storage consumed is considerably reduced.
Remove outdated versions of published Lambda functions that are no longer used. Published Lambda versions are immutable deployment packages that count towards your code storage quota. These versions can be useful if you are using canary deployments or other mechanisms for serving different versions of code to different users. However, in many applications these may not be needed so you can delete these versions and claim back the storage quota.
The AWS SAM CLI does not publish separate versions when you deploy templates, unless you use the AutoPublishAlias property. This means that multiple deployments only incrementally increase (or decrease) the total storage used, depending on the difference in size with the most recently deployed version. Conversely, Serverless Framework creates new function versions for every deployment by default. To disable this, set the versionFunctions option to false in the application template. For more information, see the configuration documentation.
You can automatically remove earlier versions using the SAR-Lambda-Janitor application. This creates a scheduled task in your AWS account that automatically deletes earlier versions of Lambda functions. You can configure this application to retain a specified number of previous versions, if needed.
Conclusion
This blog post outlines a general approach to debugging Lambda performance issues and errors. This provides a repeatable process for isolating and resolving problems in your serverless workloads.
Using the walkthrough of the Coffee Lookup application, I show how to reproduce a production bug, isolate the cause of errors, and then isolate the performance issue. Finally, I explain how to monitor Lambda code storage to avoid exceeding storage quotas.
For more serverless learning resources, visit Serverless Land.