AWS Database Blog
Monitor Amazon Aurora MySQL, Amazon RDS for MySQL and MariaDB logs with Amazon CloudWatch
NEW! Amazon Aurora with MySQL compatibility now supports publishing of all logs to CloudWatch Logs using the process described below.
Amazon RDS has long offered customers the ability to view and download logs associated with their DB instances for troubleshooting purposes. Now, with Amazon Relational Database Service (Amazon RDS) for MySQL and Amazon RDS for MariaDB you can publish your DB instance log events directly to Amazon CloudWatch Logs. By publishing your logs, you can build richer and more seamless interactions with your DB instance logs using AWS services.
Near-real time insights into DB instance logs
With Amazon CloudWatch Logs, you can centrally and durably store logs from the various components of your applications. You can also monitor your logs, in near-real time, for specific phrases, values, or patterns (metrics). In addition, you can set alarms that alert you when monitored conditions occur. Amazon CloudWatch also integrates with a variety of other AWS services. This integration means you can expand the value of published logs over a wide variety of use cases, such as the following:
- Setting alarms on abnormal conditions, such as unusually high volumes of slow queries or failed connection attempts
- Correlating logs with other application logs
- Retaining logs for specific security and compliance purposes
- Analyzing trends in log data over time
The following illustration shows an overview of the architecture.
Log export concepts
The new log export feature supports the following log types for MySQL and MariaDB:
- Error log – contains diagnostic messages generated by the database engine, along with startup and shutdown times.
- General query log – contains a record of all SQL statements received from clients, and also client connect and disconnect times.
- Slow query log – contains a record of SQL statements that took longer to execute than a set amount of time and that examined more than a defined number of rows. Both thresholds are configurable.
- Audit log – provided by using the MariaDB Audit Plugin, this log records database activity on the server for audit purposes. Refer to the Aurora MySQL documentation for more information on advanced auditing in Aurora.
Log events from these sources are published in the form of log streams (sequences of log events) to log groups in Amazon CloudWatch. Each DB instance and log type creates a separate group in the same AWS Region as the DB instance, with the following naming pattern:
Your log data is durably stored in CloudWatch Logs and encrypted at rest. However, your logs might contain sensitive information—configuration and data—for which access should be restricted to appropriate users in your account. Therefore, it is important to configure appropriate IAM access policies for the log groups containing database logs.
Amazon RDS publishes logs from your DB instances to log groups in the same account as the DB instances using a service-linked role, which permits Amazon RDS to access to the relevant log groups in your account. After enabling log publication, you might see an additional IAM role named AWSServiceRoleForRDS in your account.
To enable log publication to CloudWatch Logs, you can take the following approach.
Prerequisites for log publication
Depending on the log types that you want to track and publish, you might need to take a few prerequisite steps:
- The error log is enabled by default, and you don’t need to perform any additional actions to work with it.
- The audit log can be enabled by adding and configuring the MariaDB Audit Plugin for both MySQL and MariaDB instances. Our documentation explains how to create a custom option group with these settings. For Aurora MySQL, refer our documentation on using advanced auditing.
- The general and slow query logs are both enabled by specific database engine parameters. If you don’t already use a custom DB cluster parameter group for Aurora MySQL or DB parameter group for RDS for MySQL and MariaDB to tune the configuration of your DB instance, you might have to customize the following parameters:
- Set
slow_query_log = 1to enable the slow query log. Additional parameters are available to help you tune which statements get reported in the log. For further details, review the MySQL or MariaDB - Set
general_log = 1to enable the general log. As preceding, check the MySQL or MariaDB documentation for additional tuning parameters. - Set
log_output = FILEto write logs to the file system and publish them to CloudWatch Logs.
- Set
Note: Exercise caution when enabling the audit log and general log on production DB instances. Because these logs can capture and record every statement executed, their use can cause performance degradation on your DB instances.
Creating a DB instance with log exports
In the steps following, we illustrate how you enable this feature on a new DB instance. You can also enable log exports on existing DB instances, by modifying an existing DB instance.
Note: The steps following use the new RDS Management Console experience. If you are still using the old console interface for RDS, the log export options aren’t available.
- Sign in to the AWS Management Console and open the Amazon RDS console at https://console.aws.amazon.com/rds/.
- In the top right corner of the Amazon RDS console, choose the AWS Region in which you want to create the DB instance.
- Choose Launch a DB Instance on the console dashboard, as shown following.

- Choose either the MySQL or MariaDB engine, as shown following, and then choose Next.

- Choose either Production – MySQL/MariaDB or Dev/Test – MySQL/ MariaDB at the use case prompt, as shown following, and then choose Next.

- Set the instance specifications, including size, high availability, storage properties, identifier, master user name, and password, and then choose Next. You can find more details about these settings in our documentation.
- On the advanced settings screen, configure the networking and security, encryption, backup, monitoring, and maintenance settings as desired. More details about each option are available in our documentation.
- In the Database options section, depending on the logs you plan to enable (see the prerequisites preceding), choose the relevant DB parameter group and Option group, as shown following. These might be the defaults provided, or custom ones.

- In the Log exports section, shown following, choose the logs that you want to export and have enabled using the configurations discussed preceding.

- Choose Launch DB Instance.
Working with database logs in CloudWatch Logs
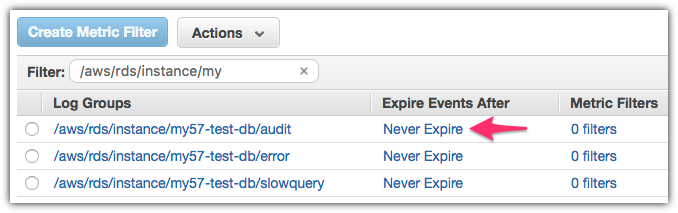
When you have enabled log publication, subject to the activity on your database server, you see the relevant log groups present in the CloudWatch Logs console. By default, Amazon RDS configures your log groups to never expire. By choosing that expiration value in the console, shown following, you can change the retention policy for your log events. Amazon CloudWatch Logs charges for the amount of log storage that you consume, so we recommend that you retain logs for only as long as the data within is valuable.
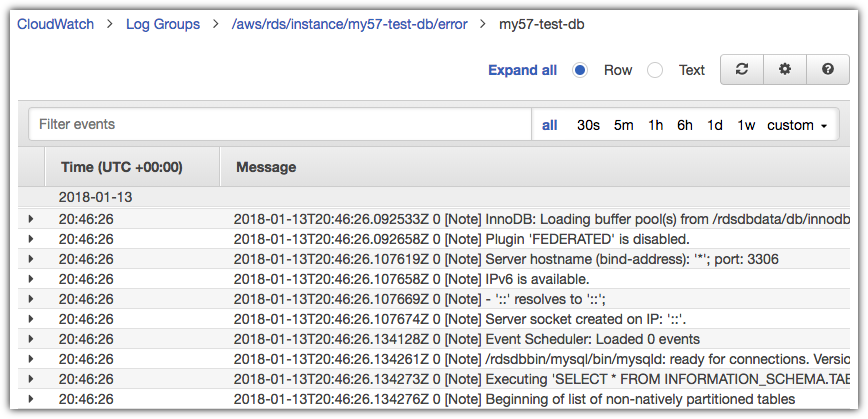
By choosing the log group, you can drill down and browse the log events in the log streams. For example, browsing the error log events you might see information similar to that shown following.
You can create filters on the specific patterns found in your log events, and publish CloudWatch metrics based on those. You can use those custom metrics in turn to create alarms, notifying you when abnormal conditions occur.
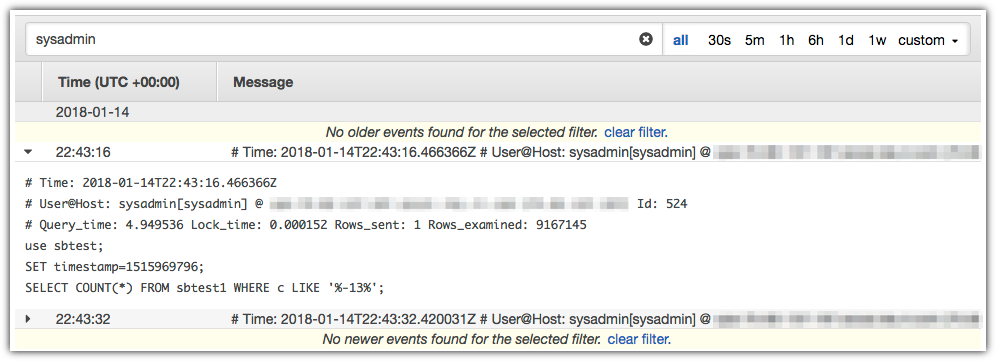
For example, you can monitor the volume of slow queries occurring on your DB instance. Slow queries can be a result of workload requirements. However, unexpected changes in the volume of such queries can indicate performance problems. Slow queries are captured in the slow query log. The related events appear as in the sample following in the slow query log group.
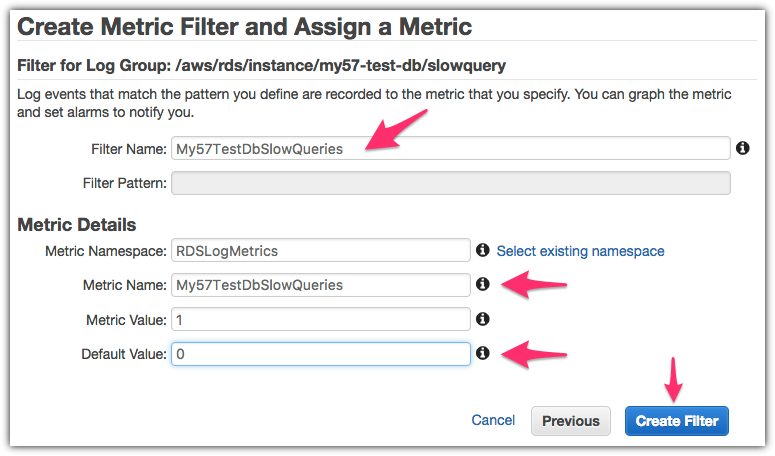
You can create a metric filter by choosing the relevant log group, with a name ending in /slowquery, and then choosing Create Metric Filter (see the illustration preceding). Leave the Filter Pattern field blank to select all log events, as shown following, then choose Assign Metric.

Next, configure the CloudWatch custom metric by specifying a filter name and name space and giving the metric a recognizable name, as shown following. We also recommend setting a default value of 0 (zero), to use as a baseline for reporting intervals that don’t contain any slow queries. You might need to choose Show advanced settings to see this option. Choose Create Filter.
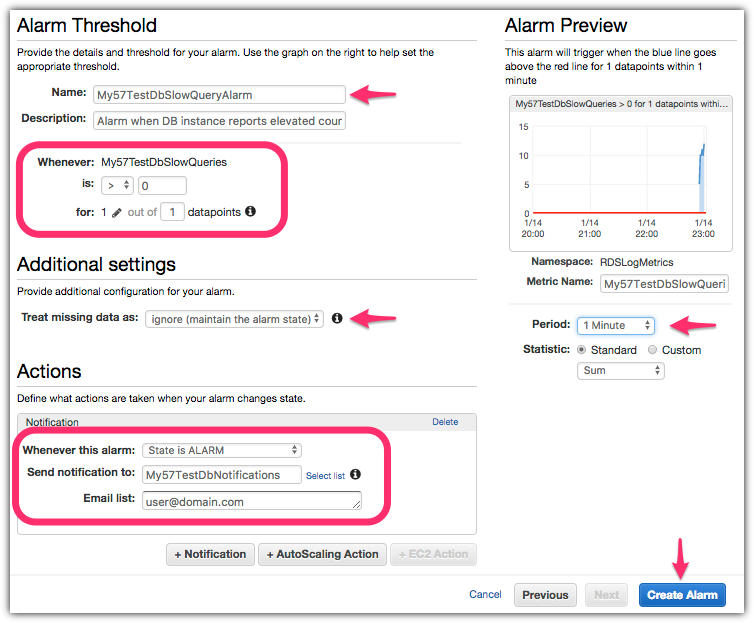
Finally, you can configure an alarm to notify you when your DB instance reports slow queries that take longer than the expected level for normal load. To do so, choose Create Alarm.

To set up the alarm, configure the alarm conditions and notification targets, as shown in the screenshot following. Give your alarm a recognizable name and configure the alarm condition. If you want to be notified any time that there are any slow queries, set the condition to: is > (greater than) 0 (zero). Use a larger threshold if you normally have slow queries that are acceptable in your use case. Also set the desired monitoring period (the default is five minutes) and the notification target, for example the email address of a database administrator. Choose Create Alarm.
Amazon Aurora MySQL-compatible Support
While Aurora MySQL-compatible already had support for publishing Audit logs to CloudWatch Logs using the Advanced Auditing feature, we have now added support for the error, slow query and general logs as well. Aurora clusters now support enabling log publishing for all log types (including the audit logs) using the process described above.
Next steps
You can use the process described preceding to configure other metrics and alarms, for example:
- Monitor the volume of failed connections to the database (a common request for security compliance purposes). Use the audit log and configure a metric filter with a filter pattern of “
FAILED_CONNECT“. You can also detect failed connections from the error log using the filter pattern of “[Note] Access denied for user“. - Monitor for
mysqldprocess starts and restarts. Use the error log and configure a metric filter with a filter pattern that looks for a relevant string, such as: “starting as process“.
You can also export database logs to Amazon S3. When your logs are in Amazon S3, you can configure lifecycle policies to archive the logs and set a retention policy in accordance with your organizational needs. When your logs are in Amazon S3, you can also query logs using Amazon Athena for long-term trend analysis. For details, read the blog post Audit Amazon Aurora Database Logs for Connections, Query Patterns, and More, using Amazon Athena and Amazon QuickSight. Although that post discusses audit logs for Amazon Aurora, the audit process is similar for Amazon RDS MySQL and MariaDB logs.
Amazon CloudWatch Logs also supports real-time processing with subscriptions for Amazon OpenSearch Service and AWS Lambda. With the former, you can analyze database logs in the popular visualization tool Kibana. With the latter, you can trigger functions and automations when matching database log events are published to CloudWatch Logs.
Exporting Amazon Aurora MySQL, Amazon RDS for MySQL and MariaDB logs to CloudWatch Logs provides a powerful mechanism to derive additional value from your database logs.
About the Authors
 Vlad Vlasceanu is a specialist solutions architect at Amazon Web Services. He works with our customers to provide guidance and technical assistance on database projects, helping them improving the value of their solutions when using AWS.