AWS Database Blog
Testing Amazon RDS for Oracle: Plotting Latency and IOPS for OLTP I/O Pattern
Kevin Closson is a principal specialist solutions architect at Amazon Web Services.
At Amazon Web Services (AWS), we take the Amazon Leadership Principles to heart. One such principle is that leaders Earn Trust. Although this principle guides how leaders should act, I like to extend the idea into how we can help customers enjoy more trust and assurance in their deployment choices as they move to cloud computing with Oracle Database in the AWS Cloud.
Amazon Relational Database Service (Amazon RDS) is a managed database service that currently offers a choice of six database engines. Amazon RDS for Oracle is an Oracle Database managed service. It lets Oracle practitioners relinquish many of the administrative tasks related to the “care and feeding” of an Oracle Database deployment, to free up more time to focus on adding value in the application space. At AWS, we refer to this “care and feeding” as undifferentiated heavy lifting.
All Oracle DBAs know how much heavy lifting is involved in the day-to-day administration of their Oracle Database deployments. Moreover, they know the heavy lifting that’s involved with maintenance tasks such as patching, backup and restore, and storage management. Time spent on these DBA tasks takes away from time they can spend focusing on applications. And, after all, it’s applications that help differentiate an enterprise from the competition.
Amazon RDS for Oracle offers a large variety of deployment options, ranging from the underlying EC2 instance and storage types to availability and security options. This post focuses on storage, so we will introduce a method for testing the underlying storage of an Amazon RDS for Oracle instance.
Which I/O testing tool is best?
The underlying storage for RDS instances is Amazon Elastic Block Store (Amazon EBS). The User Guide for Amazon EBS offers a helpful section on benchmarking Amazon EBS volumes. The tools that are mentioned in the EBS User Guide are a) fio, and b) Orion. Both of these tools are useful for testing. However, neither are functional for testing I/O on RDS instances because they both require direct file system access. So, what is the best option for testing physical I/O with Amazon RDS for Oracle? Although it depends on what sort of testing you want to conduct, something as simple as the DBMS_RESOURCE_MANAGER.CALIBRATE_IO package might suffice. However, there are considerations where CALIBRATE_IO is concerned.
The CALIBRATE_IO package of Oracle Database is a necessary package for DBAs. The data gathered and stored internally by the CALIBRATE_IO procedure affects such features as Automatic Degree of Parallelism (Auto DOP) when you are using the Parallel Query Option. That said, CALIBRATE_IO is often referred to as an I/O “bounds test.” When CALIBRATE_IO is probing for maximum random single-block read throughput and latency, it does so at full throttle. That is, CALIBRATE_IO can’t help you detect how predictable I/O latencies are as the I/O demand ramps up. Consider, for example, Figure 1. Figure 1 shows example output from an execution of the CALIBRATE_IO procedure while attached to an Amazon RDS for Oracle instance. This instance is deployed in a db.m4.10xlarge instance-type that’s backed with 6,144 GB Provisioned IOPS (input/output operations per second) volume with 30,000 IOPS provisioned.

Figure 1: Example CALIBRATE_IO output
As Figure 1 shows, CALIBRATE_IO was able to drive single block read IOPS (8 KB) to within 97.6 percent of the 30,000 provisioned. Further, CALIBRATE_IO showed that the average latency was 1 millisecond. However, that begs the question of whether the average is precisely 1 millisecond or a rounded number. Further, an administrator in a tuning exercise would be left wondering what the effect of I/O queueing had on this average.
It turns out that, indeed, CALIBRATE_IO is producing a rounded integer value that represents the latency it measures (in milliseconds), as shown in the package definition in $ORACLE_HOME/rdbms/admin/dbmsrmad.sql. Rounding to the nearest millisecond is not accurate enough for today’s latency-sensitive database processing. In today’s latency-sensitive world, rounding to integer values is simply not sufficient information. So what about the effect of I/O queueing on the CALIBRATE_IO results in Figure 1? Figure 2 shows I/O queueing data from the CALIBRATE_IO test depicted in Figure 1.
Figure 2 shows how CALIBRATE_IO is a full-throttle I/O generator. This means that there is no information about latency and queueing as I/O demand increases. CALIBRATE_IO comes out of the gate, as it were, full throttle with no ramp-up. Lacking in data for IOPS rates at lower demand (e.g., 2,000 or 10,000 IOPS) leaves the administrator with insufficient information. Learning something about your system at maximum-state processing leaves questions unanswered.
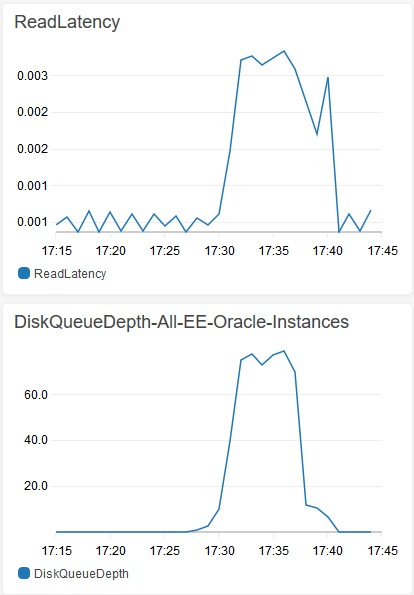
Figure 2: CloudWatch metrics – Read latency and queue depth during CALIBRATE_IO test
So if CALIBRATE_IO is necessary for supplying internal information to functionality such as Auto DOP, but it’s not sufficient for robust and accurate testing of physical I/O, what is an Oracle Database administrator to do?
AskTOM
For decades, Oracle database administrators have turned to the venerable AskTOM website for answers to questions, such as which tools to test with. In the not-too-distant past, an Oracle user submitted a question about tools for testing storage IOPS with Oracle Database. Figure 3 shows the answer, as provided by the AskTOM folks.
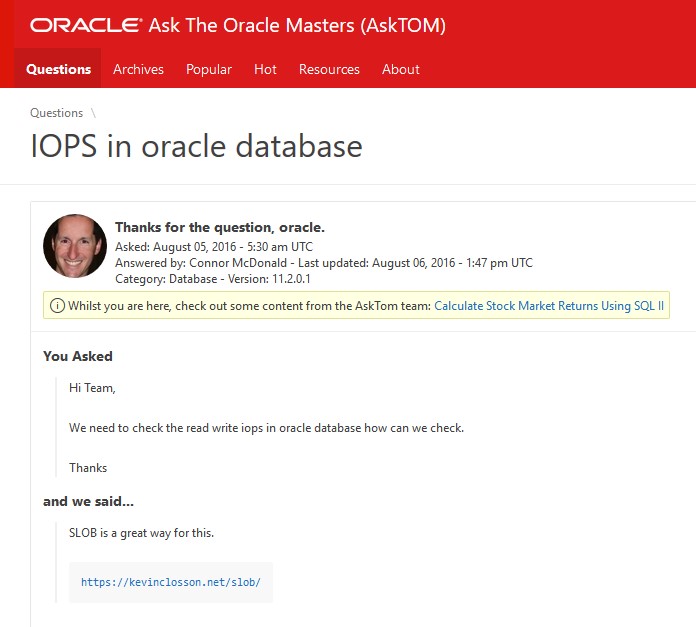
Figure 3: AskTOM on the topic of I/O testing tools
Testing with SLOB
SLOB is also known as The Simple Database I/O Testing Toolkit for Oracle Database. SLOB is very simple and accurate and contains features that allow for more sophisticated I/O testing than what is provided by a simple bounds-testing tool such as CALIBRATE_IO or Orion. SLOB is freeware and available to the public on the SLOB Resources page. Over the years, SLOB has become very popular for testing storage subsystems using Oracle Database. It is not a database benchmark. To the contrary, SLOB uses Oracle Database to test the underlying system’s ability to deliver predictable IOPS at favorable latency. To read more about how pervasive SLOB has become for testing systems by industry vendors, see the SLOB Use Cases By Industry Vendors page. To see how simple SLOB is to deploy, see the Step-by-Step SLOB Installation page.
Important: The SLOB toolkit is capable of demanding all physical I/O bandwidth available from an RDS for Oracle instance and should therefore not be executed on production systems. As per the documentation, SLOB creates users (schemas) in the database and both tables and indexes in the specified tablespace. The setup script also generates a cleanup script called drop_users.sql, which can be used to properly clean up after testing with SLOB.
Example testing results
To show the type of I/O testing that is possible with SLOB, a simple test was conducted, and both screenshots and raw data were captured. This section includes those results.
To prepare for the test, we created a 1 TB SLOB database in an Amazon RDS for Oracle instance (db.m4.10xlarge instance type) backed with a 6,144 GB Provisioned IOPS EBS volume with 30,000 IOPS provisioned. After loading the database as per the SLOB documentation, we conducted a series of read-only SLOB tests.
To show the scale-up relationship between increasing IOPS and I/O queueing, the test cycle increased the number of direct-connected Oracle Database sessions from 1 to 50. Each session executed zero think-time SQL calls to the database, which generates random, single-block (8 KB) reads from the database data files that are stored on the EBS volume.
We used the following simple sequence of bash commands to produce the test results:
Figure 4 shows pertinent graphs from a screenshot of the RDS for Oracle dashboard with Enhanced Monitoring enabled after the test cycle concluded.
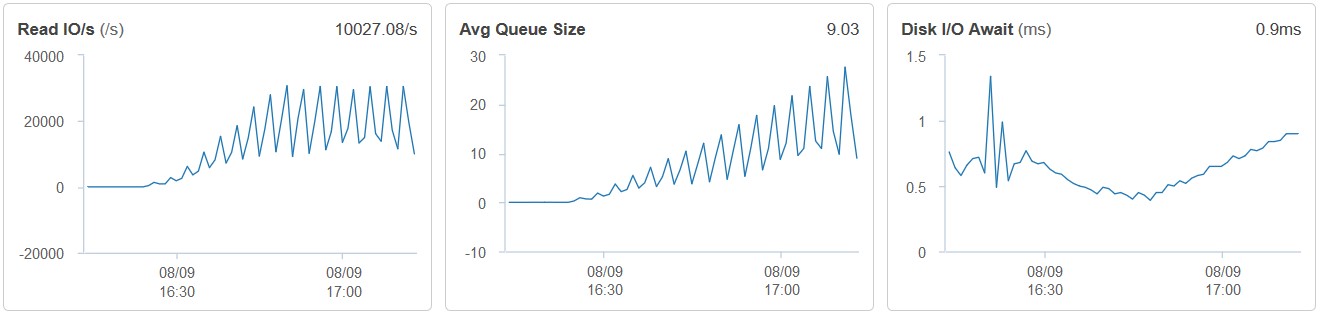
Figure 4: RDS for Oracle I/O data during SLOB testing
As Figure 4 shows, a scale-up SLOB test from 1 to 50 sessions allows for scrutiny of important I/O fundamentals, such as the average queue depth and I/O waits (a representation of host-level I/O latency). In stark contrast to what CALIBRATE_IO revealed from the same system (see Figure 2), SLOB testing allows you to earn trust in the predictable nature of physical I/O on Provisioned IOPS EBS volumes. Clearly, latency only increased to the 1-millisecond level as the IOPS rate neared the provisioned limit for the volume (30,000) but started out below 500 microseconds. As the number of sessions performing zero think-time reads increased, I/O demand increased.
As you would hope, this style of testing shows that I/O service times are faster at lower IOPS rate and only increase in a predictable curve commensurate with the increase of IOPS. That was indeed the case.
Figure 4 also shows how IOPS remains flat and queue depth increases predictably after the number of zero think-time sessions drives IOPS to the 30,000 limit. It’s important to note that I/O demand beyond the 30,000 limit for this volume does not result in a pathology. Instead, piling on more requests for random I/O simply results in queueing. It’s often helpful to ensure that even a system driven to subsystem limits behaves predictably as depicted by linear, upward-sloping graphs—free of any anomalous spikes.
Oracle internal performance data
All Oracle Database practitioners know that host-level metrics—while important—are not the end-all, say-all when it comes to system performance. To the contrary, Oracle Database internal metrics represent the view of the world as experienced by the applications that are connected to the database instance.
As per SLOB documentation, the kit optionally generates STATSPACK or Automatic Workload Repository (AWR) reports—in text format. Additionally, the kit includes a script to post-process AWR reports in a way that generates delimited data that can easily be pasted into a spreadsheet for graphing. The tool for post-processing is called awr_info.sh.
Figure 5 shows a graph generated by the data harvested from the AWR reports that were collected during the scale-up test depicted in Figure 4. Figure 5 shows DB File Sequential Read events per second along with the average wait times for these single-block (8 KB) physical reads.
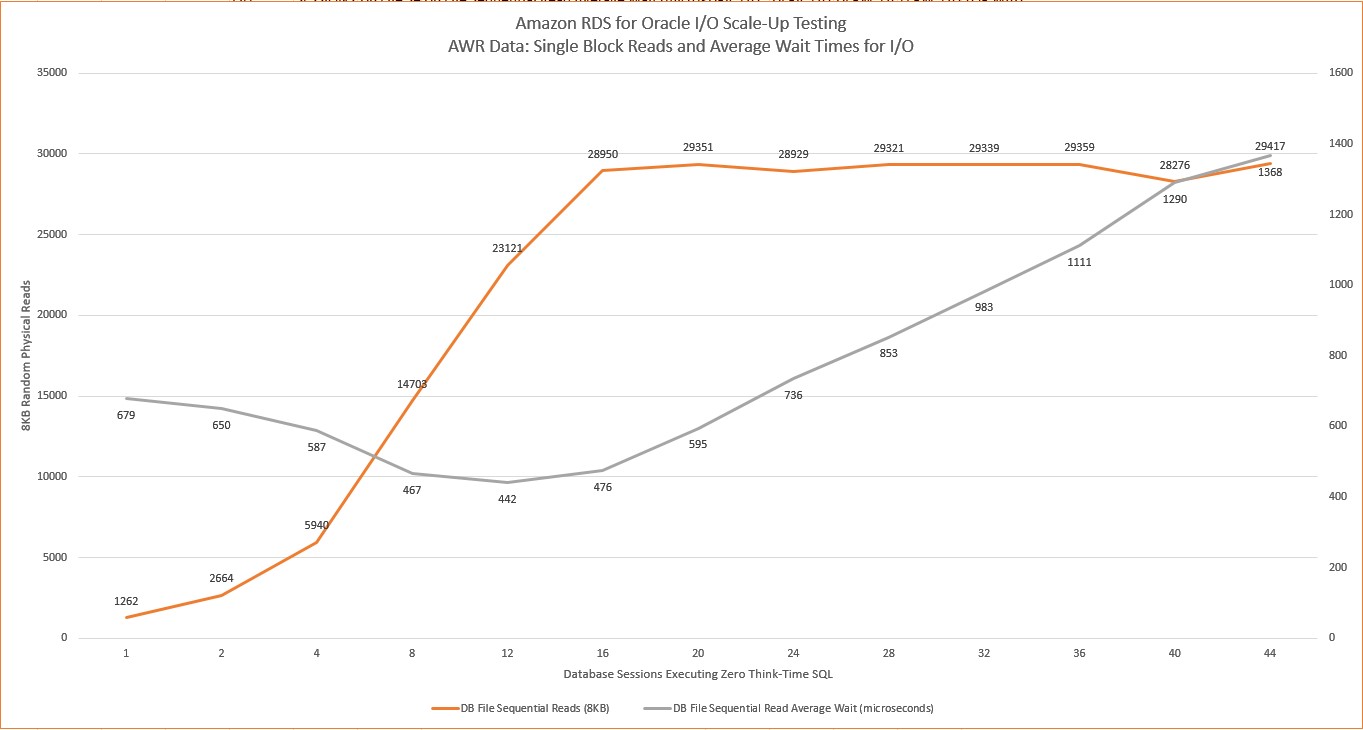
Figure 5: AWR Data – Scale-UP I/O testing with Amazon RDS for Oracle
Summary
In this post, we set out to introduce a testing toolkit and method that you can use to develop trust in the predictable performance offered by the Amazon RDS for Oracle instances that you configure. Testing in the manner shown in this post is a good way to ensure that you have a rich understanding of the instances that you configure—before going live with applications.