AWS Database Blog
Viewing Amazon Elasticsearch Service Slow Logs
September 8, 2021: Amazon Elasticsearch Service has been renamed to Amazon OpenSearch Service. See details.
Today, Amazon Elasticsearch Service (Amazon ES) announced support for publishing slow logs to Amazon CloudWatch Logs. This new feature enables you to publish Elasticsearch slow logs from your indexing and search operations and gain insights into the performance of those operations.
You can enable slow logs to identify whether a performance issue on your cluster is being caused by particular queries or is due to changes in usage. You can then use that information to work with your users to optimize their queries or index configuration to address the problem.
You can turn the logs on and off at will, paying only for the CloudWatch charges based on their usage.
Set up delivery of slow logs for your domain
To enable slow logs for your domain, sign in to the AWS Management Console and choose Elasticsearch Service. On the Amazon ES console, choose your domain name in the list to open its dashboard. Then choose the Logs tab.

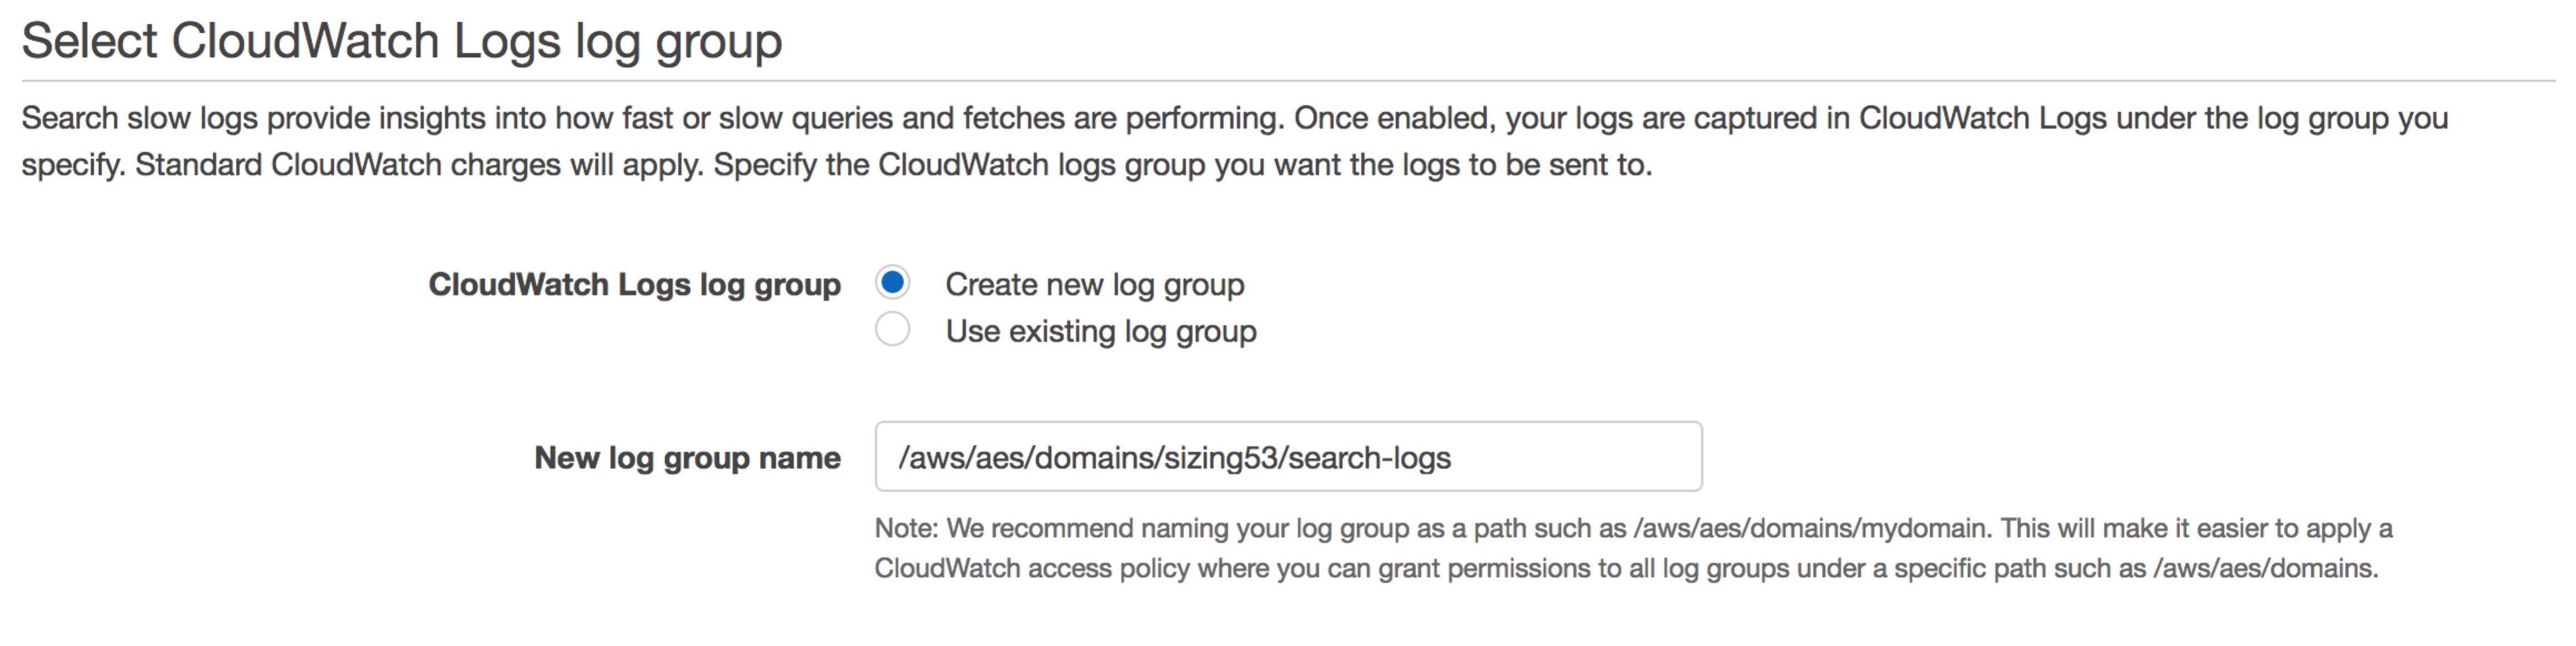
In this pane, you configure your Amazon ES domain to publish to a CloudWatch Logs log group. You can control the delivery of search and indexing slow logs independently. Under Set up Search slow logs, choose Setup. You can choose to Create new log group or Use existing log group. We recommend naming your log group as a path, such as /aws/aes/domains/mydomain. This naming scheme makes it easier to apply a CloudWatch access policy, in which you can grant permissions to all log groups under a specific path, such as /aws/aes/domains.
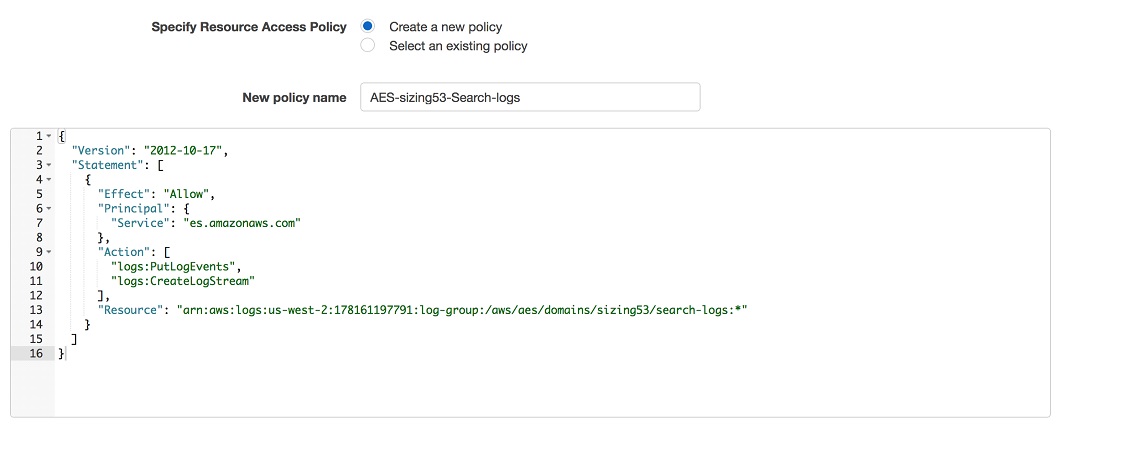
To deliver logs to your CloudWatch Logs group, Amazon ES needs permission to write to CloudWatch Logs on your behalf. You can choose to Create a new policy or Select an existing policy. You can accept the policy as-is. Or, if your log group names are paths, you can widen the Resource—for example, ‘arn:aws:logs:us-west-2:123456789012:log-group:/aws/aes/domains/*’. You can then reuse this policy for all your domains.
Choose Enable, and you have completed setup. Your domain can now send slow logs to CloudWatch Logs.
Enable delivery of slow logs for your domain
Now that you have enabled the publishing of slow logs, you can start generating them. You control which slow logs are generated using the Elasticsearch index settings API. By default, no logs are enabled. You send an API call to control the debug level and timing threshold for the logging levels. These parameters are dynamic. You can change them on a running cluster, and the changes are reflected immediately.
For search slow logs, you can enable logging for both the query and fetch phases of search execution at the trace, debug, info, and warn debug levels. To enable logging, change the threshold from the default -1 to a time unit.
If you’re using curl:
Be sure to use your domain’s endpoint, the index, and the logging level you want to set. Also, be sure to use PUT as your HTTP verb.
The value for the setting is a time unit and acts as a threshold. Queries/indexing that take longer than your threshold are logged. If you want to log everything, you can set the threshold to 0ms. Logging everything—for example, setting trace to 0ms—can affect your performance and may be costly because all requests are logged to CloudWatch Logs. To disable logging, set the threshold to -1.
It can take up to half an hour for logs to begin arriving in CloudWatch Logs.
You can similarly set the following for searches:
- index.search.slowlog.threshold.query.warn
- index.search.slowlog.threshold.query.info
- index.search.slowlog.threshold.query.debug
- index.search.slowlog.threshold.query.trace
- index.search.slowlog.threshold.fetch.warn
- index.search.slowlog.threshold.fetch.info
- index.search.slowlog.threshold.fetch.debug
- index.search.slowlog.threshold.fetch.trace
The indexing parameters are slightly different. You can set time thresholds for the following:
- index.indexing.slowlog.threshold.index.warn
- index.indexing.slowlog.threshold.index.info
- index.indexing.slowlog.threshold.index.debug
- index.indexing.slowlog.threshold.index.trace
In addition, you can set the following:
- index.indexing.slowlog.level: trace
- index.indexing.slowlog.source: 255
Adjust the source to control how many characters of the source document are logged with the error. Amazon Elasticsearch Service limits the published source to 255 characters. Set source to true to log 255 characters, or use a smaller number to log less. Adjust the level to filter out less important messages.
View your log data
To see your log data, sign in to the AWS Management Console, and open the CloudWatch console. In the left navigation pane, choose the Logs tab. Find your log group in the list of groups and open the log group. Your log group name is the Name that you set when you set up logging in the Amazon ES wizard.
Within your log group, you should see a number of log streams.

Amazon ES creates an es-test-log-stream during setup to ensure that it can write to CloudWatch Logs. This stream contains only a single test message.
Your slow logs arrive within 30 minutes and have long hex names, suffixed by either index-slow-logs or search-slow-logs to indicate the source of the log data. Choose one of these to view the contents.

You should see individual entries for each of the slow log entries.
Conclusion
By setting your thresholds appropriately, you can log and examine your slow queries and updates. With this knowledge, you can optimize your queries or tailor your deployment for indexing. Of course, you can also use the integration of CloudWatch Logs and Amazon ES to send slow logs to a different Amazon ES domain and monitor your domain’s performance.
About the Author
 Jon Handler (@_searchgeek) is an AWS solutions architect specializing in search technologies. He works with our customers to provide guidance and technical assistance on database projects, helping them improve the value of their solutions when using AWS.