AWS DevOps & Developer Productivity Blog
Generating DevOps Guru Proactive Insights for Amazon ECS
Monitoring is fundamental to operating an application in production, since we can only operate what we can measure and alert on. As an application evolves, or the environment grows more complex, it becomes increasingly challenging to maintain monitoring thresholds for each component, and to validate that they’re still set to an effective value. We not only want monitoring alarms to trigger when needed, but also want to minimize false positives.
Amazon DevOps Guru is an AWS service that helps you effectively monitor your application by ingesting vended metrics from Amazon CloudWatch. It learns your application’s behavior over time and then detects anomalies. Based on these anomalies, it generates insights by first combining the detected anomalies with suspected related events from AWS CloudTrail, and then providing the information to you in a simple, ready-to-use dashboard when you start investigating potential issues. Amazon DevOpsGuru makes use of the CloudWatch Containers Insights to detect issues around resource exhaustion for Amazon ECS or Amazon EKS applications. This helps in proactively detecting issues like memory leaks in your applications before they impact your users, and also provides guidance as to what the probable root-causes and resolutions might be.
This post will demonstrate how to simulate a memory leak in a container running in Amazon ECS, and have it generate a proactive insight in Amazon DevOps Guru.
Solution Overview
The following diagram shows the environment we’ll use for our scenario. The container “brickwall-maker” is preconfigured as to how quickly to allocate memory, and we have built this container image and published it to our public Amazon ECR repository. Optionally, you can build and host the docker image in your own private repository as described in step 2 & 3.
After creating the container image, we’ll utilize an AWS CloudFormation template to create an ECS Cluster and an ECS Service called “Test” with a desired count of two. This will create two tasks using our “brickwall-maker” container image. The stack will also enable Container Insights for the ECS Cluster. Then, we will enable resource coverage for this CloudFormation stack in Amazon DevOpsGuru in order to start our resource analysis.
![Architecture Diagram showing the service “Test” using the container “brickwall-maker” with a desired count of two. The two ECS Task’s vended metrics are then processed by CloudWatch Container Insights. Both, CloudWatch Container Insights and CloudTrail, are ingested by Amazon DevOps Guru which then makes detected insights available to the user. [Image: DevOpsGuruBlog1.png]V1: DevOpsGuruBlog1.drawio (https://api.quip-amazon.com/2/blob/fbe9AAT37Ge/LdkTqbmlZ8uNj7A44pZbnw?name=DevOpsGuruBlog1.drawio&s=cVbmAWsXnynz) V2: DevOpsGuruBlog1.drawio (https://api.quip-amazon.com/2/blob/fbe9AAT37Ge/SvsNTJLEJOHHBls_kV7EwA?name=DevOpsGuruBlog1.drawio&s=cVbmAWsXnynz) V3: DevOpsGuruBlog1.drawio (https://api.quip-amazon.com/2/blob/fbe9AAT37Ge/DqKTxtQvmOLrzM3KcF_oTg?name=DevOpsGuruBlog1.drawio&s=cVbmAWsXnynz)](https://d2908q01vomqb2.cloudfront.net/7719a1c782a1ba91c031a682a0a2f8658209adbf/2021/10/29/DevOpsGuruBlog1-1-1.png)
Source provided on GitHub:
- DevOpsGuru.yaml
- EnableDevOpsGuruForCfnStack.yaml
- Docker container source
Steps:
1. Create your IDE environment
In the AWS Cloud9 console, click Create environment, give your environment a Name, and click Next step. On the Environment settings page, change the instance type to t3.small, and click Next step. On the Review page, make sure that the Name and Instance type are set as intended, and click Create environment. The environment creation will take a few minutes. After that, the AWS Cloud9 IDE will open, and you can continue working in the terminal tab displayed in the bottom pane of the IDE.
Install the following prerequisite packages, and ensure that you have docker installed:
sudo yum install -y docker
sudo service docker start
docker --version2. Optional : Create ECR private repository
If you want to build your own container image and host it in your own private ECR repository, create a new repository with the following command and then follow the steps to prepare your own image:
3. Optional: Prepare Docker Image
Authenticate to Amazon Elastic Container Registry (ECR) in the target region
In the above command, as well as in the following shown below, make sure that you replace 123456789012 with your own account ID.
Build brickwall-maker Docker container:
Tag the Docker container to prepare it to be pushed to ECR:
Push the built Docker container to ECR
4. Launch the CloudFormation template to deploy your ECS infrastructure
To deploy your ECS infrastructure, run the following command (replace your own private ECR URL or use our public URL) in the ParameterValue) to launch the CloudFormation template :
5. Enable DevOps Guru to monitor the ECS Application
Run the following command to enable DevOps Guru for monitoring your ECS application:
6. Wait for base-lining of resources
This step lets DevOps Guru complete the baselining of the resources and benchmark the normal behavior. For this particular scenario, we recommend waiting two days before any insights are triggered.
Unlike other monitoring tools, the DevOps Guru dashboard would not present any counters or graphs. In the meantime, you can utilize CloudWatch Container Insights to monitor the cluster-level, task-level, and service-level metrics in ECS.
7. View Container Insights metrics
- Open the CloudWatch console.
- In the navigation pane, choose Container Insights.
- Use the drop-down boxes near the top to select ECS Services as the resource type to view, then select DevOps Guru as the resource to monitor.
- The performance monitoring view will show you graphs for several metrics, including “Memory Utilization”, which you can watch increasing from here. In addition, it will show the list of tasks in the lower “Task performance” pane showing the “Avg CPU” and “Avg memory” metrics for the individual tasks.
8. Review DevOps Guru insights
When DevOps Guru detects an anomaly, it generates a proactive insight with the relevant information needed to investigate the anomaly, and it will list it in the DevOps Guru Dashboard.
You can view the insights by clicking on the number of insights displayed in the dashboard. In our case, we expect insights to be shown in the “proactive insights” category on the dashboard.
Once you have opened the insight, you will see that the insight view is divided into the following sections:
- Insight Overview with a basic description of the anomaly. In this case, stating that Memory Utilization is approaching limit with details of the stack that is being affected by the anomaly.
- Anomalous metrics consisting of related graphs and a timeline of the predicted impact time in the future.
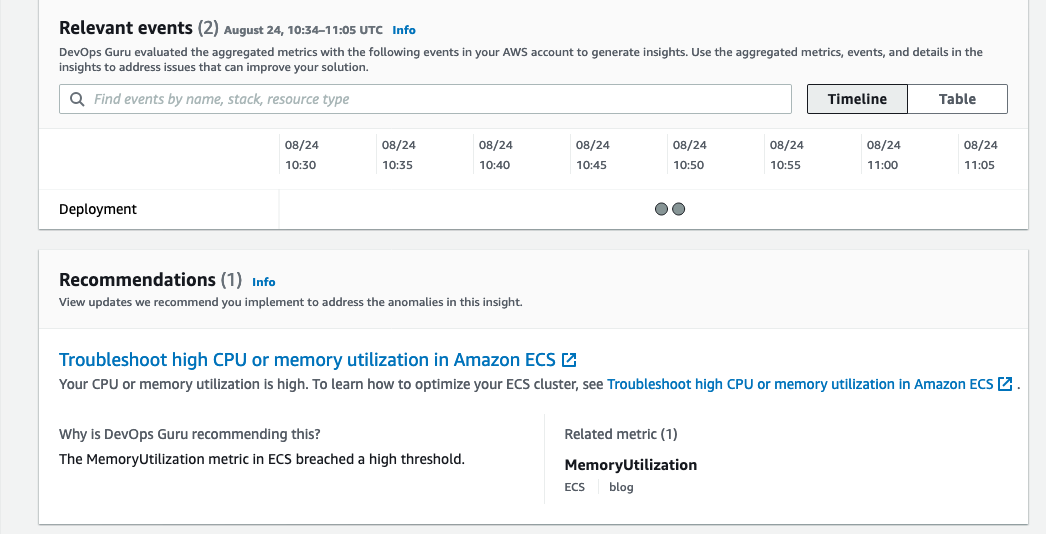
- Relevant events with contextual information, such as changes or updates made to the CloudFormation stack’s resources in the region.
- Recommendations to mitigate the issue. As seen in the following screenshot, it recommends troubleshooting High CPU or Memory Utilization in ECS along with a link to the necessary documentation.
The following screenshot illustrates an example insight detail page from DevOps Guru

Conclusion
This post describes how DevOps Guru continuously monitors resources in a particular region in your AWS account, as well as proactively helps identify problems around resource exhaustion such as running out of memory, in advance. This helps IT operators take preventative actions even before a problem presents itself, thereby preventing downtime.
Cleaning up
After walking through this post, you should clean up and un-provision the resources in order to avoid incurring any further charges.
- To un-provision the CloudFormation stacks, on the AWS CloudFormation console, choose Stacks. Select the stack name, and choose Delete.
- Delete the AWS Cloud9 environment.
- Delete the ECR repository.