AWS for Industries
Fast queries of scRNAseq datasets with Amazon Athena
Single cell RNA sequencing data has a growing role in disease research for finding both potential genetic factors and paths to new treatments. An important component of this process involves building maps of sequencing data with dimensionality reduction tools and querying specific subsets for visualization, but this can be slow due to the size of the datasets. AWS tools can be used to reduce access latency and improve the workflow for faster queries of sequencing datasets across scales.
Introduction
Amazon Web Services (AWS) scientists and engineers recently participated in a hackathon to streamline a bottleneck in gene expression workflows. Researchers in this field use single-cell RNA sequencing (scRNAseq) data to measure gene expression and search for correlations with diseases. In order to find patterns in the expression data, researchers often build a map of the raw data using dimensionality reduction tools, where points on the map represent cells, and their positions are determined by the relative quantitative similarity between expression profiles.
The points can be colored by the disease that the cell donor has, the type of cell, or the organ from which the cell came. Researchers look for clusters that emerge on the map and investigate patterns that may appear. Building the map requires loading the data, learning a mapping function (with tSNE, UMAP, or the supervised, interpretable model described below) and plotting the points using the map.
The Challenge
If the cells from one disease split into multiple clusters on the map, for example, a researcher may zoom into that subset of the data and try to determine what genes give rise to those separate clusters. If they don’t find anything of interest there, they can zoom out and search for further interesting patterns in the data.
This is the bottleneck in the workflow: the process of querying the whole dataset for a specific subset matching a set of desired properties can be very slow. Faster response times can be achieved by processing the data with a large compute instance, but this can lead to higher costs in the long term.
Researchers want this process to be as fast as possible in order to iterate through different subsets to find something of interest. When a possible correlation is found, researchers can then pursue rigorous statistical testing and further experiments for validation. Once a gene has been shown to play a role in tumor formation, it can be targeted for treatment, like in a large-scale clinical trial for lung cancer patients.
The Solution
Here we develop an approach to solve the problem of quickly finding and visualizing relevant subsets of scRNAseq data with an insightful application of Amazon Athena, AWS Glue and Amazon SageMaker (SageMaker). With this approach, researchers can access subsets of typical scRNAseq datasets with a response time on the order of seconds, allowing for faster iteration of ideas and more efficient research.
The Processing Pipeline
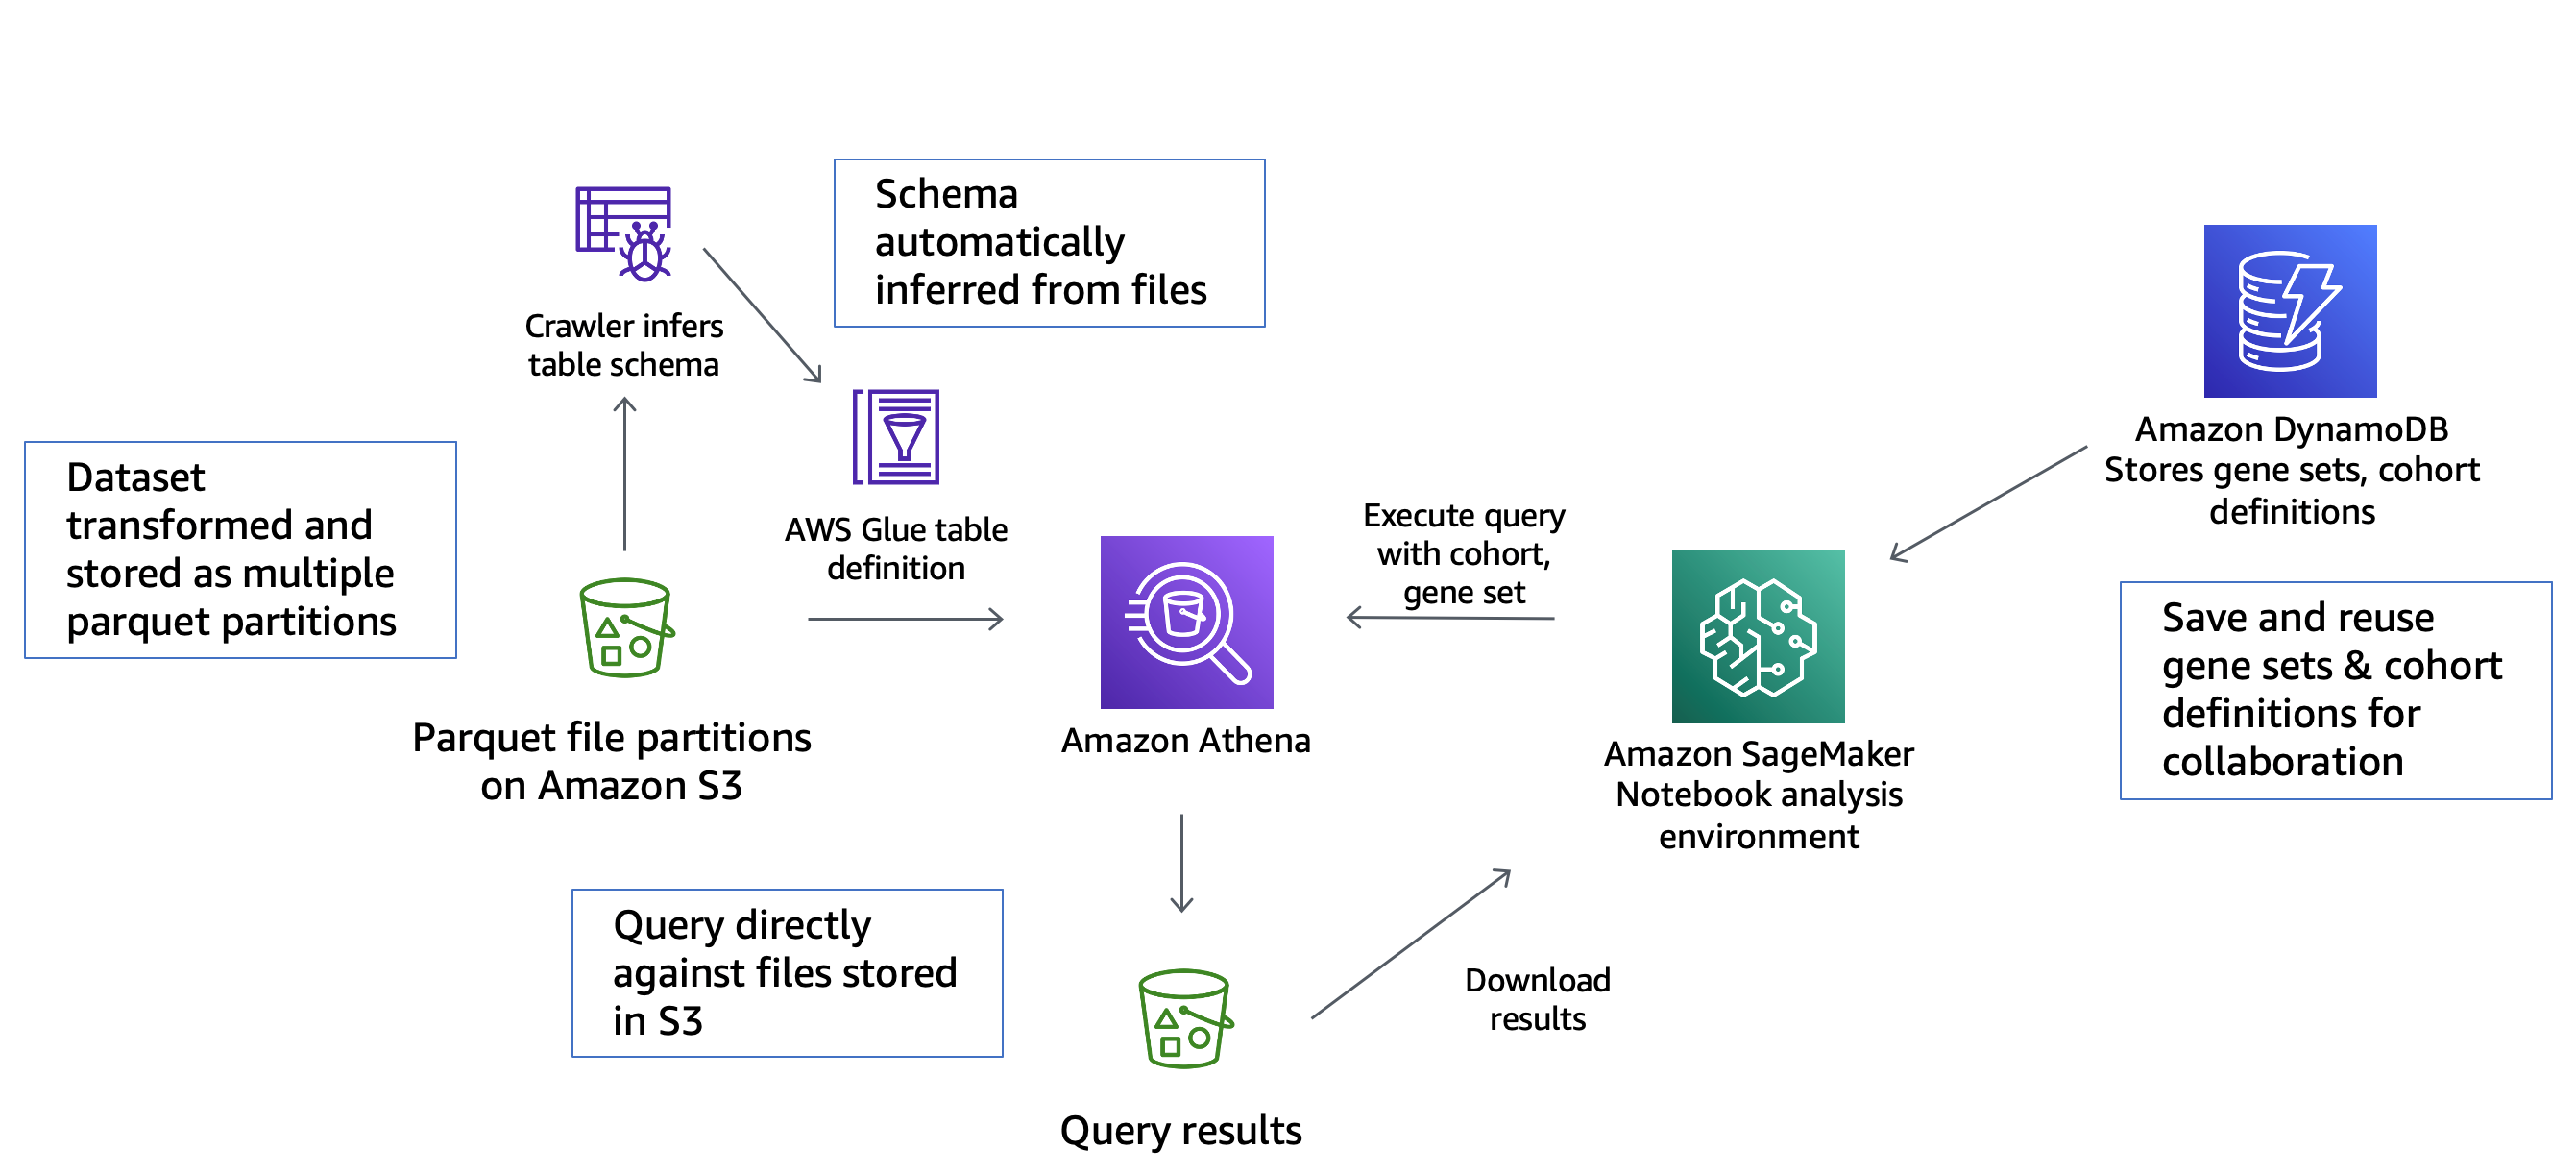
Figure 1 – High-level architecture of the solution for fast querying and visualization of scRNAseq data
Figure 1 shows the architecture of the pipeline for faster scRNAseq access. Below is a description of how the data flows through the pipeline:
- Amazon Simple Storage Service (Amazon S3) lets us break down a large scRNAseq dataset stored as an hdf5 file into multiple smaller parquet files—allowing for fast, parallel access.
- Amazon S3 is a cloud-based file storage system.
- AWS Glue then scans the parquet files, inferring schema before storing them in a table, allowing for automated access to subsets of the data according to attribute values.
- AWS Glue is a serverless data integration service for analytics users to discover, prepare, move, and integrate data from multiple sources.
- Amazon Athena enables programmatically querying the data using SQL to find desired subsets.
- Amazon Athena allows the use of SQL queries for files stored on Amazon S3.
- Amazon DynamoDB stores definitions of subsets―allowing for faster access upon reuse of previously accessed subsets.
- Amazon DynamoDB is a fully managed, serverless, key-value NoSQL database designed to run high-performance applications at any scale.
- Amazon SageMaker runs custom python scripts to apply dimensionality reduction and generate visualizations of data subsets to allow researchers to find patterns.
- Amazon SageMaker is a cloud compute platform for building, training and deploying high-quality machine learning models quickly.
Tabula muris senis (mouse) scRNAseq dataset benchmark
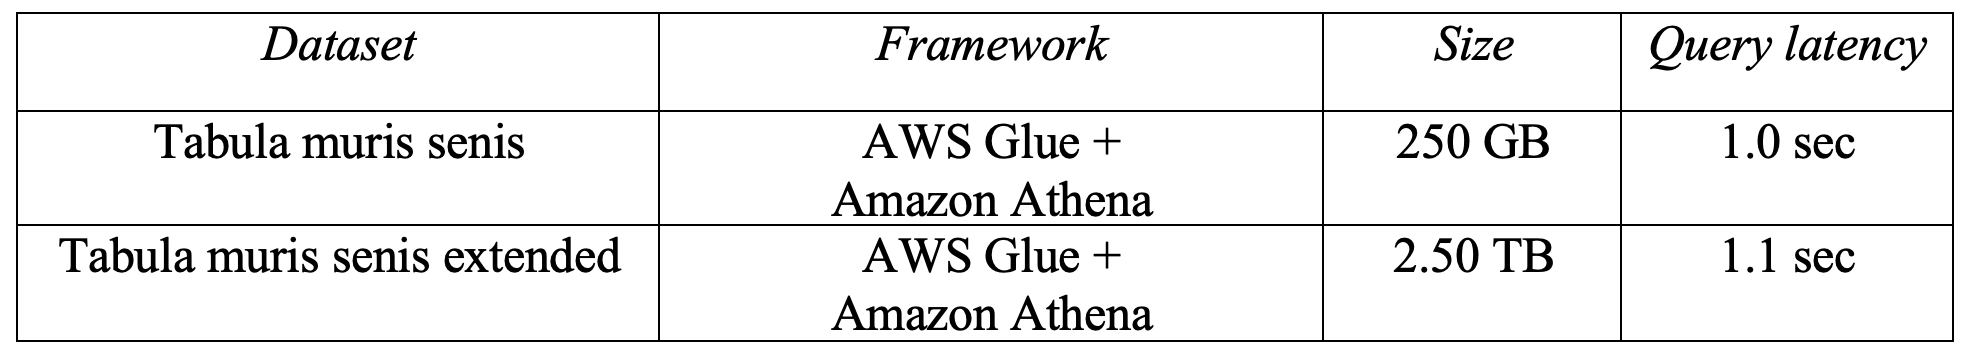
Table 1 – Results for query latency for example medium and large versions of the tabula muris senis dataset
As a benchmark, the ‘tabula muris senis’ mouse scRNAseq dataset, published by the Chan-Zuckerberg BioHub and hosted on Amazon’s Registry of Open Data (RODA), was evaluated. Data subsets of any size from this 250 GB dataset were found to be returned in approximately 1.0 seconds on average.
As an experiment, the dataset was also copied ten times to create a much larger test dataset with approximately two and a half million rows. Access time to subsets for this 2.5 TB artificial dataset were found to be 1.1 seconds on average. Amazon Athena charges per query, and you can estimate costs here.
The CZ BioHub code repository for the tabula muris senis dataset includes preprocessing tools as well as the methods needed to generate figures in the publication. They used the scanpy package to apply the dimensionality reduction algorithms tSNE and UMAP. These mappings can be computed initially for the whole dataset and used for any subset of the data.
tSNE and UMAP are favored due to their unsupervised objective functions and because the clusters often correspond to labels (like the donor, the organ of origin of the cell or the type of cell, as seen in the mapping from CZ BioHub’s CELLxGENE visualizer). However, it is not straightforward to extract the contributions of individual input features to a cell’s position on the map or membership in a particular cluster. Here, our approach uses a bias-free deep ReLU network for multi-label supervised dimensionality reduction, where the network’s last linear layer compresses the representation to only two dimensions. The bias-free design allows a user to decompose the mapping to determine which features are most important for a particular label.
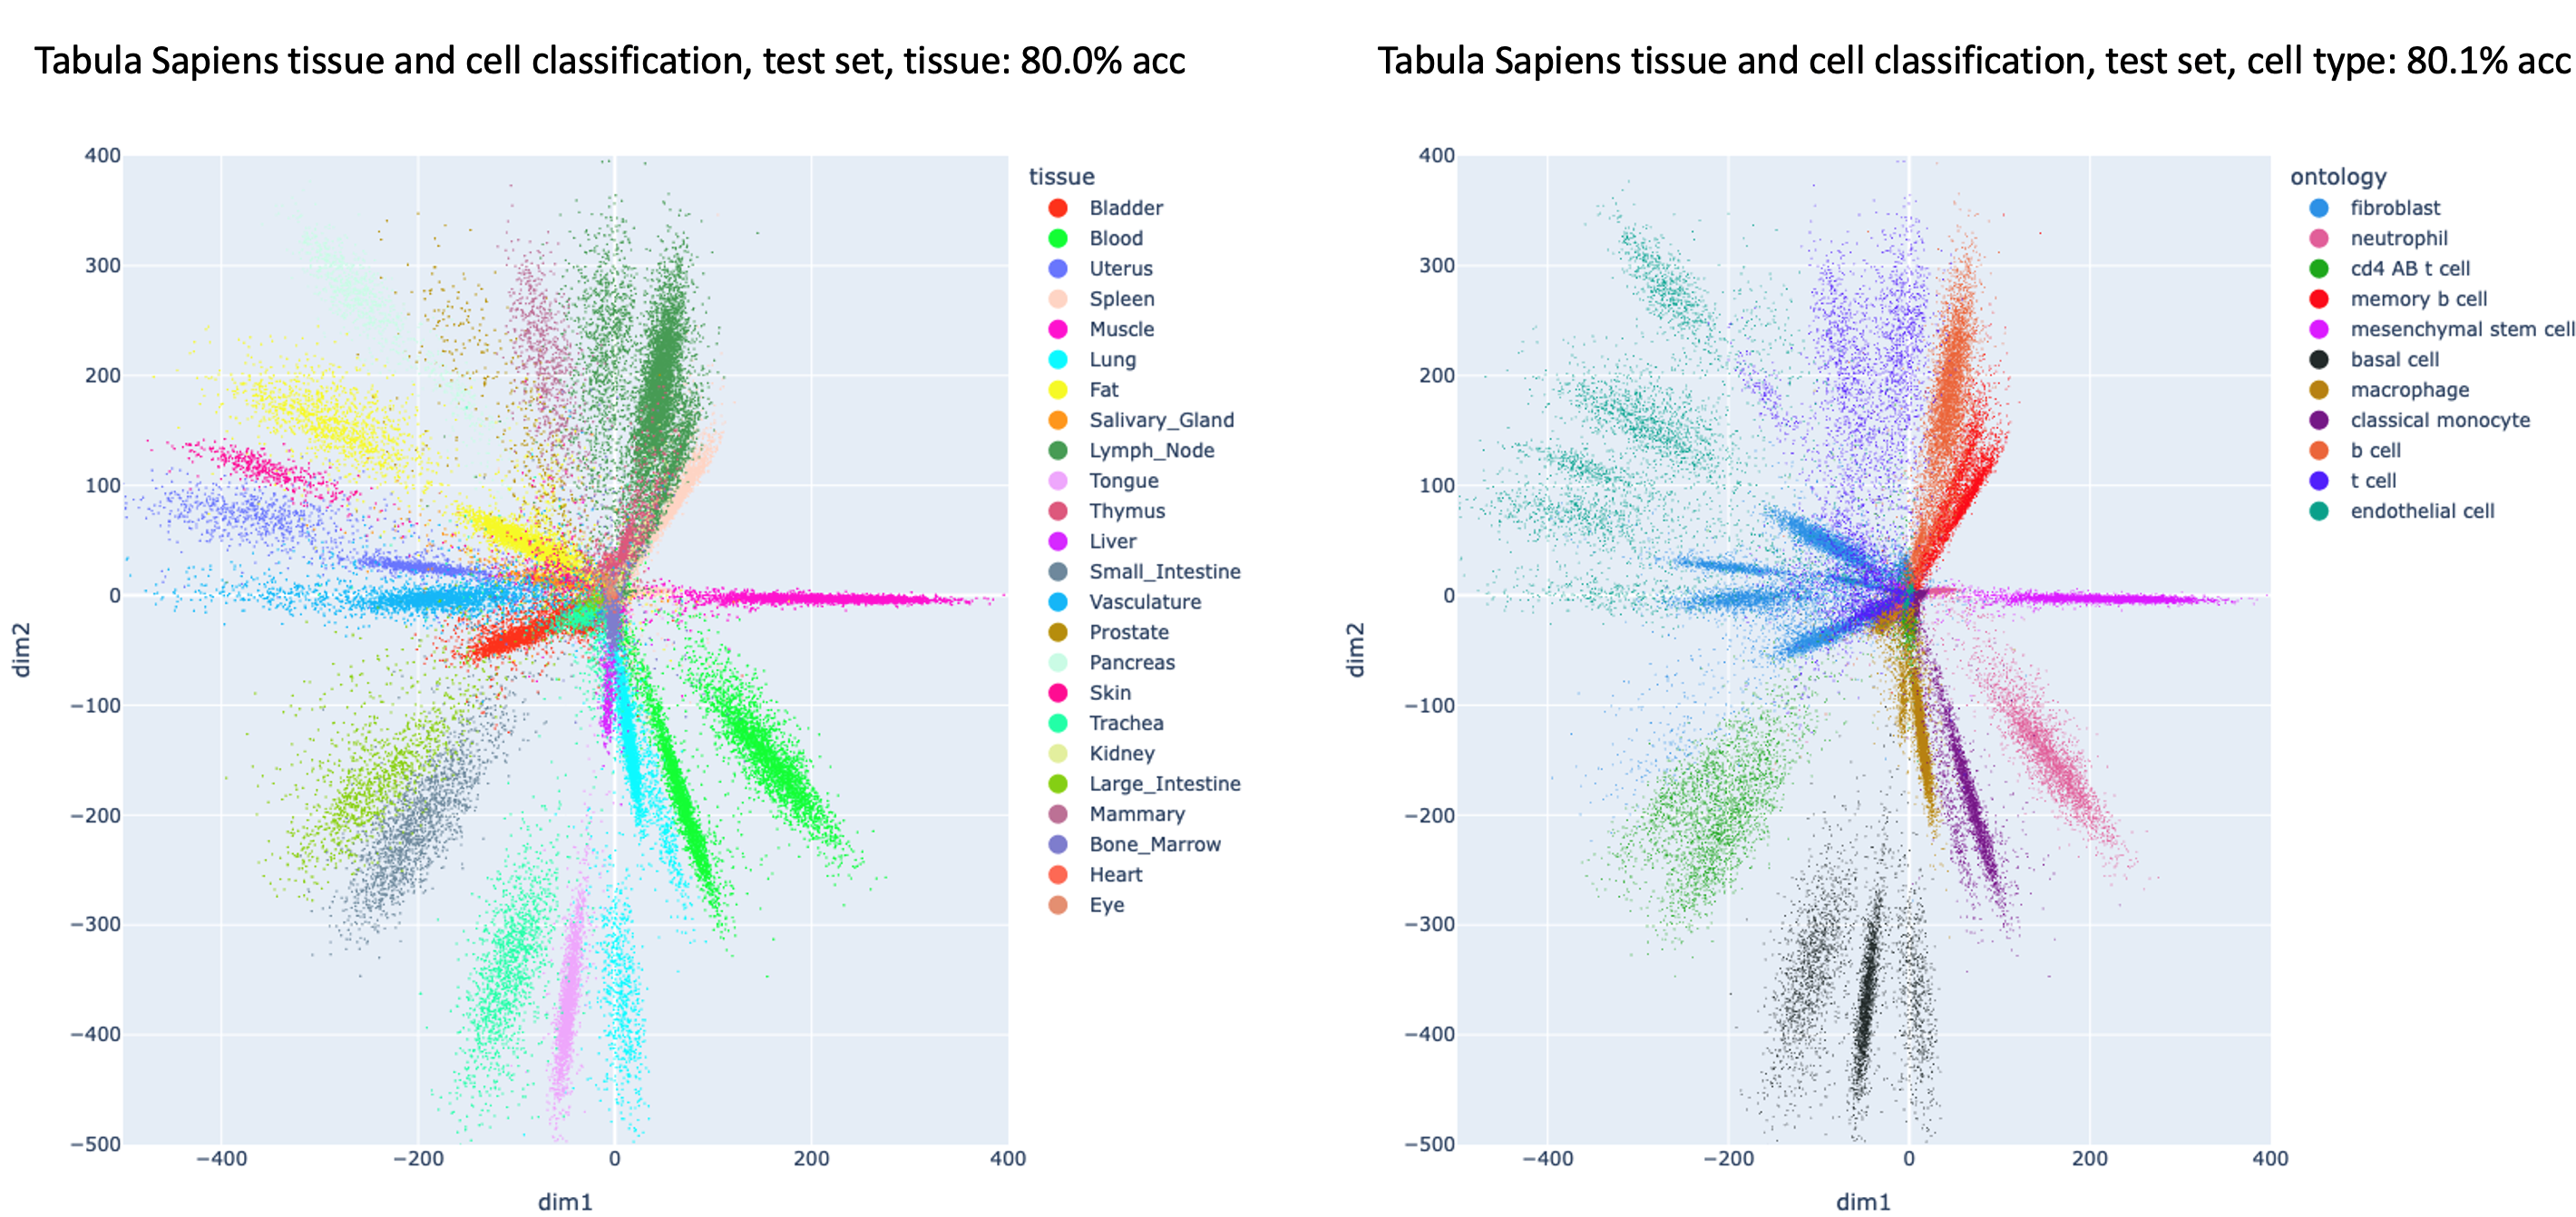
Figure 2 – Dimensionality reduction for the Tabula Sapiens test set with a supervised deep network trained to predict both the organ (left) and the cell type (right)
Figure 2 illustrates multi-label supervised dimensionality reduction for a test set from the CZ BioHub Tabula Sapiens scRNAseq dataset from human patients. The axes of the plots are the activations of the two nodes in the network’s last linear layer for each input point in the test set. On the left is the mapping colored by the organ from which the cell came, and on the right is the cell type. Note that the network is able to arrange points from the same classes to be close to each other for multiple labels. The classifier is also explainable at the level of input features for individual predictions so that the genes that give rise to different clusters for the same class (or incorrect predictions by the classifier) can be investigated.
Other Considerations
It should be noted that this analysis started with pre-packaged per-cell gene expression data for the CZ BioHub open datasets. If you want to adapt this approach for your own purposes, consider Amazon Omics for storing single cell sequence data and running workflows to calculate gene expression.
Conclusion
Single-cell RNA sequencing data is cumbersome to work with. Finding relevant subsets of the data is a slow process, and conventional mapping tools are not interpretable at the feature level.
The approach outlined here allows researchers to generate any subset of a large dataset with constant time complexity on the order of seconds. The supervised deep network approach to dimensionality reduction allows for determination of the input features that separate different classes of cells.
With this approach, it is possible to iterate through ideas quickly with scRNAseq data and generate hypotheses for connecting gene expression to disease.
To find out what AWS can do for you, please contact an AWS Representative.
Further Reading
- Executive Conversations: Driving precision oncology care using multi-modal data with Louis Culot of Philips
- Using Amazon FSx for Lustre for Genomics Workflows on AWS
- Machine Learning Leukemia diagnosis at Munich Leukemia Lab with Amazon SageMaker
- Driving innovation in single-cell analysis on AWS
- Part 1: Introducing Amazon Omics—from sequence data to insights, securely and at scale
- Part 2: Automated End-to-End Genomics Data Storage and Analysis using Amazon Omics
- Part 3: Amazon Omics launches with broad support from ISV and Consulting Partners