AWS for Industries
Scalable rig-report-processing solution on AWS
Introduction
Daily rig reports, such as drilling, completion, and workover reports, are critical to the oil and gas industry because they provide important information about all rig operations (Figure 1) and help maintain operational efficiency and safety. However, manually processing these reports can be a daunting task, especially given the large volumes of drilling and completion reports that are generated daily. Though these reports have common sections describing and logging various drilling and completion activities along with engineering parameters, the document formats are not standard across oil and service companies and vary significantly. This makes manual data extraction and storage processes not only time consuming but also prone to errors, which can result in inaccurate or missing data. To address this issue, we have developed a scalable rig-report-processing solution on Amazon Web Services (AWS). The three-part AWS blog series explores a comprehensive solution for the oil and gas industry, focusing on rig report data processing, extraction, and the use of extracted data for machine learning and generative AI to derive actionable insights.
In this blog #1, we will describe the scalable solution, demonstrate the data extraction using AWS services, and derive insights from thousands of daily drilling reports using public datasets.
In the second blog, we delve into leveraging the extracted data from rig reports for machine learning applications, specifically text classification to predict rig operation categories, to enhance decision-making and operational efficiency in the rig operations. In the third blog, we leverage generative AI to analyze and gain insights from the data extracted from rig reports. These insights enhance decision making and operational efficiencies by providing a deeper understanding of rig operations.
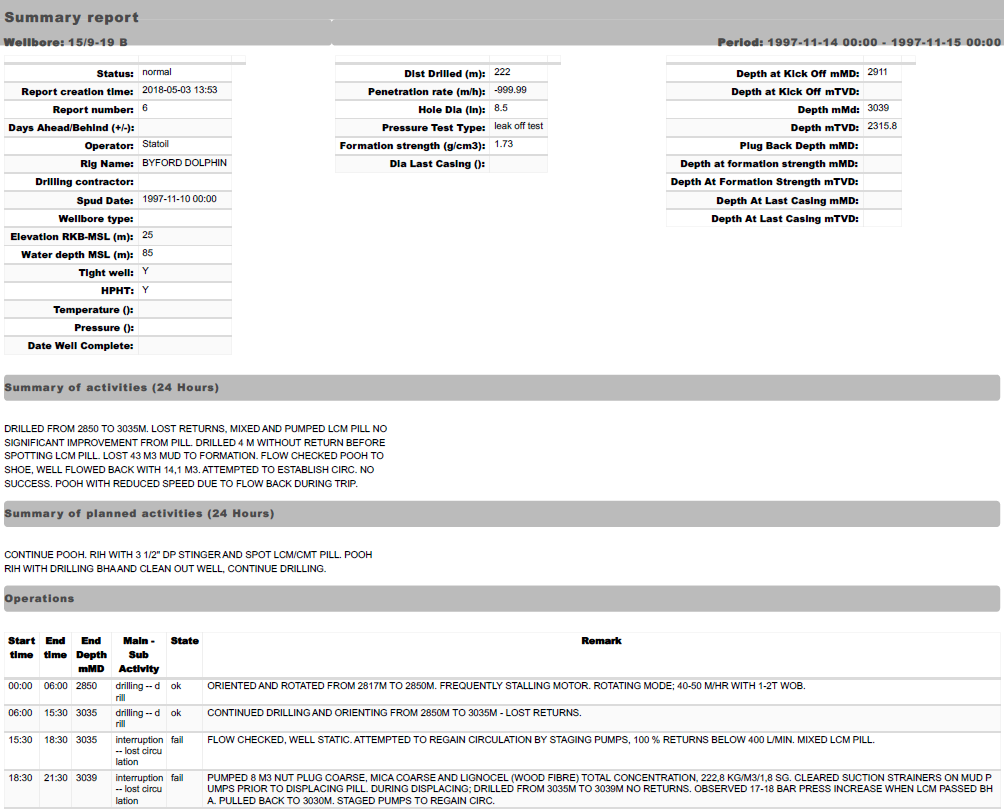
Figure 1. Sample of drilling & completion report structure (page 1)
Solution overview
The solution uses Amazon Textract—a machine learning (ML) service that automatically extracts text, handwriting, and data from scanned documents—to automate data extraction. It uses optical character recognition (OCR) and ML algorithms to identify and extract text, tables, and forms from documents such as drilling and completion reports. Amazon Textract can process millions of pages in just a few hours, making it an ideal solution for large-scale document processing. Using Amazon Textract within serverless architecture, this solution (figure 2) automates the extraction of data from rig reports at large scale, saving time and reducing errors. As shown in figure 2, the solution we built uses several AWS services in addition to Amazon Textract:
- Amazon Simple Storage Service (Amazon S3), object storage built to retrieve any amount of data from anywhere
- AWS Lambda, a serverless, event-driven compute service that lets you run code for virtually any type of application or backend service
- Amazon Simple Notification Service (Amazon SNS), a fully managed Pub/Sub service for A2A and A2P messaging
- Amazon DynamoDB, a fast, flexible NoSQL database service for single-digit millisecond performance at nearly any scale
- Amazon Athena, which provides a simplified, flexible way to analyze petabytes of data where it lives
- Amazon QuickSight, which powers data-driven organizations with unified business intelligence (BI) at hyperscale
- Amazon EventBridge, where developers can build event-driven applications at scale across AWS
- Amazon Simple Queue Service (Amazon SQS), a fully managed message queuing for microservices, distributed systems, and serverless applications
- AWS CloudFormation, which lets you model, provision, and manage AWS and third-party resources by treating infrastructure as code
To provide scalability to process large numbers of documents, the pipeline is designed to be easily scalable without requiring changes to the pipeline using an Amazon SQS queue and an AWS Lambda function, and it can handle a large volume of rig reports without downtime or delays. As the volume of reports increases, the pipeline automatically scales up to handle the load. Additionally, the extracted data is stored in a database, providing for easy and efficient data retrieval, visualization, and ML analysis.

Figure 2. Architecture diagram of the scalable solution to extract data from rig reports
Data-extraction pipeline
The pipeline starts with the scanned or digital drilling reports, which are in PDF format, being dropped into Amazon S3 buckets. Amazon S3 provides highly scalable, secure, and durable storage for these reports. As reports are created in Amazon S3 buckets, an Amazon SQS ingestion queue stores each file-creation event and invokes the processing pipeline using ingestion in AWS Lambda. Amazon SQS is a serverless queue-management system that allows for the decoupling of a process or a workflow. We can process reports in parallel, which helps us to achieve high throughput and reduce processing time. The incoming PDF document’s metadata (operator name, file name, creation time) is recorded into an Amazon DynamoDB table (bookkeeping table).
The rest of the processing pipeline can be divided into three stages: (1) preprocessing job, (2) Amazon Textract job, and (3) postprocessing job. At the preprocessing stage, the solution supports converting original PDF files using public libraries (such as PYPDF2) to enhance Amazon Textract results using preprocessing AWS Lambda. Next, TextractSubmission AWS Lambda is initiated by a file-creation event to submit the converted PDF file to Amazon Textract for processing. After Amazon Textract finishes its job, it writes raw output to an Amazon S3 process bucket and sends a completion message to an Amazon SNS topic, which initiates WorkflowSelector AWS Lambda. WorkflowSelector AWS Lambda selects appropriate postprocessing workflows based on operator names.
To facilitate this config, a JSON file maintains information about which workflow should be used for specific formats belonging to specific oil operators. Each postprocessing workflow automatically extracts information, including forms and tables, from the raw output of Amazon Textract and generates a JSON structure with a table, key-value (KV) pair, and raw text found in each page of the PDF reports. Postprocessing workflows also perform format-specific modifications to generate a JSON file so that it can be easily consumed by other applications and all business-critical data is extracted as a table and KV pair. After the report is processed and the JSON files are created, the extracted data is also stored in Amazon DynamoDB tables. Within Amazon DynamoDB, various tables are created that correspond to each section (such as time log and daily summary), found in the drilling and completion reports. Table names are identified from PDF reports or can be customized using table schema, such as header names. The table data and KV-pair data are stored in a structured format, making it easy to retrieve specific information and analyze and consume the data.
Scaling
The solution scales on two fronts: handling different types of rig reports and handling large batches of documents. To handle processing of rig reports belonging to various operators, configuration-based workflow selection is designed as explained above. To handle large batch ingestion, the Amazon SQS ingestion queue parameters and AWS Lambda parameters (concurrent invocation and queue batch size) are defined to decouple incoming file-ingestion rates and processing rates, thus avoiding throttling at the AWS Lambda or Amazon Textract level. The current pipeline has been successfully tested to ingest 50,000 PDF files in a single-batch ingestion test load.
Monitoring pipelines
All other AWS Lambda functions use bookkeeping Amazon DynamoDB tables as a central location to write appropriate information to monitor pipeline status. Each AWS Lambda function creates attributes that record the AWS Lambda function’s processing stage (start, finish, exception). Along with these, various postprocessing workflows write various other attributes as appropriate for each AWS Lambda function. This helps creating a mechanism to easily identify any unsuccessful PDF file, its storage location, and reason why it failed by looking at the reported exception within bookkeeping table. If needed, more context about failure-event logs can be used. Amazon QuickSight connects with the bookkeeping table and a dashboard provides status of the processing pipelines daily. In this manner, when PDF documents are processed at a large scale, users can keep track of processing status and perform troubleshooting quickly.
To automatically identify any processing pipeline failures, ProcessingStatus AWS Lambda function is set to run once a day at 7:00 p.m. CST using Amazon EventBridge and collects all files that were successfully processed and failed at any AWS Lambda function. All failed documents are stored in a failure-catalog bucket with appropriate folder prefixes indicating at what stage/workflow level they failed. The FileCount AWS Lambda function is set to keep counting the total number of failures and store that information as a JSON file in a failure-catalog bucket. Based on a certain threshold of failure count, an automated email notification can be sent (not deployed in the current solution) to the administrator, listing failed documents and exceptions.
Reprocessing pipelines
To minimize operational costs, and because documents can fail at any step in the processing pipeline for several reasons, a reprocessing pipeline has been built. One such scenario can be incoming PDF document formats deviating from the original format (for which a specific workflow was designed) and can fail to output the desired JSON format. In these cases, daily incoming files will be processed at the Amazon Textract level and failure will occur at the postprocessing level. In such situations, once the issue is fixed, one would like to reprocess this file. If we start a new ingestion process, all processing steps will get initiated along with rerunning the Amazon Textract job. This can lead to unwanted processing (such as an Amazon Textract job) and associated compute and storage costs. This will also lead to duplicate records in the Amazon DynamoDB tables. To rectify this, the current solution has built-in reprocess pipelines.
All the failed files are automatically stored in catalog buckets. Once a user wants to reprocess a failed file, the user can move files from the failure-catalog bucket to the reprocess bucket, and Reprocess AWS Lambda function will initiate only that part of the pipeline where this particular file failed in the previous attempt. Further, to reduce storage cost and avoid duplicate data in Amazon DynamoDB, the reprocess pipeline deletes all data entries created in the previous attempt. To achieve this functionality, we write keys for all records that are inserted into each table in Amazon S3 buckets. When the reprocess pipeline is initiated for a PDF file, it deletes all the previous keys found in the Amazon DynamoDB table for that file. This feature empowers users to control their operational cost in a situation where a large number of failures can happen and significant cost can be reduced, especially with drilling reports having several scores of pages (Amazon Textract charges per-page processing fees).
Solution deployment and Amazon QuickSight integration
The current solution’s AWS CloudFormation template facilitates Amazon QuickSight integration with Amazon DynamoDB tables using Amazon Athena DynamoDB connector. Amazon QuickSight is a modern data-visualization service for BI and is used to create interactive dashboards and natural-language queries. The instructions to create a dashboard using Amazon QuickSight analyses is provided in the solution artifacts, and readers can click here for additional details. In the next section, we will discuss how to derive insights from daily drilling reports using sample visualizations.
Insight from drilling reports
Within drilling and completion reports, we can find valuable information about daily rig operations. Using the current solution, we can ingest thousands of reports in less than an hour. The following are the selected sample analyses that are performed.
1. Field-level well-activity view
Visualization for various rig activities per well are shown in figure 3. This provides insight about which wells have higher durations (mins) for operation interruption known as nonproductive time (NPT). However, the absolute number for NPT can be misleading because the well with high hours of drilling can have high hours of interruptions. Therefore, we will use a chart for comparative analysis.

Figure 3. Well-activity duration per well per well-activity type (category)
2. Comparative analysis: comparing wells against the average field performance
Users can select the well of interest and compare various activities. For example, figure 4 compares the percentage of interruption time from total operation time for a selected well against the field-level average. Here, field-level average considers all the wells. This will provide insight about which set of wells has more NPT in operation compared to the rest of the wells. For example, field average for NPT and drilling time were 17 percent and 46 percent, and for Well F_4, NPT and drilling time were 22 percent and 51 percent of total operation time. This indicates that Well F_4 drilling operations can be suboptimal compared to the rest of the wells and needs further analysis.

Figure 4. Various rig operations distribution for Well F_4 (left) and average at field level (right)
In the next step, data analytics was performed to gain insight about what caused higher interruption (NPT) for Well F_4. Figure 5 shows various daily operations and their duration as a vertical-bar chart, and it shows Well F_4 had a lot of interruptions during the month of February 2008. By looking at figure 6, we can identify the interruptions that occurred in the month of February and root causes. These quick visualizations and data analytics can be used by oil and companies to make informed decisions for future wells to increase rig operations efficiency.
Further analysis that combines drilling parameters, operators’ comments, and other variables can be used to generate insights, such as what caused the NPT events and how the NPT events can be avoided. We aim to address those in a future blog.

Figure 5. Well F_4 rig-operation category as a vertical-bar chart for a selected period

Figure 6: Well F_4 rig-activity classes for interruption (NPT) for a selected period
Pipeline status
As explained earlier, as part of a monitoring pipeline, the solution maintains job quality control (QC) information in the bookkeeping Amazon DynamoDB table for the complete status of each processing job. Figure 6 shows an example of the dashboard visualization for the Amazon Textract job completion and postprocessing workflow status for a selected workflow. Similar visualization dashboards can be built for all postprocessing. The bookkeeping table update currently is set up once a day but can be designed to be performed every hour to reflect the status of each job, providing accurate and up-to-date information to the dashboard.

Figure 7. Example of a dashboard visualization of statistics of successful Amazon Textract jobs and pipeline completion
Business impact of solution
Benefits:
1. Time and effort savings: By automating the extraction of data from rig reports, the scalable processing solution using Amazon Textract significantly reduces the time and effort required to process these reports. This frees up resources for more important tasks, such as analyzing the data and making informed decisions.
2. Improved data accuracy: The manual process of data entry is prone to errors, which can lead to inaccurate data and potential safety hazards. By automating the extraction process with Amazon Textract, we eliminate human error, and the extracted data is accurate and consistent. This improves data quality and helps maintain drilling efficiency and safety.
3. Quick data access and analysis: With the scalable processing solution, the extracted data is stored in a database that can be easily queried and analyzed. This facilitates quick data access and visualization in dashboards for analysis, allowing drillers to make better-informed decisions. For example, they can quickly identify trends and patterns in the data and use that information to optimize drilling operations and improve safety.
4. Access to unstructured data: In addition to structured data, the scalable processing solution using Amazon Textract can also extract unstructured data from drilling reports, such as comments or notes. This helps data scientists build ML models with a more complete picture of the rig operations, allowing for better decision-making.
5. Scalability: The scalable processing solution can handle a large volume of rig reports without requiring manual intervention. This means that it can scale up or down depending on the volume of reports so that the solution remains cost effective and efficient.
Conclusion
The scalable drilling-report-processing solution using Amazon Textract is an effective way to automate the extraction of data from various rig reports such as drilling, completion, and workover reports. The solution has the potential to transform the way rig reports are processed in the oil and gas industry. It has several benefits for the oil and gas industry, including improved data accuracy, quick data access and analysis, and the ability to access unstructured data. Additionally, the solution is cost effective and scalable, making it an ideal solution for processing large volumes of rig reports, and it provides a more complete picture of rig operations, facilitating better-informed decision-making using ML. In an upcoming blog #2 and #3, the authors will describe how to use extracted data for ML and generative AI use cases and provide deeper insights into rig operations.