AWS for M&E Blog
Crunching the numbers with Next Gen Stats: Unveiling the impact of defensive pressure in the NFL
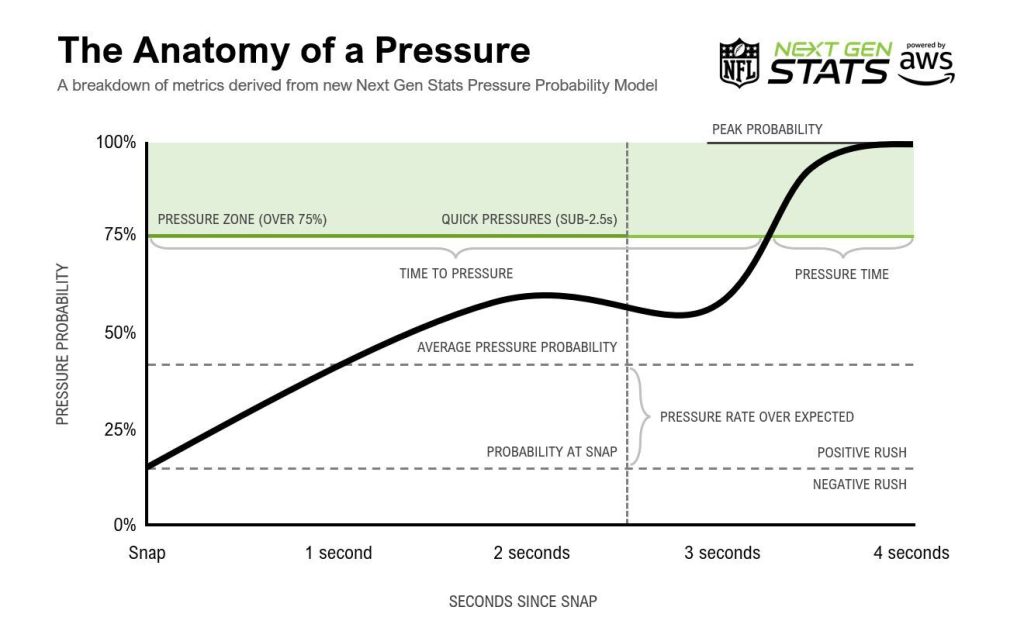
Pressure Probability introduces a dynamic measure of pressure magnitude in the NFL, capturing factors such as distance from the quarterback, speed, and the quarterback’s movement. The result? A numerical representation of how much duress a quarterback faces over time on each play.
Football is a game of strategy, athleticism, and split-second decisions. The rush of anticipation in every play, the skillful execution of plays, and the exhilarating moments of triumph and defeat create an immersive experience for fans and players alike. The landscape of sports statistics has evolved over the years, transitioning from the basic box scores to more advanced metrics that provide a deeper understanding of player performance and game dynamics. With the advent of Next Gen Stats and data analytics, football analysts and enthusiasts are now equipped with tools to analyze the game in unprecedented detail. Enter “pressure probability,” a new AI-powered stat that changes how we evaluate pass rushers and offensive linemen.
We sat with the NFL’s Next Gen Stats team to uncover the significance of this stat, look under the hood at how Amazon Web Services (AWS) helped build it, and how we can expect to see it when we’re watching National Football League (NFL) games on TV.
The story begins with an age-old challenge: evaluating the performance of offensive linemen. In the past, evaluating the performance of offensive linemen was a challenging task due to the lack of nuanced metrics available. Traditional box scores could only tell you how many times a quarterback was sacked, but they could not provide insights into how much pressure a pass rusher was generating or how well an offensive lineman was holding up against the pressure on a play-by-play basis. Recognizing this limitation, AWS and Next Gen Stats set out to build a new, multi-dimensional view of pass rush scenarios.
The driving force behind pressure probability lies in its ability to provide a dynamic measurement of the magnitude of pressure on a play. Unlike traditional stats that only note whether a pass rusher succeeded in sacking the quarterback, pressure probability delves into the details: how close the defender got, how fast they were moving, and even how quickly the quarterback responded. With this granular data powered by Next Gen Stat player-tracking data, the stat not only quantifies pressure but also captures the context, allowing analysts to dissect the strategies that influence each play.
Keegan Abdoo, from Next Gen Stats (NGS), explains the genesis of pressure probability: “We had pressure as a stat, but it was a binary metric. Our old logic could only tell us how close the pass rusher got to the quarterback. What we were missing was the ability to quantify how pressure evolves over the course of a pass play.” The need to capture a more nuanced picture of pressure prompted the NGS team to collaborate with the AWS Machine Learning Solutions Lab (MLSL), a partnership that would redefine the very essence of pressure analysis.
But how does pressure probability work its magic? Mike Band of Next Gen Stats breaks it down: “We’re taking player-tracking data, and for every split-second on every play, we can now quantify how well a pass rusher gets to the quarterback—not just to create sacks, but also hits and hurries.” This depth extends to offensive linemen too, allowing teams to evaluate their performance based on the magnitude of pressure they allow. As Keegan Abdoo emphasizes, “We’re going beyond the box score to tell deeper stories with new stats that hit on position groups and areas of the game that have limited stats to begin with.”
For football aficionados, the significance of this breakthrough is palpable. It’s all about enabling analysts and fans to dive into the nitty-gritty of the game’s strategy, dissecting individual matchups within the larger context. As Mike Band notes, “This opens the game up for fascinating new insights. You can know which pass rushers had the longest pressure, how quickly they’re getting pressure, how many times someone was double-teamed, or how certain rushers fared against certain offensive linemen.”

In this highlight from week 1 of the 2023 NFL season, defensive end Myles Garrett of the Cleveland Browns fights through a double team before sacking quarterback Joe Burrow of the Cincinnati Bengals. Garrett starts this play with a 30.4% pressure probability at snap, his 2nd-highest of the season, thanks to his Wide-9 alignment. He uses his burst to cross the line of scrimmage in 0.41 seconds, his 2nd-fastest get-off of the season, and powers through a double team to put Burrow under pressure for 2.9 seconds before bringing him down for a sack. Garrett’s 2.9 second pressure time is his longest since week 7 of last season.
However, the journey from idea to implementation wasn’t without its challenges. The core obstacle was achieving the level of accuracy demanded by the NFL. As Conor McQuiston of Next Gen Stats puts it, “For the NFL, we need to be right every single time.” The unbalanced nature of football data further complicated matters. Conor explains, “Dealing with unbalanced data, like offensive linemen blocking on every play while pass rushers are more selective, required us to dig deeper and filter accuracy measurements for specific situations to fully validate the outputs of our new models.”
Enter the AWS Machine Learning Solutions Lab. Leveraging its expertise in machine learning, the group meticulously calibrated models to achieve that crucial accuracy threshold. The journey involved several iterations, testing different model architectures and incorporating football knowledge to optimize the features driving predictions. “Through our partnership with AWS, we’ve been able to bridge the gap between traditional football knowledge and cutting-edge technology,” says Mike Band, underlining the seamless integration of football expertise and machine learning techniques. But this isn’t just about crunching numbers—it’s about adding strategic layers to game narratives.
The implications of pressure probability extend far beyond the realms of statistics. Coaches, broadcasters, and analysts now have the tools to uncover untold stories hidden within the game’s dynamics. It’s about spotlighting the matchups, unveiling the strategic maneuvers, and allowing fans to appreciate the intricacies of each play. As Keegan Abdoo aptly sums it up, “We’re expanding our toolset in so many different ways.”
In the world of sports analytics, pressure probability is poised to rewrite the playbook, transforming the way we dissect and appreciate the efforts of linemen and pass rushers alike. As this innovative stat takes center stage, it’s not just the numbers that are changing—it’s the narrative of football strategy itself.