AWS Messaging Blog
Improving email deliverability with new virtual deliverability manager features
Background:
Email deliverability is a critical aspect of email as it directly impacts the success of campaigns by ensuring that messages reach the intended recipients’ inboxes. It encompasses factors like avoiding spam filters, maximizing open rates, and minimizing bounces. Companies often encounter deliverability problems due to various reasons, such as poor sender reputation, inadequate list hygiene, incorrect authentication, or engaging in spam-like behavior. Managing these problems can be challenging for companies because existing tools and techniques often fall short in addressing the ever-evolving email ecosystem. Factors such as evolving spam filters, complex email client algorithms, and constantly changing best practices necessitate continuous monitoring, optimization, and fine-tuning of email marketing strategies. Companies struggle to keep pace with these dynamic challenges and require advanced tools and expertise to effectively navigate deliverability obstacles.
Virtual deliverability manager (VDM) is an Amazon SES feature that helps you enhance email deliverability, like increasing inbox deliverability and email conversions, by providing insights into your sending and delivery data, and giving advice on how to fix the issues that are negatively affecting your delivery success rate and reputation. Virtual deliverability manager offers three components to help customers increase their email deliverability rates: deliverability insights, optimization recommendations, and detailed dashboards.
Visit this blog for details on the initial launch of virtual deliverability manager. After listening to our customers, we have added new features to virtual deliverability manager that this blog will address.
Graph & time view:
VDM now features a graph and time based view. The improvements in monitoring and diagnosing issues include the ability to view the data in graph form and with a timeline.

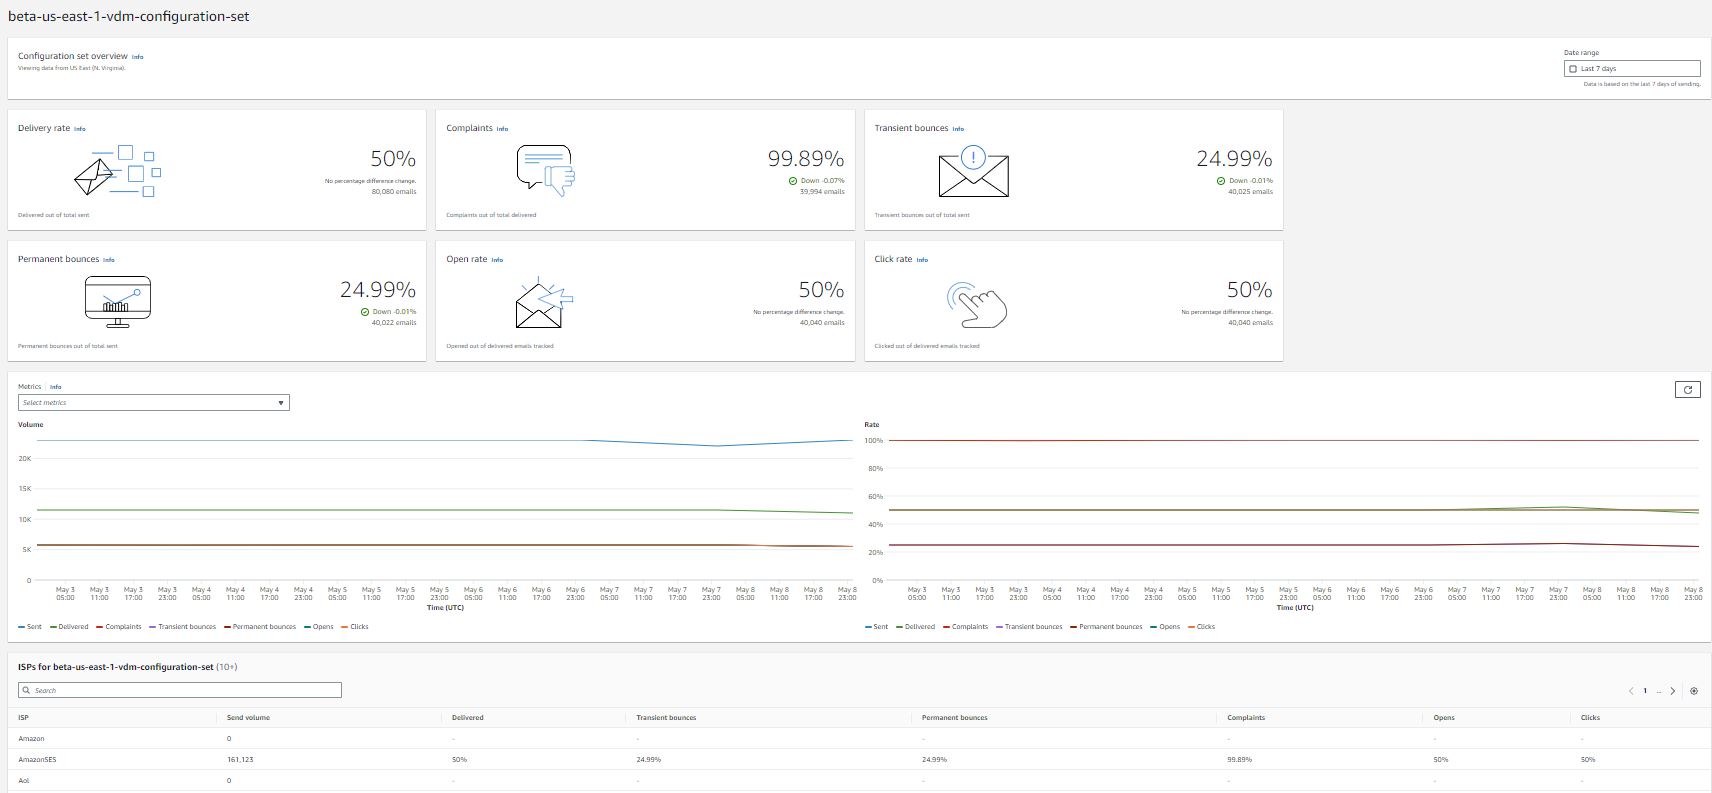
The new metrics pane displays VDM metrics as time series graphs with Volume progression on the left and Rate progression on the right. Hovering over a date interval in the graphs will show the exact volume count or rate percentage based on a daily aggregation. You can use the ‘select metrics’ dropdown menu to filter and choose the metrics you want to view.

Use case:
A time series graph displaying volume progression and rate progression can provide valuable insights to improve email deliverability for customers. Let’s consider a specific use case to illustrate this:
Use Case: Monitoring Engagement Metrics for Email Deliverability
Scenario: A business wants to enhance their email deliverability and ensure that their messages reach their subscribers’ inboxes. They are experiencing issues with low open rates and high spam complaints. To address these challenges, they decide to use a time series graph with volume progression and rate progression.
Implementation:
Volume Progression: By tracking the volume of emails sent over time, the business can observe any significant changes or spikes. A sudden increase in email volume might indicate a new marketing campaign or a change in email practices. Monitoring volume helps identify potential issues or anomalies that could impact deliverability. It allows businesses to correlate changes in volume with engagement metrics.
Rate Progression: Rate progression refers to tracking various engagement metrics over time, such as open rates, click-through rates, and unsubscribe rates. By analyzing these rates alongside email volume, the business can identify patterns or trends. For instance, a sudden drop in open rates may suggest that emails are landing in spam folders or being ignored by recipients. Conversely, a gradual increase in engagement rates indicates that emails are resonating with subscribers and likely to be delivered to their inboxes.
Benefits:
Early Detection of Issues: With a time series graph, businesses can detect delivery issues promptly. If a sudden drop in open rates or an increase in spam complaints is observed alongside a spike in email volume, it could indicate that the emails are being marked as spam or sent to the promotions tab. Identifying such issues early allows the business to take corrective measures, such as adjusting email content, optimizing subject lines, or reviewing their sender reputation.
Data-Driven Decision Making: By analyzing volume progression and rate progression, businesses gain valuable data to make informed decisions. They can assess the impact of changes in email strategies, content, or sending practices on deliverability. For instance, if a change in email design correlates with a decrease in open rates, the business can revert to a previous design or experiment with variations to optimize engagement.
Proactive Monitoring: By regularly monitoring volume and engagement metrics, businesses can proactively address potential deliverability issues. They can identify trends and take corrective action before they escalate. It enables businesses to maintain a positive sender reputation, improve email engagement, and optimize deliverability over time.
BIMI check in VDM Advisor:
Brand indicators for Message Identification (BIMI) is an email specification that enables email inboxes to display a brand’s logo next to the brand’s authenticated email messages within supported email clients. BIMI is an email specification that’s directly connected to authentication, but it’s not a standalone email authentication protocol as it requires all your email to comply with DMARC authentication.
While BIMI requires DMARC, DMARC requires your domain to have either SPF or DKIM records to align, however, it should be noted that both SPF and DKIM are recommended for best practice. Some email service providers (ESPs) require both when using BIMI. VDM’s Advisor now will let users know if BIMI records are not found or are not configured properly.

Breakdown by accounts, ISP, sending identity or config set:
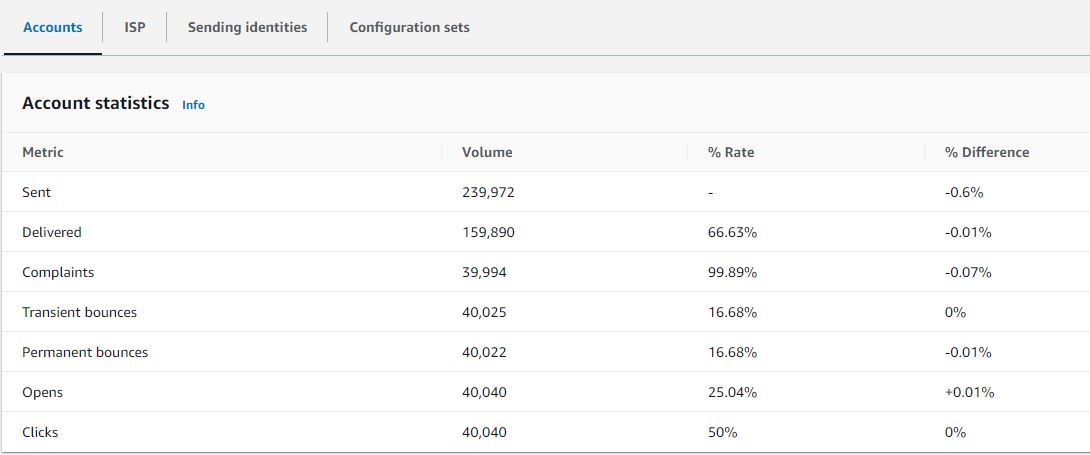
Accounts: The VDM Account statistics table gives an overview of your deliverability and reputation metrics showing the total volume, rate percentage, and difference percentage for permanent/transient bounces, complaints, opens, clicks, sends, and delivered email.
ISP: You can now get these metrics by accounts, Internet Service Providers (ISP), sending identities and configuration sets. ISP specific data is important when you have a deliverability issue to a specific ISP or mailbox provider. Instead of trying to adjust your entire account which may otherwise be doing well, you can focus on the problematic endpoint and align with its best practices to improve sender reputation to that ISP and restore good inbox deliverability in order to reach your recipients.
Sending identities: Sending identity table shows the deliverability metrics like send volume, delivered, bounces (transient & permanent), complaints, opens & clicks, broken down by each sending identity.
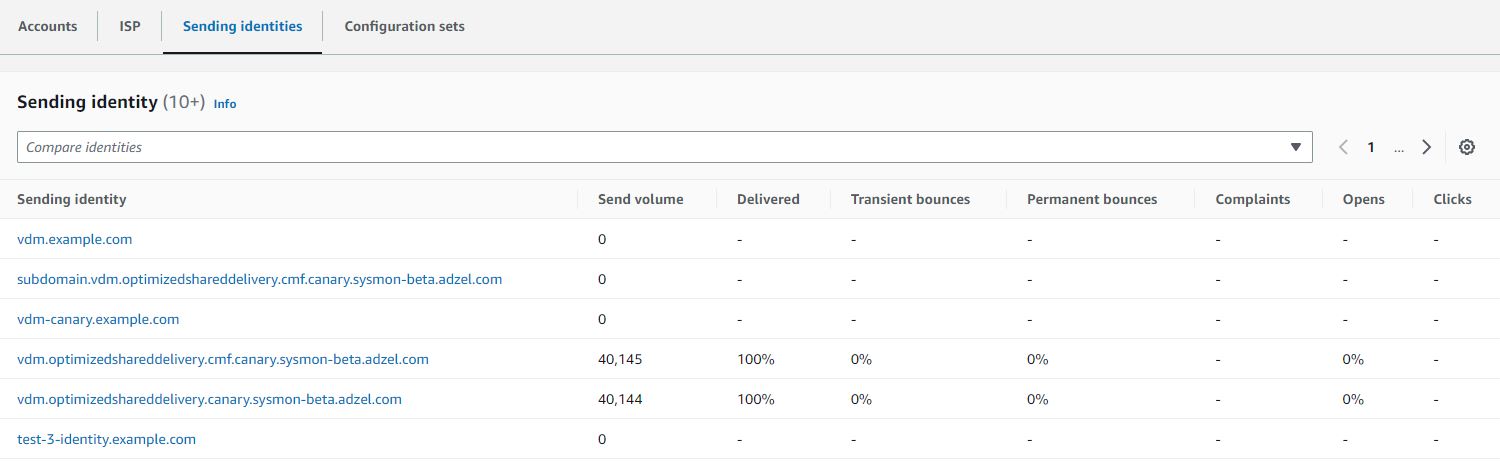
When you can click on the sending identity, graphic cards will appear for the deliverability metrics and an ISP table will be displayed listing all the ISPs the sending identity sent mail to with bounce/complaint, open/click, and send/delivery rates given for each ISP within the date range entered.

Configuration sets: The Configuration sets table displays deliver rates for each configuration set that’s been used to send mail for the date range entered in the account overview panel. To get specific configuration set details, you can click on any configuration set to see its graphics card with deliverability details pertaining to that configuration set. The corresponding ISP table will be displayed listing all the ISPs the configuration set was used to send mail to with bounce/complaint, open/click, and send/delivery rates given for each ISP within the date range entered.
Conclusion:
By adding VDM to Amazon SES, now customers can gather greater insight into their deliverability through more granular deliverability metric aggregations, automated detection of deliverability configuration problems (with resolution instructions), and optimization of sending through high reputation channels.
About the author:

Vinay Ujjini is an Amazon Pinpoint and Amazon Simple Email Service Worldwide Principal Specialist Solutions Architect at AWS. He has been solving customer’s omni-channel challenges for over 15 years. He is an avid sports enthusiast and in his spare time, enjoys playing tennis & cricket.