Microsoft Workloads on AWS
Instrumenting .NET applications with AWS X-Ray using Aspect-oriented Programming
Aspect-oriented programming (AOP) is an approach that enhances modularity by allowing developers to pull out cross-cutting concerns. AOP does so by adding attribute (advice) to the existing code without modifying the code itself. Classic examples of these cross-cutting concerns include caching, logging, monitoring, and, in our case, AWS X-Ray tracing.
With AOP, tracing a call into a method would not require adding tracing statements to your code. You decorate the method with an AOP attribute. Based upon this attribute, AOP generates another set of code, which performs tracing for you when the original code is called.
There are coding languages and frameworks that directly support AOP. However, C# and many other languages do not directly support AOP. Implementing AOP for .Net C# applications will require a third-party library that adds the required functionality. One such library is PostSharp. PostSharp is a licensed product, but it also has a free Community Edition.
In this blog I will showcase how to automate X-Ray provisioning for .Net Core applications to trace internal operations. I will use community addition of PostSharp to implement AOP aspects for X-Ray APIs.
AWS X-Ray
AWS X-Ray helps developers analyze and debug distributed applications such as those built using a microservices architecture. X-Ray traces user requests as they travel through your entire application, allowing you to glean insights into how your application is performing and discover root causes of many problems.
To demonstrate features of X-Ray, I created a sample AWS Lambda application, which emulates financial advice generator. This application uses Amazon Translate to provide advice in the language of your choice. Using Amazon Polly, it converts advice text to speech. Sound file representing speech is delivered to the browser through Amazon S3.
Enabling AWS X-Ray for this application in the default configuration without any special provisioning in the application code will produce the following map illustrating AWS services invoked by the application:
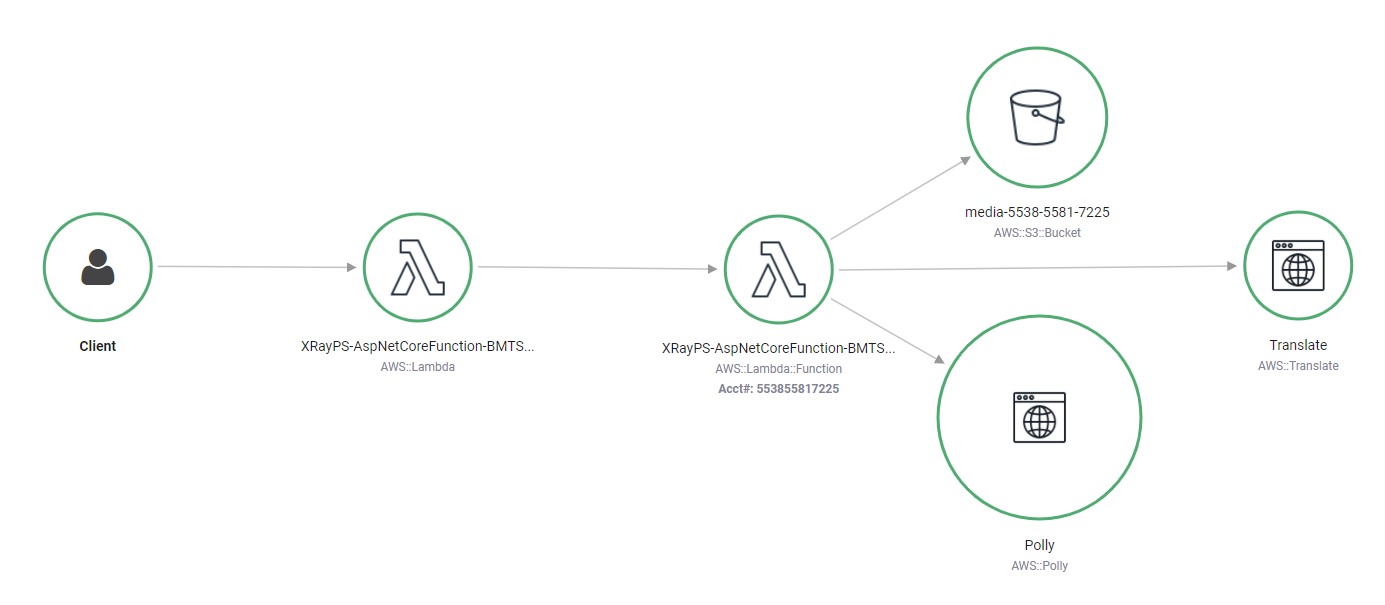
Figure 1. AWS X-Ray Application Map.
Application map on Figure 1 captures our Lambda function and AWS services that this Lambda function invokes. AWS X-Ray also captures traces of the Lambda function execution presented on Figure 2. These traces capture transitions between our function and other AWS services that this Lambda invokes. On the trace chart, you may see all individual calls to AWS services and how much time each call took.
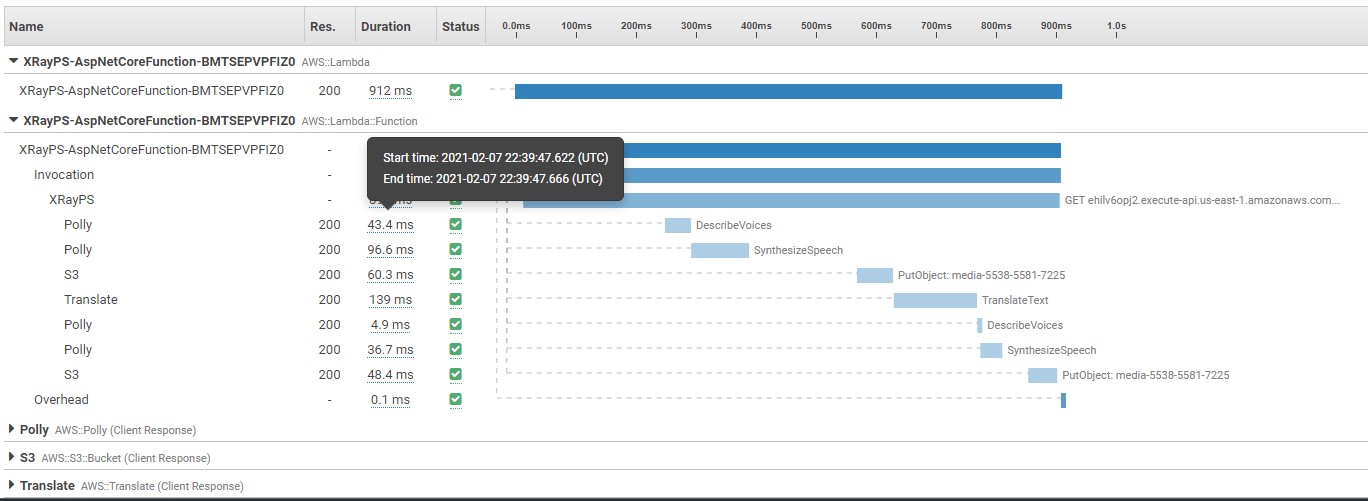
Figure 2. AWS X-Ray Lambda execution traces.
Instrumenting application to trace internal calls
By default, AWS X-Ray allows us to track integration of our service with other AWS services. Additional tools simplify adding tracing of various integration points for our application – calls to other web services and applications, Entity Framework, and SQL Client calls to database.
However, neither of these approaches provides details on what is happening INSIDE your application, how long internal functions take, which specific functions initiate calls to external services, etc.
AWS X-Ray API provides mechanism to expose internal working of the application by wrapping calls to functions and methods of interest with:
AWSXRayRecorder.Instance.BeginSubsegment(“Segment-Name”)
<some call>
AWSXRayRecorder.Instance.EndSubsegment();
Going over your code and inserting these statements is rather cumbersome. You would also have to keep track of segment names and modify them accordingly if you rename some function or method to keep them in sync as you are modifying and/or optimizing your application. This approach would also present some challenges if the function you are tracing is, for example, recursive. Finally, when you are done with tracing and optimizing your application you would have to sift through the code and remove tracing statements.
Using AOP to instrument application for AWS X-Ray
Automating repetitive code changes like wrapping every call to a method or function with calls to AWS X-Ray APIs is exactly the role of AOP aspects. To automate tracing of my application, I created a simple XRayTracerAspect aspect class using PostSharp:
[MulticastAttributeUsage(MulticastTargets.Method,
                         TargetMemberAttributes = MulticastAttributes.Instance)]
	[AttributeUsage(AttributeTargets.Assembly |
                    AttributeTargets.Class |
                    AttributeTargets.Method, AllowMultiple = true)]
	[PSerializable]
	public class XRayTracerAspect : OnMethodBoundaryAspect
		{
       public override void OnEntry(MethodExecutionArgs args)
			{
#if DEBUG
			Console.WriteLine ($"Method <{args.Method.Name}> Started at {DateTime.Now:HH:mm:ss.fff}");
#else
	   		AWSXRayRecorder.Instance.BeginSubsegment(args.Method.Name);
#endif
			}

	public override void OnExit(MethodExecutionArgs args)
		{
#if DEBUG
		Console.WriteLine($"Method <{args.Method.Name}> Terminated at {DateTime.Now:HH:mm:ss.fff}");
#else
		AWSXRayRecorder.Instance.EndSubsegment();
#endif
		}

	public override void OnException(MethodExecutionArgs args)
		{
#if DEBUG
       Console.WriteLine($"Method <{args.Method.Name}> raised exception: <{args.Exception.Message}");
#else
		AWSXRayRecorder.Instance.AddException(args.Exception);
#endif
		}
	}
#endif
The XRayTracerAspect class defines an aspect attribute, which gets invoked on the boundary of the respective methods (MulticastTargets.Method) and ignores static members if applied to the class (TargetMemberAttributes =MulticastAttributes.Instance). This attribute can be applied to assembly, class, and individual method: AttributeUsage(AttributeTargets.Assembly |AttributeTargets.Class |AttributeTargets.Method,AllowMultiple = true). If applied to assembly or class, it will affect all methods in the assembly or class respectively.
On the entry into affected method, the code defined in OnEntry(…) method of the aspect class will be executed. Similarly, OnExit(…) method will be invoked upon exit of the respective method. If an exception raised in the method and was not processed, the OnException(…) method of the aspect will be invoked.
If we run DEBUG version of the application, start and stop time of each affected module will be printed to the console. Production code will generate AWS X-Ray trace record. To quickly enable or disable X-Ray tracing, I added compile-time variable XRAY to my project configuration.
With this aspect added to the project, enabling AWS X-Ray tracing for internal methods becomes trivial – you just apply XRayTracerAspect attribute to a class or individual method. To save effort, I applied this attribute to the whole class, so it will be propagated to all instance methods of the class:
#if XRAY
	[XRayTracerAspect]
#endif
	public partial class Processor
		{…
Detailed tracing of the Application
When I run my application with the aspect attribute applied to the class, I get detailed trace of my code. This trace identifies execution time of my methods together with external calls to AWS services that these methods may invoke. AWS X-Ray console view of this trace demonstrated on Figure 3. I highlighted on Figure 3 new traces corresponding to the calls to internal methods of my application.

Figure 3. Detailed AWS X-Ray trace map.My application has another class, Analyst, which actually generates the advice using some recursive algorithm. Applying XRayTracerAspect attribute to this class properly unwinds execution chain of the recursive method ProcessIndicators(…) of the Analyst class. Respective trace is presented on Figure 4; traces for the recursive calls highlighted with the red outline.
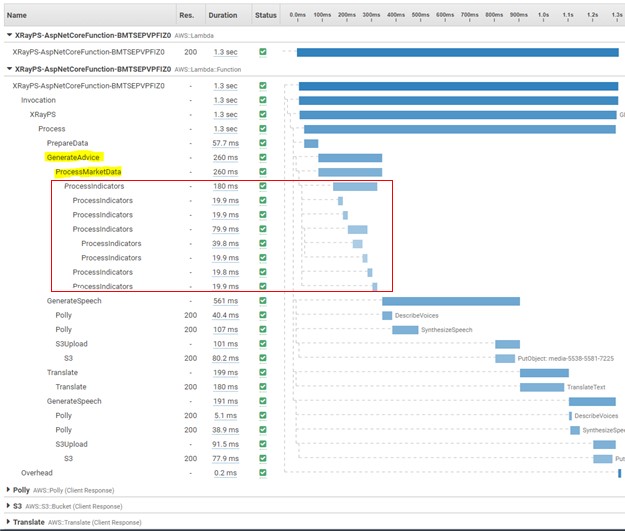
Figure 4. Tracing ProcessIndicators recursion.
Conclusion
Using AOP technique outlined in this blog, you may easily instrument your application for X-Ray. It can be applied whether your application is deployed on AWS Elastic Beanstalk, on one of the AWS Container Services or as a serverless application on AWS Lambda. Tracing internal calls can be especially useful if application provides implementation of some API or encompasses complicated business logic. Capturing execution statistics for internal calls could help to identify bottlenecks in the application, concurrency issues, or point developers to code sections that require optimization.
AWS can help you assess how your company can get the most out of cloud. Join the millions of AWS customers that trust us to migrate and modernize their most important applications in the cloud. To learn more on modernizing Windows Server or SQL Server, visit Windows on AWS. Contact us to start your migration journey today.