Microsoft Workloads on AWS
Monitor Microsoft SharePoint Server using Amazon CloudWatch Application Insights
Introduction
In this blog post, I will demonstrate how to configure Amazon CloudWatch Application Insights for a Microsoft SharePoint farm.
Management and governance are important aspects of any workload, whether it is running on-premises or in the AWS Cloud. In this context, management refers to performing defined actions, either automated or manual, to make sure the workload continues to run optimally. Governance means making sure the workload is operating under guidelines defined for it, typically through monitoring. There are many aspects of monitoring a given workload including security, cost, availability, and performance.
When it comes to monitoring performance, it is not always a straightforward process to determine what to monitor. In a multi-tiered workload, the overall application performance is dependent on metrics from distributed machines, which requires more than monitoring of just common server metrics like CPU, memory, network usage, and storage input-output-per-second (IOPS). Providing an end-to-end view of how each constituent element in the application is performing can be a challenging task.
Amazon CloudWatch Application Insights is a service that helps monitor and troubleshoot enterprise applications running on AWS resources. Application Insights is powered by Amazon SageMaker, the AWS machine learning service to provide automated dashboards that show potential problems with monitored applications to quickly isolate ongoing issues with your workloads. With support for Active Directory (AD) and SharePoint, customers have a simple path for setting up monitoring for these workloads.
With AD monitoring, Application Insights monitors over a dozen important performance counter metrics for domain controller utilization such as CPU and Memory and AD specific metrics such as LDAP searches, binds and DNS queries. For SharePoint, Application Insights watches Health Analyzer and Timer Jobs in the Windows event logs along with other key Unified Logging System (ULS) and Internet Information Services (IIS) log events and metrics. Based on the insights provided by these metrics, you can decide to deploy or remove additional domain controllers, modify the Amazon Elastic Compute Cloud (Amazon EC2) instance type running the service or help determine the root cause of issues.
Solution overview
For this solution, I have a simplified SharePoint deployment on AWS (Figure 1):
- Two AD domain controllers.
- One SharePoint server configured as a single-server farm.
- One Microsoft SQL Server holding all SharePoint data and configuration.
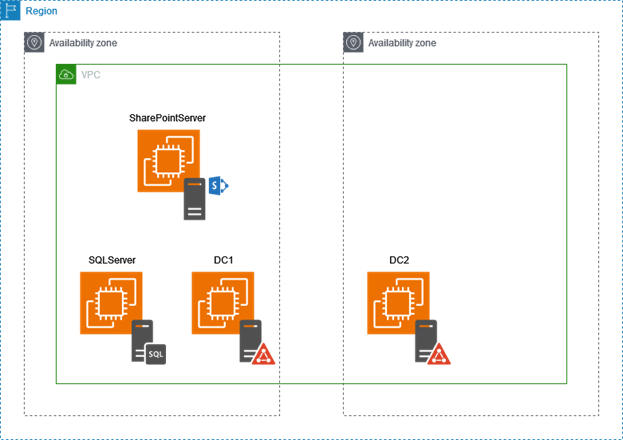
Figure 1: Simple SharePoint Farm on AWS
Prerequisites:
Configuring an application with CloudWatch Application Insights requires a number of prerequisites:
- AWS Systems Manager enablement: AWS Systems Manager (Systems Manager) agent by default is installed on an Amazon provided Amazon Machine Images (AMIs). If you are bringing your own images to AWS, install the Systems Manager agent on the image or instances.
- IAM permissions and Service-linked role: An Identity and Access Management (IAM) Role) that has the AdministratorAccess policy attached to it in order to create service-linked roles. To honor the security principle of least-privilege, attach the proper IAM policy for non-admin AWS users or roles that need to set up monitoring.
- Performance Counter metrics support for EC2 Windows instances: Installing AD, SQL Server, and SharePoint components on each Amazon EC2 instance will also install the relevant performance metrics.
- Amazon CloudWatch agent: Application Insights installs and configures the CloudWatch agent.
Both Systems Manager and CloudWatch agents installed on the Amazon EC2 instance will inherit the permissions of the EC2 Instance Profile attached to the instance in order to call AWS APIs. We need to verify that our instances have a correct profile attached to them.
Instance profile:
To check the instance profile of an Amazon EC2 instance go to the Amazon EC2 service page in the console, select: Instances on the left menu, select the instance, select the Security tab at the bottom of the page and check the IAM role assigned to the instance. If there is none, then assign one to the instances. If there is an IAM role assigned, verify the proper polices are attached to the role from the IAM console (Figures 2 and 3).
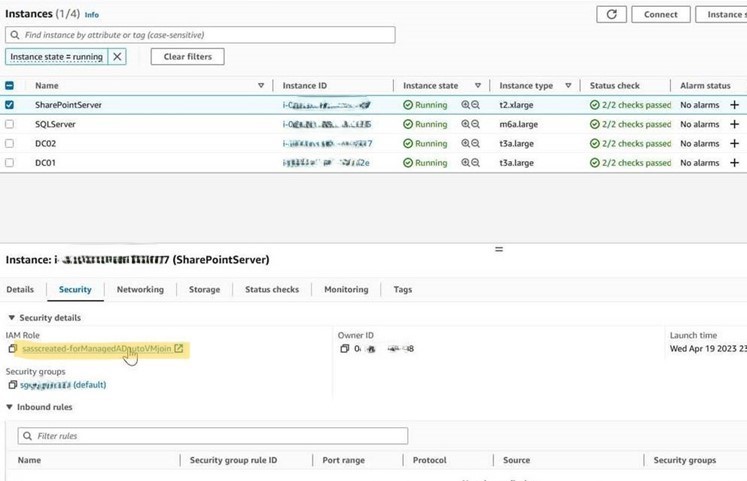
Figure 2: Verifying the assigned Instance profile to an EC2 instance.
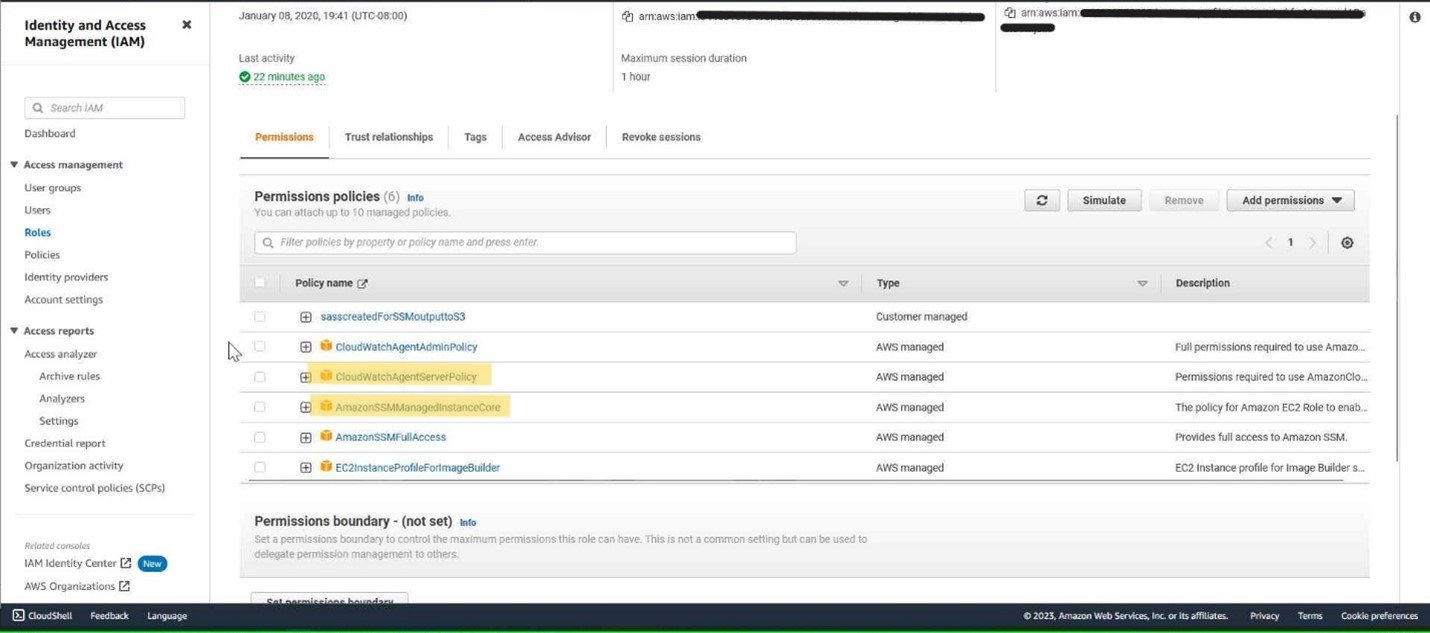
Figure 3: Policies attached to the Instance profile.
This IAM role does have proper policies attached to it. If the required policies are not attached to the role, add CloudWatchAgentServerPolicy and AmazonSSMManagedInstanceCore Amazon managed policies to it.
AWS resource group
Next, create a Resource Group for all SharePoint related instances. This will be needed later when using the Application Insight wizard.
Tagging
Make sure your resources are properly tagged. You can use any key and value pair you want for tagging, just make sure tags are consistent across all relevant instances. I use the tag key InstancePurpose and a value of SharePointonAWS on all relevant instances (Figures 4 and 5).
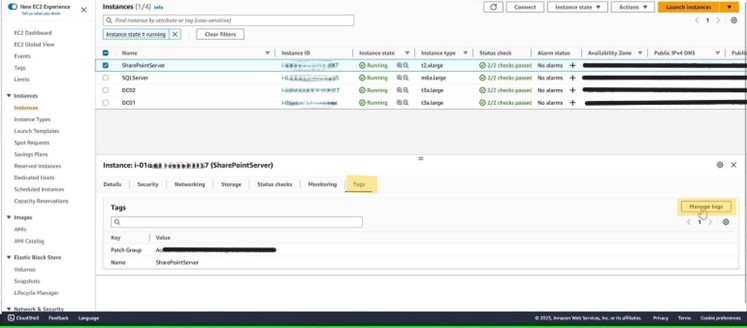
Figure 4: Tags on an EC2 instance
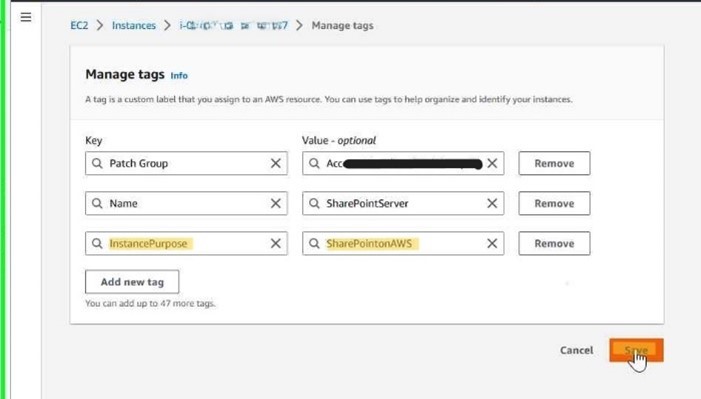
Figure 5: Adding new tag on an EC2 instance.
Defining the resource group
After tagging, go to the Resource Group and Tag Editor service in the console. Then choose Create a Resource Group (Figure 6).
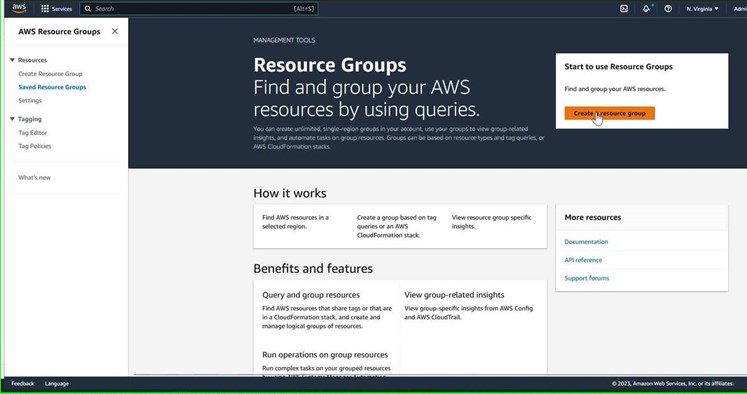
Figure 6: Resource Group front page
In the resource group creation wizard you are given the option of grouping resources based common tags or being part of the same CloudFormation template. In this scenario, resources share the same tag (Figure 7). Next, there is an option to cover all services supported by the Resource Group service or focus on a subset of services. In this example I have only tagged EC2 instances, but you should tag any other resources involved in your SharePoint deployment such as load balancers, Elastic Block Storage (EBS) volumes, and networking related services. Proper tagging of your resources is essential to an efficient cloud management practice.
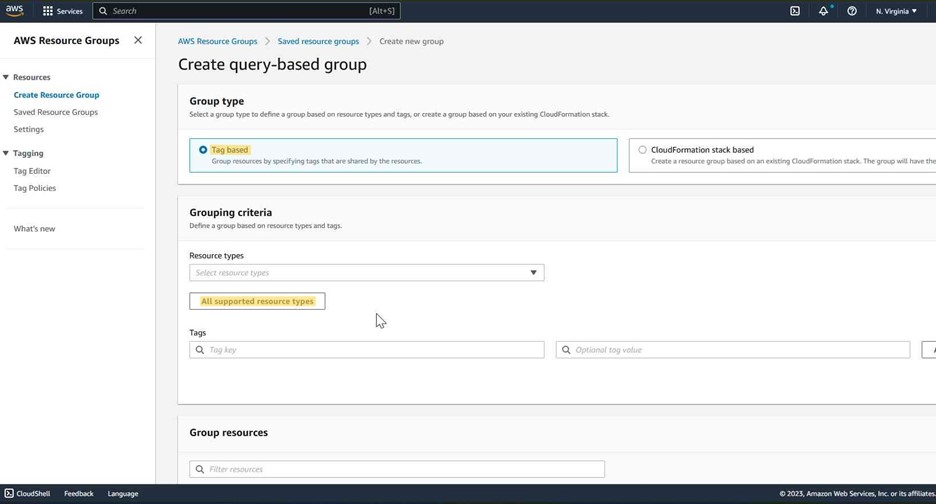
Figure 7: Query and resource type selection
I chose the tag I created before as the criteria for this Resource Group and selected the Preview Group Resources button. All instances should be returned as the result of the query. Note that both the Tags and Value edit boxes are searchable with the auto complete feature (Figures 8 and 9).
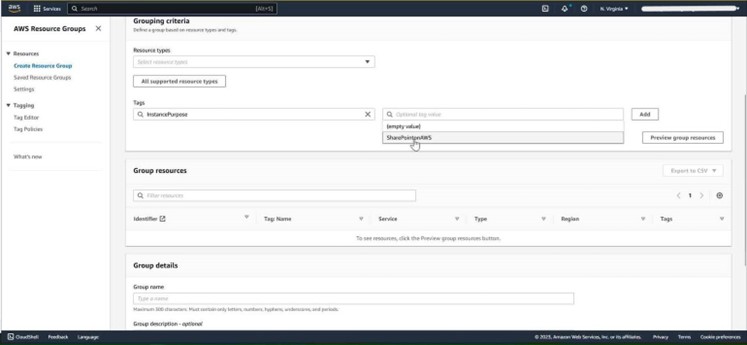
Figure 8: Choosing Tags and values.
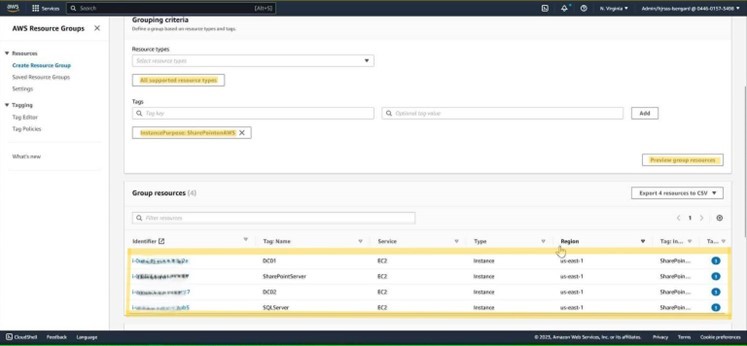
Figure 9: Preview results
Next give this Resource Group a name and select: Create. The next steps to perform are the actual Application Insights configuration (Figure 10).
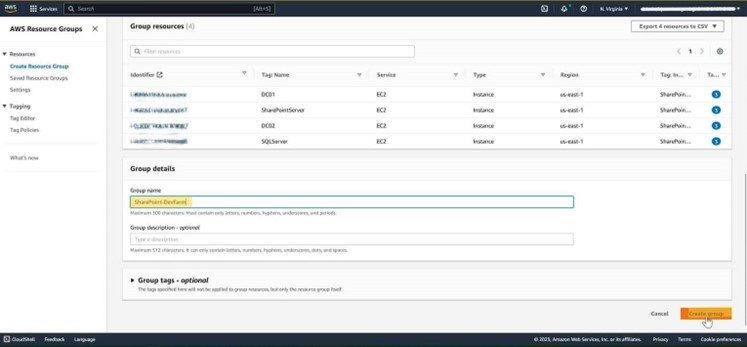
Figure 10: Naming and creating the Resource Group
Configuring Application Insights
To access the Application Insights feature of the Amazon CloudWatch service, type: Application Insights in the service search box and choose the feature under CloudWatch (Figure 11).
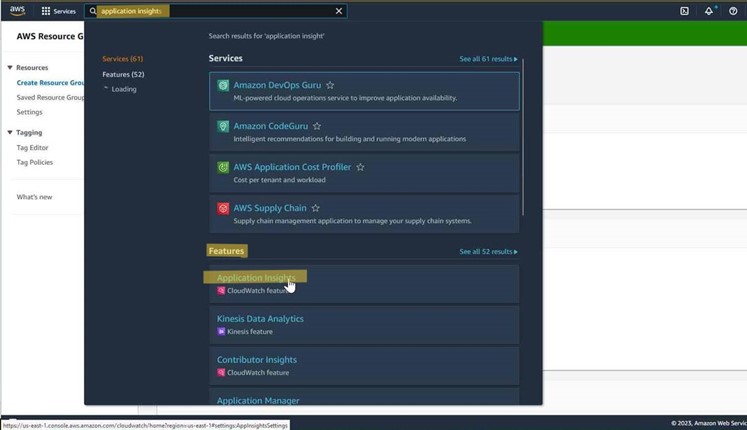
Figure 11: Finding Application Insights
Within the Application Insights console inside CloudWatch, there is a summary of the assets being monitored. Select the Add an application button to start the wizard (Figure 12):
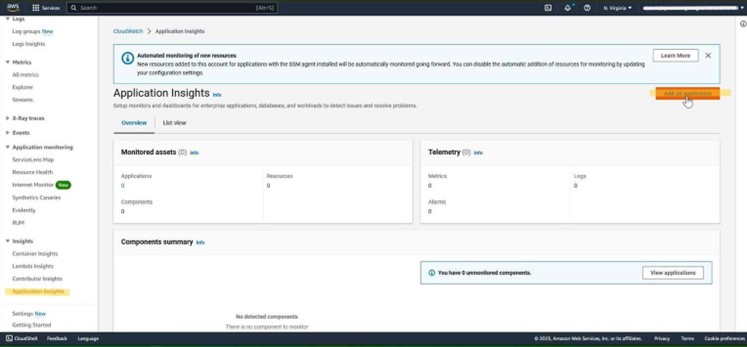
Figure 12: Applications monitored.
Choose whether you are creating an Insights which is account-based or resource group-based. For this scenario, choose the resource group-based option and select: Create (Figure 13):
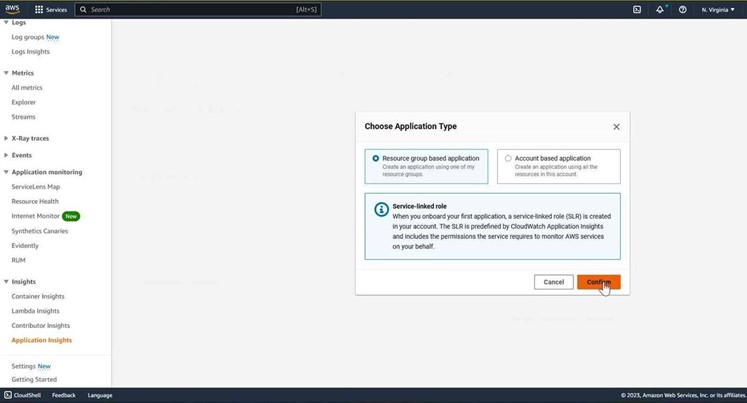
Figure 13: Choosing application type.
Pick the resource group created earlier, leave all other options as default and select: Next (Figure 14).
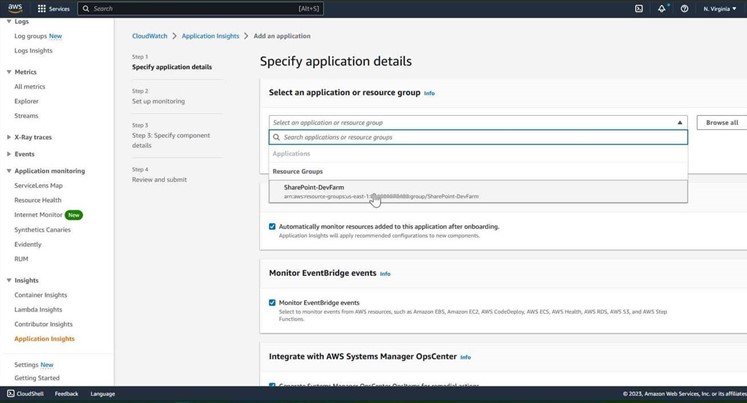
Figure 14: Choosing the correct resource group.
In the Set up monitoring step, Application Insights has automatically detected the application components installed on each EC2 instance and applied the proper monitoring templates to it (Figure 15). You do have the option of choosing additional templates per instance. These application tier assignments determine the essential performance metrics being collected from each EC2 instance. Select: Next.
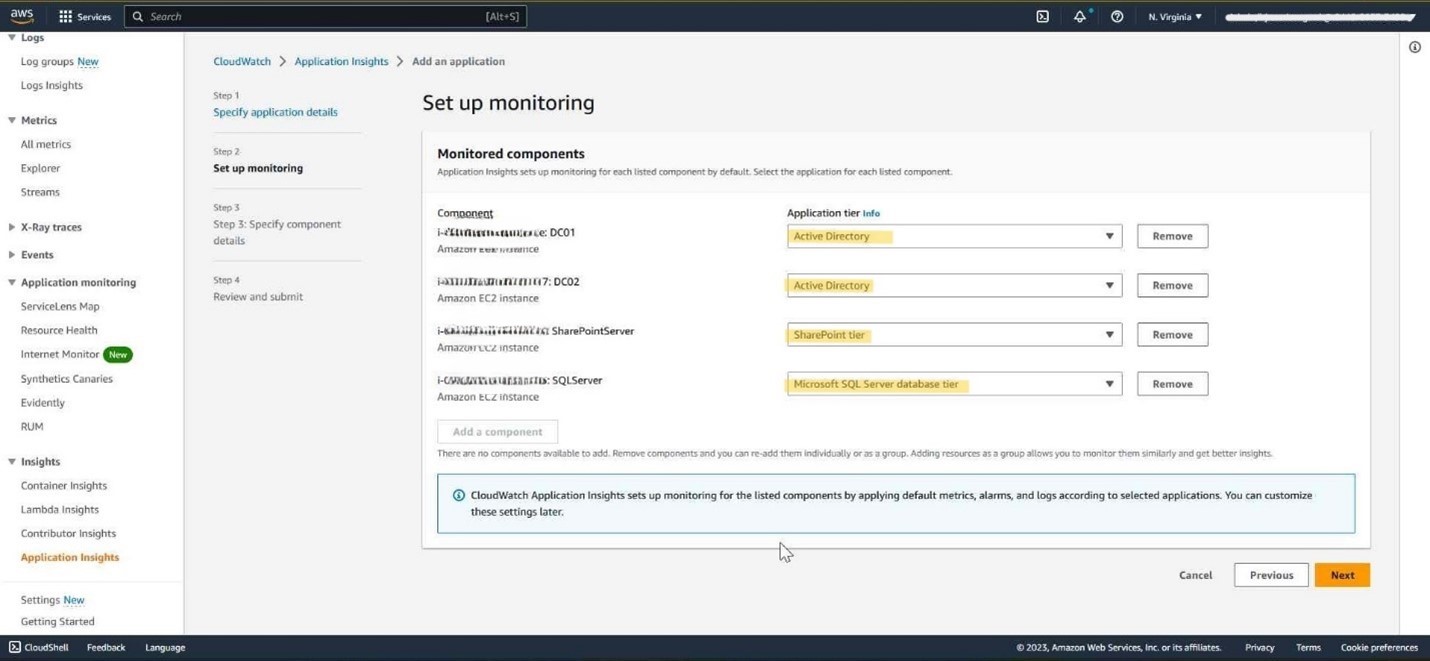
Figure 15: Components detected.
In the Specify Component Details step, there is an option to include application specific logs in addition to the Windows Events that are already captured by the Amazon CloudWatch agent. The SQL Server log path was already populated. I recommend that you figure out the path which SharePoint instance stores its ULS logs in, and provide it in the Application box. The path depends on the SharePoint version you’re using so refer to your SharePoint documentation to determine that (Figure 16). If you need more information about different SharePoint logs, I encourage you to read SharePoint ULS logs (Detailed tutorial).
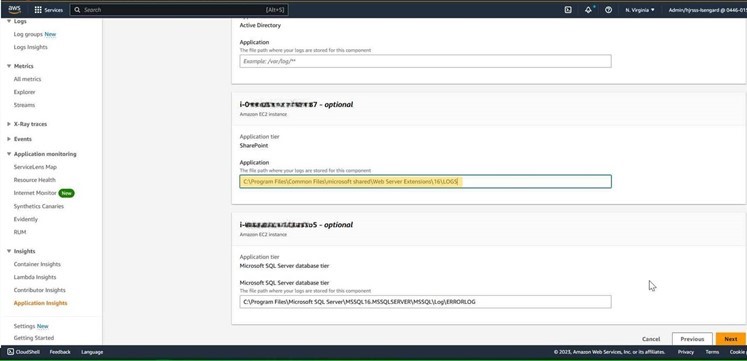
Figure 16: Additional details
Finally, review the parameters and select: Submit to create the Application Insights and start monitoring your SharePoint environment using the dashboard, metrics and alarms created (Figure 17).
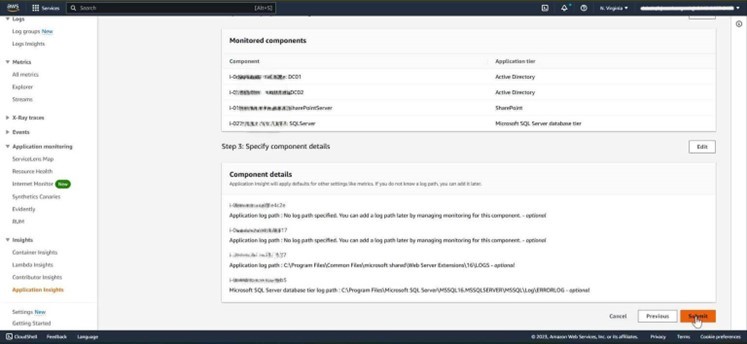
Figure 17: Review components and create.
Application Insights generated artifacts
To see the items Application Insights has created, go to the CloudWatch service page. There you will see alarms and issues created by Application Insights (Figure 18).
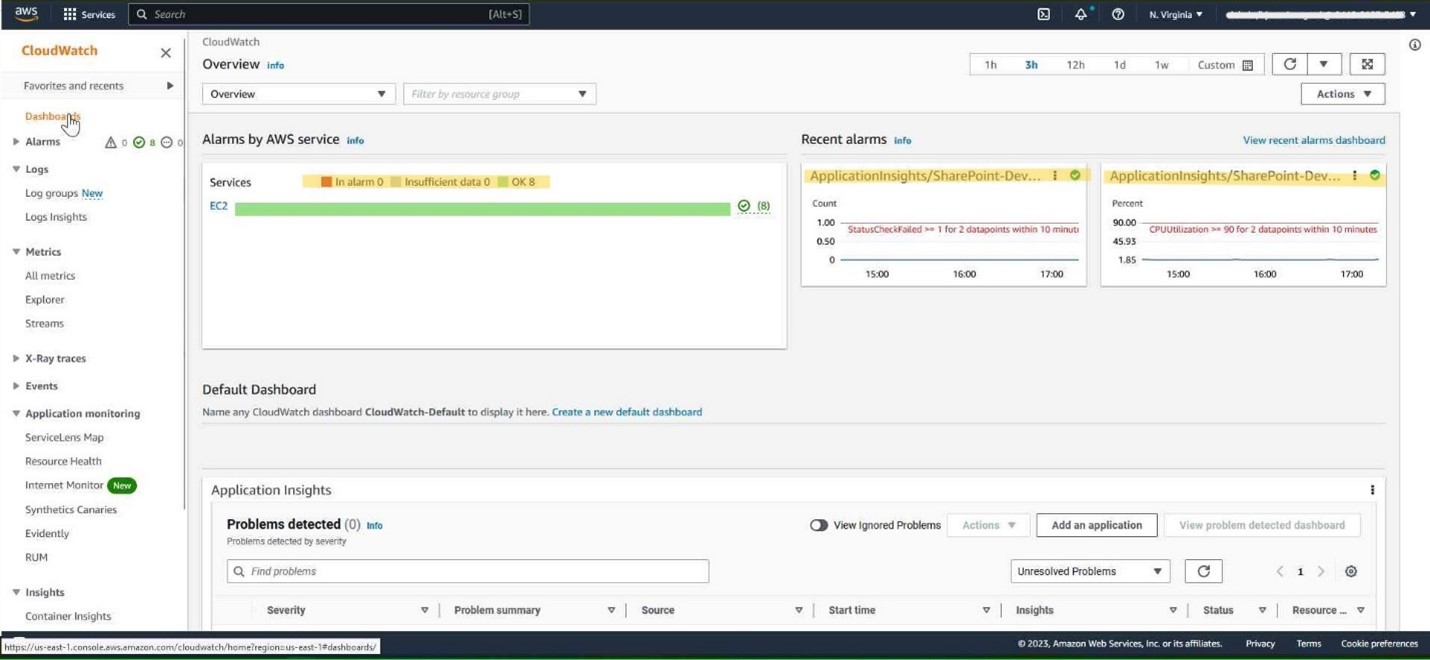
Figure 18: Alarms created.
Go to the Dashboards section to see the dashboard Application Insights created. As an example, I’m showing SharePoint here. Similar dashboards are created for the SQL Server and Active Directory instances. (Figure 19):
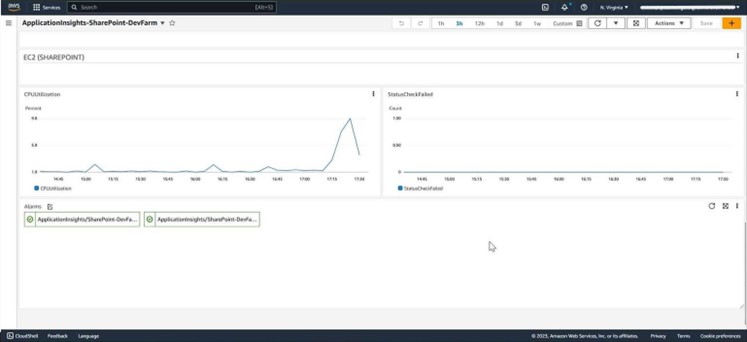
Figure 19: SharePoint server dashboard
Select the Components tab in the application on the Application Insights page, to see all Amazon EC2 instances. Selecting any of them, the Manage Monitoring button enables; allowing you to review and optionally add or remove metrics to include or exclude from monitoring (Figures 20 and 21):
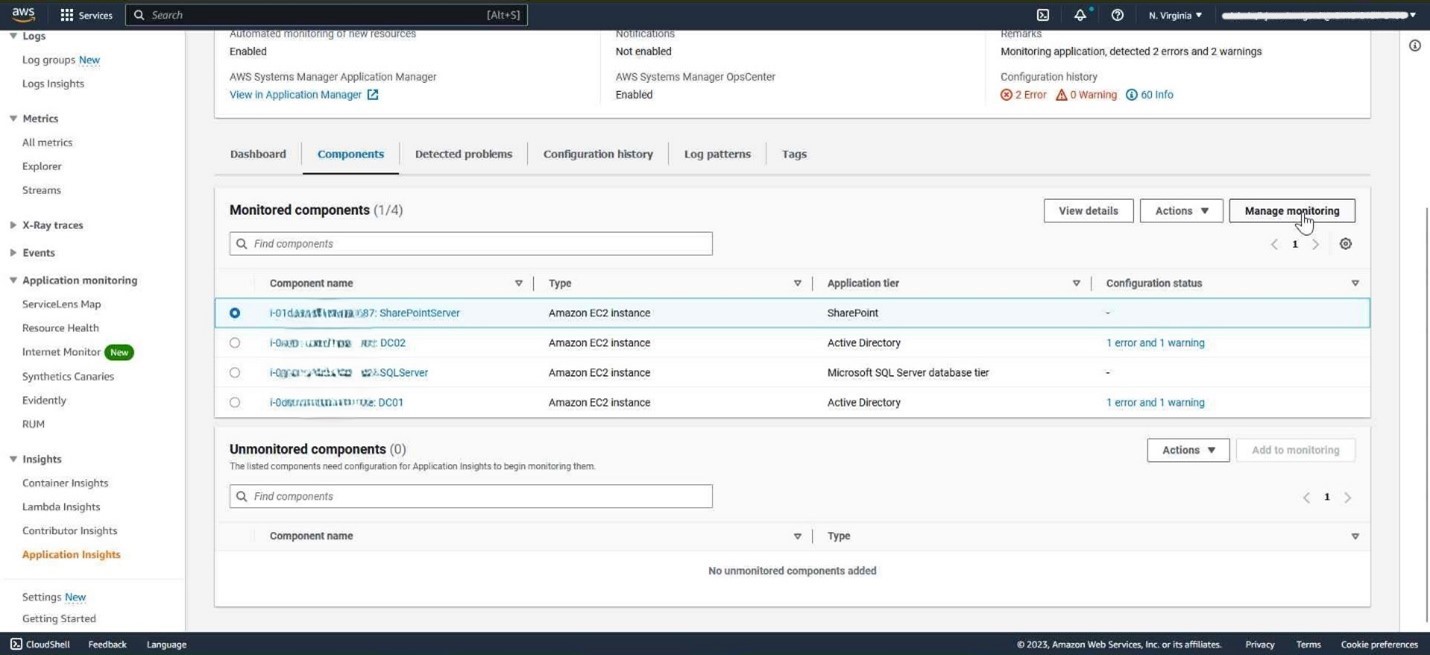
Figure 20: Components list
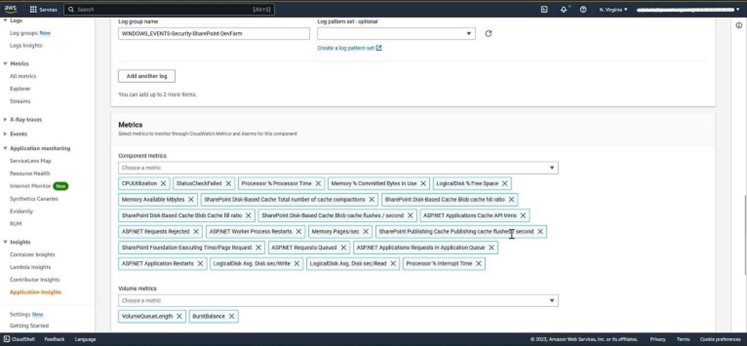
Figure 21: Monitored metrics
Some metrics might not be immediately available if your Amazon EC2 deployments are new. Here is a useful list of recommended metrics in case you want to customize the monitored metrics even further.
Application Insights has integration into Systems Manager as well. Go to the Systems Manager service page in the console, see the application created in the Application Manager. From here you can manage automation and compliance of the application from SSM feature sets (Figure 22):
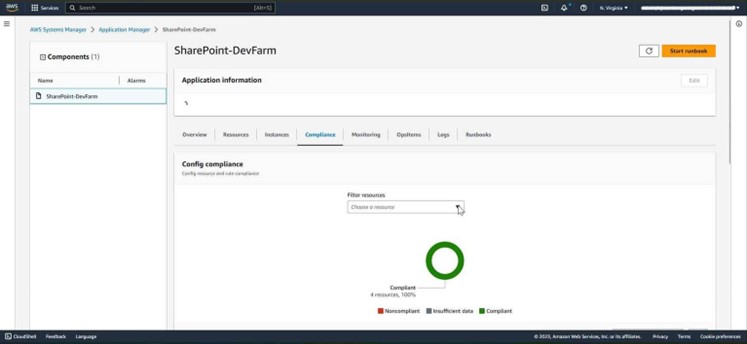
Figure 22: Application under SSM
Application Insights has created the relevant configuration for the CloudWatch agent. Windows event logs are streamed to a new log group that it has created for them. Access those logs in AWS console to dive deeper into the health of your workload (Figure 23).
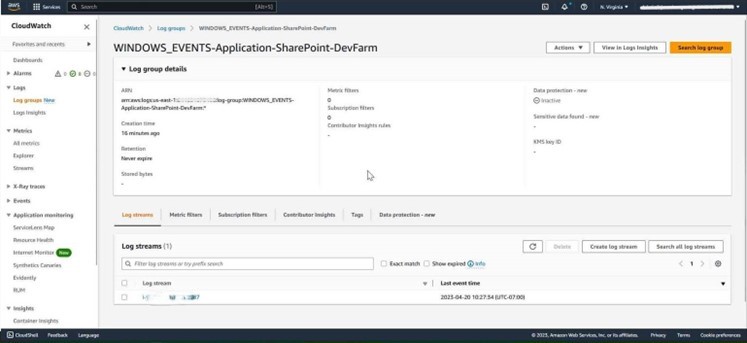
Figure 23: Windows Log group
Cleanup
To cleanup, from the AWS CloudWatch console, in the navigation pane on the left select: Insights and then Application Insights, in the Applications tab in the main pane, select your application and using the Action button choose Delete (Figure 24):
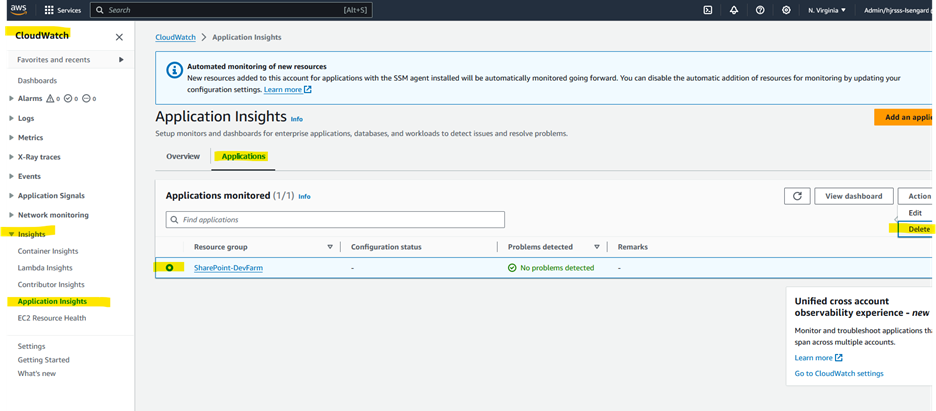
Figure 24: finding the application insight to delete.
A confirmation dialog box appears. Read the warnings and when ready type: delete in the confirmation box and select the Delete button (Figure 25):
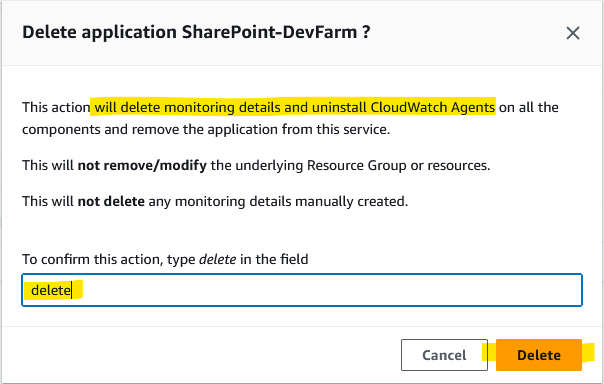
Figure 25: confirming deletion, accepting changes.
Next, from the AWS Resource Groups console in the list of Saved Resource Groups select your resource group and from the top right choose Delete (Figure 26):
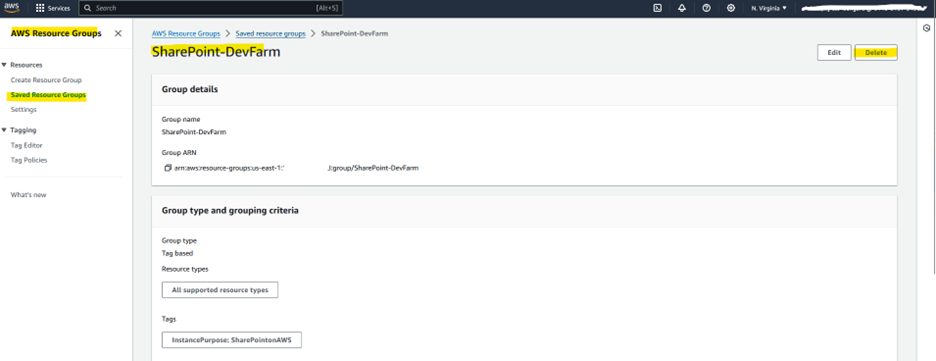
Figure 26: finding the resource group and delete action.
Review the changes and if you accept them select: Delete (Figure 27).
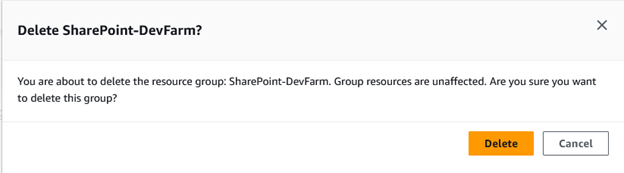
Figure 27: confirming deletion, accepting changes.
Finally, detach the instance profile from your EC2 instances and if unused, delete it completely.
Summary
In this post, I showed how to setup Microsoft SharePoint focused monitoring assets for AD, SQL Server, and SharePoint application servers in using Amazon CloudWatch Application Insights. To learn more about CloudWatch features, visit official CloudWatch documentation.
AWS has significantly more services, and more features within those services, than any other cloud provider, making it faster, easier, and more cost effective to move your existing applications to the cloud and build nearly anything you can imagine. Give your Microsoft applications the infrastructure they need to drive the business outcomes you want. Visit our .NET on AWS and AWS Database blogs for additional guidance and options for your Microsoft workloads. Contact us to start your migration and modernization journey today.