AWS Cloud Operations Blog
Analyzing Amazon Lex conversation log data with Amazon Managed Grafana
To support business and internal processes, organizations are increasing their use of conversational interfaces. They offer opportunities for more availability, improved service levels, and reduced costs. As these conversational services become more important, so, does the need to monitor performance and effectiveness of these interfaces with analytics and dashboards. This analysis is used to drive continuous improvements in these interfaces.
Although there are tools such as Amazon CloudWatch Logs Insights to provide analytics of Amazon Lex conversation logs, Amazon Managed Grafana (AMG) may be preferable for users who would like to analyze the logs separately without logging into AWS console.
Amazon Managed Grafana is a fully managed multicloud, cross-project service with rich, interactive data visualizations to help customers analyze, monitor, and alarm on metrics, logs, and traces across multiple data sources. You can create interactive dashboards and share them with anyone in your organization with an automatically scaled, highly available, and enterprise-secure service.
Prerequisites
For this walkthrough, you should have the following prerequisites:
- An AWS Account
- Appropriate Identity and Access Management permissions to configure Amazon Lex, Amazon CloudWatch and Amazon Managed
Solution architecture
In this post, we share a solution architecture that streams conversation logs from Amazon Lex to Amazon CloudWatch. We will configure and use Amazon Managed Grafana to build visualization and reporting insights for missed utterances, user requests, and sentiment metrics.
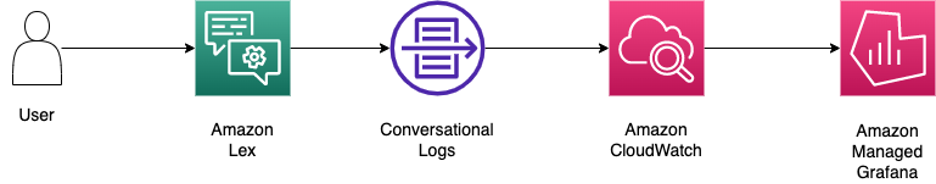
Figure 1. Architecture showing Amazon Lex and AMG integration
Step 1: Create or import a chatbot and publish an alias
The Amazon Lex console provides example bots (called bot blueprints) that are preconfigured so you can quickly create and test a bot in the console. In this post we will create OrderFlowers bot using the provided sample bots in Amazon Lex console.
- From AWS console, search for Amazon Lex and on Bots section, choose Create Bot
- For Configure Bot Settings, select Start with an example and choose OrderFlowers example bot

Figure 2. Choose OrderFlowers example bot
- For Bot configuration – provide Bot name as OrderFlowers, for IAM permissions – choose Create a role with basic Amazon Lex permissions, for COPPA – choose No, leave other defaults and select Next
 Figure 3. Screenshot of the Bot configuration
 - On Add language to bot section – leave defaults and choose Done
- After successful bot creation, on Language Intents screen, choose Build

Figure 4. Screenshot of the bot Language Intent configuration
- Navigate to Lex console and choose the newly created OrderFlowers bot, on left navigation select Bot versions and select Create version button. Leave all defaults on Create version screen, choose Create

Figure 5. Screenshot of the bot Create version
- After version is created, on left navigation pane, choose Aliases under Deployment, select Create alias. Provide Alias name as BotAlias, leave all defaults and choose Create
- By default, sentiment analysis is disabled on aliases. Choose BotAlias from Aliases screen, under Details section select Edit and check Enable sentiment analysis checkbox and Confirm

Figure 6. Screenshot of the enabling Sentiment Analysis
Step 2: Create CloudWatch logs group
- From AWS console, search for CloudWatch, choose Log groups from left navigation page
- Select Create log group button
- In Create log group screen, provide name amazon-lex-orderflowersbot-logs to Log group name
- Leave other defaults and select Create button

Figure 7. Screenshot of Create Log group
Step 3: Enable conversation logs in your Amazon Lex bot
Conversation logs are generated only when communicating with an Amazon Lex bot on an associated alias.
- In the Amazon Lex console, choose OrderFlowers bot
- Under Aliases, choose BotAlias
- Choose Manage conversation logs button
- Select Enabled for Text logs
- For log group name, choose amazon-lex-orderflowersbot-logs from dropdown
- Choose Retention setting as 1 week and select Save button

Figure 8. Screenshot of Manage conversation logs
To generate the conversation logs, you need to interact with the bot with a published alias. Conversation logs are not generated when you test the bot in the console. For more information, see Conversation Logs in the Amazon Lex Developer Guide. If you don’t have a client generating data on the Amazon Lex alias assigned in Step 1, you can generate via AWS CLI (If you don’t already have the AWS CLI on your local machine, refer to Installing or updating the latest version of the AWS CLI and Configuring the AWS CLI) . For this we need to get the bot id by selecting OrderFlowers bot on Amazon Lex console, and bot alias id by selecting BotAlias under Aliases on OrderFlowers bot page
$ aws lexv2-runtime recognize-text --bot-id '9YF0FLJXLS' --bot-alias-id 'HPYSGMCAET' --locale-id 'en_US' --session-id 'test_session' --text 'I would like buy flowers' --region us-east-1
Some more commands you can try from CLI
# What do you want to buy

 $ aws lexv2-runtime recognize-text --bot-id 'HPAE0A82LF' --bot-alias-id 'LVVOMIUCXD' --locale-id 'en_US' --session-id 'test_session' --region us-east-1 --text 'roses'
# What day you want to pickup

 $ aws lexv2-runtime recognize-text --bot-id 'HPAE0A82LF' --bot-alias-id 'LVVOMIUCXD' --locale-id 'en_US' --session-id 'test_session' --region us-east-1 --text 'wed'
# What time

 $ aws lexv2-runtime recognize-text --bot-id 'HPAE0A82LF' --bot-alias-id 'LVVOMIUCXD' --locale-id 'en_US' --session-id 'test_session' --region us-east-1 --text '10am'
# Thanks for your order

 $ aws lexv2-runtime recognize-text --bot-id 'HPAE0A82LF' --bot-alias-id 'LVVOMIUCXD' --locale-id 'en_US' --session-id 'test_session' --region us-east-1 --text 'yes'
With above steps, we have interacted with OrderFlowers bot and placed an order to buy flowers. These interactions generate Conversation Logs that are delivered to Amazon CloudWatch
Step 4: Prepare to use Amazon Managed Grafana to access CloudWatch logs
- From AWS console, search for Amazon Managed Grafana, choose Create workspace
- For Workspace name, provide orderflowers_ws and choose next
- For Authentication access, choose AWS IAM Identity Center (successor to AWS SSO), if IAM Identity Center is not enabled – we will be prompted to create user (like a SysOps user), then create a new user, check your email address for Invitation to join IAM Identity Center and choose Accept Invitation and set the password.
- Back on Amazon Managed Grafana workspace configuration page – leave defaults and choose Next
- For IAM permission access settings, select Amazon CloudWatch as Data source name, leave defaults and choose Next
- Review the details and choose Create workspace
- On orderflowers_ws summary page, for Authentication section, choose Assign new user or group, select user and choose Actions as Admin so that we have full permissions to create and customize Amazon Managed Grafana data sources.

Figure 9. Screenshot of overview page of Amazon Managed Grafana workspace

Figure 10. Screenshot of Authentication section of Amazon Managed Grafana workspace

Figure 11. Screenshot of Users section of Amazon Managed Grafana workspace
Step 5: Configure data source in Amazon Managed Grafana
- From Amazon Managed Grafana summary, select Grafana workspace URL, login to workspace with user details we created earlier
- Under Configuration, choose Data Sources, and then choose Add your first data source.

Figure 12. Screenshot of home page of Amazon Managed Grafana workspace
- In the search field, enter CloudWatch, leave all defaults and select Save & test

Figure 13. Screenshot of Amazon Managed Grafana datasource configuration
Step 6: Set up dashboard and panels
-
- In the left navigation pane, hover over the plus (+) sign, and then choose Dashboard.
- Choose Add new panel
- Choose CloudWatch. For Query Mode, choose CloudWatch Logs. For Log Groups, use amazon-lex-orderflowersbot-logs (created in Step 2)
- Enter the following query. This query provides unique user ID counts
FIELDS @message

| stats count_distinct(sessionId) as Sessions, count_distinct(requestId) as Requests, count(inputTranscript) as Transcripts - Choose a visualization for the query. For this first query, we use the Gauge visualization
- Choose Save

Figure 14. Screenshot of Amazon Managed Grafana gauge visualization
Some other queries to create more panels to dashboards
Missed utterance counts
Visualization: Gauge – a single value panel that can repeat a gauge for every series, column, or row.
CloudWatch query:
FIELDS @message

 | filter missedUtterance = 1

 | stats count(*) as Counts
Counts by intent (fulfilled)
Visualization: Bar gauge (vertical orientation) – simplifies your data by reducing every field to a single value
CloudWatch query:
FIELDS @message

 | filter dialogState like 'Fulfilled'

 | stats count(intent) as Counts by intent

 | sort Counts desc
Sentiment counts by label
Visualization: Bar gauge (horizontal orientation)
CloudWatch query:
FIELDS @message

 | stats count(*) as Counts by sentimentResponse.sentimentLabel as Sentiment

 | sort Counts desc
Missed utterance transcripts
Visualization: Table – supports multiple modes for time series and for tables, annotation, and raw JSON data
CloudWatch query:
FIELDS @message

 | filter missedUtterance = 1

 | display inputTranscript
Negative Sentiment Transcripts
Visualization: Table
CloudWatch query:
FIELDS @message

 | filter sentimentResponse.sentimentLabel like /NEGATIVE/

 | display inputTranscript
After all the panels are configured, you can adjust visualizations, change colors, resize and move panels on the dashboard at any time. After the panels are set up, the dashboard should look like the following. Be sure to save the dashboard.
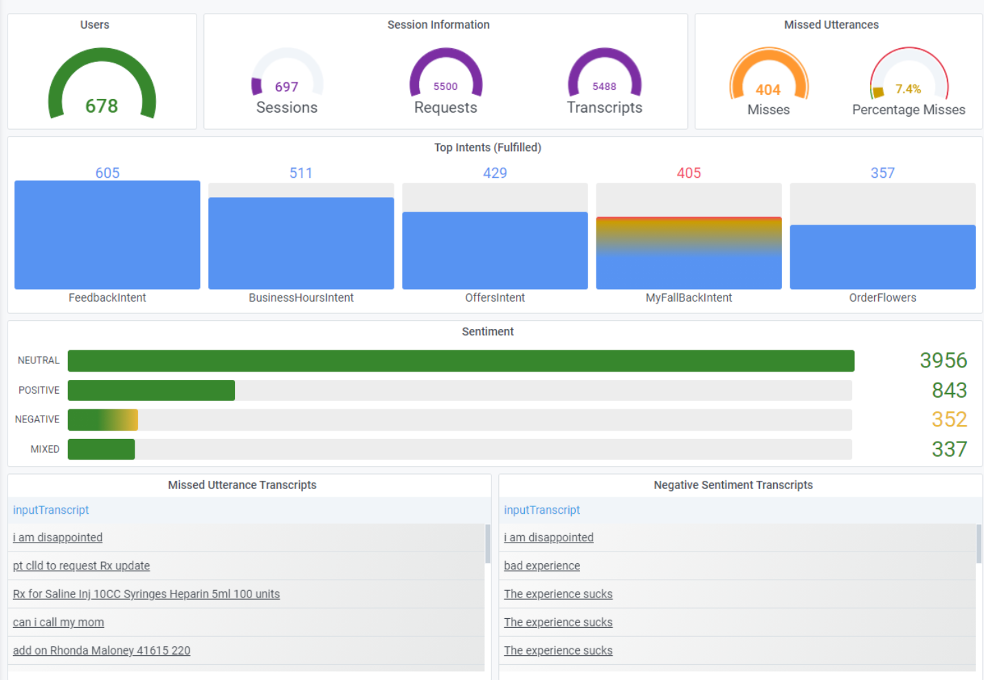
Figure 15. Screenshot of Amazon Managed Grafana dashboard with different panels
Conclusion
Conversational analytics are critical to evaluating bot performance and identifying opportunities for improvement. With Amazon Managed Grafana, you can easily evaluate CloudWatch logs and gain key insights. In this post, we covered how to enable and use conversation logs to provide these insights and use Grafana to visualize and report on key metrics. Start building your dashboards and learn more about integrating Amazon Managed Grafana with CloudWatch.