AWS Cloud Operations Blog
AWS Observability Services and Nobl9 Provide Quick and Easy SLO Monitoring
Learn how OutSystems uses AWS observability services and Nobl9 to establish and implement Service Level Objectives (SLOs) that consistently meet customers’ service availability expectations.
What are SLOs?
SLOs are essentially targets that are set for a given system’s desired consistency of behavior over time. SLO compliance is tracked based on service level indicators (SLIs), which are metrics used to measure the level of performance that users experience. Typically, when a system or service fails to meet its SLOs there are noticeable consequences for customers, such as performance degradation or outages. Setting a SLO involves determining a reasonable uptime goal by considering users’ expectations, and weighing the possible negative repercussions of a certain level of unavailability against the costs of ensuring greater reliability. The downtime afforded by the SLO, typically measured as a percentage, is known as its error budget.
71% of enterprises plan to adopt SLOs in order to bring IT closer to business and customer expectations. SLOs represent customer-defined expectations that are mapped to specific SLIs.
AWS and Nobl9 let you implement SLOs quickly
AWS and Nobl9 are collaborating to extend full-stack observability to SLOs. AWS observability tools such as Amazon CloudWatch and open source managed services such as Amazon Managed Service for Prometheus and Amazon Managed Grafana provide a diverse and complete array of metrics across different workloads.
Nobl9 SLOs tie customer-defined objectives to the health and performance of services, thus enabling:
- More actionable observability
- A holistic view of services defined by the business users/customers (a common layer across operations)
- Optimized IT resource spend through high-confidence, data-driven insights
Nobl9 supports both Amazon CloudWatch and Amazon Managed Service for Prometheus as well as nearly two dozen other data sources, thereby providing flexibility and choice for metrics tooling. For customers that have consolidated metrics in a data warehouse, Nobl9 also has the option to pull in SLI metrics from Amazon Redshift.
With existing metrics from AWS observability, Nobl9 lets users quickly and easily implement, maintain, monitor, and automate actions for SLOs without requiring a systems rewrite or expensive change management.
OutSystems consistently meets customer expectations using AWS Observability and Nobl9 SLOs
OutSystems, the provider of a high-performance low-code development platform that allows customers to create and maintain complex enterprise applications, was looking for a way to consistently deliver availability based on customer expectations. In addition, they were looking for a way to optimize when and how engineering resources are engaged by focusing on customer-impacting issues. To meet these goals they decided to implement SLOs, leveraging their existing AWS observability services and Nobl9.
Complex services are typically composed of many individual systems that, more often than not, have implemented different observability tools. These tools emit data in the form of SLIs. SLIs provide valuable insights at the system level, but they stop short of empowering high-confidence, data-driven decisions about where to invest resources (for example, deciding whether to deploy engineering to solve a problem, to spin up more compute resources, or to focus on reducing technical debt). This lack of clarity can lead to expensive consequences, such as accumulating tech debt or causing burnout among the on-call engineers.
SLOs describe the desired standard of performance (or the “good enough” level) of the services that you provide from the perspective of the business/customers. They enable you to make smarter decisions, allocating your resources where they’re needed most and avoid investing too much in areas that, at least for the moment, don’t require additional attention.
OutSystems runs the majority of its business on AWS and is a huge proponent of leveraging AWS native services and tools. They chose to work with Nobl9 because of its extensive support for AWS and its focus on helping organizations find a balance between operational efficiency, reliable delivery of services, cost control, and customer satisfaction. Implementing SLOs enabled OutSystems to monitor what matters most to its customers with accuracy and consistency, thereby reducing the toil related to tracking data from various sources.
OutSystems monitors every customer’s deployed infrastructure to make sure that it meets customer-defined expectations. Business metrics are sent to Amazon Managed Service for Prometheus, and all infrastructure-related data is stored in Amazon CloudWatch.
SLOs provide the granularity to define and track different business objectives. Customers’ environments require differing reliability goals. Therefore, OutSystems is on a journey to expand the implementation of SLOs at the granularity of an individual customer. Nobl9 centralizes all of the metrics related to SLOs, thus providing a global overview of the overall health of customer services. With Nobl9’s flexible alerting system, OutSystems can specify exactly when teams must be alerted to make sure that they stay ahead of risks that impact customer expectations and SLAs. This methodology enables the consistent achievement of objectives across the platform, infrastructure, and environments. Further, it ensures that engineering and business units are aligned and making data-driven decisions with confidence.
OutSystems already had access to detailed observability data from multiple AWS sources, such as Amazon CloudWatch, which enabled analysis of individual infrastructures and environments that, in turn, support applications. However, this wasn’t sufficient to provide a holistic and shared context view of reliability across environments and configurations to the extent that reliability should be understood by any function within the org (from BD to Sales, Support, and Engineering). This resulted in deploying resources to address each and every problem to prevent potential reliability issues. Although this approach made sure customers’ needs were met, this became a major source of toil across the spectrum (Support, SRE, Observability, and Core Engineering), thereby impacting velocity and increasing technical debt.
To address these concerns, OutSystems worked closely with Nobl9 to add SLO monitoring to their platform, which now resembles the following:
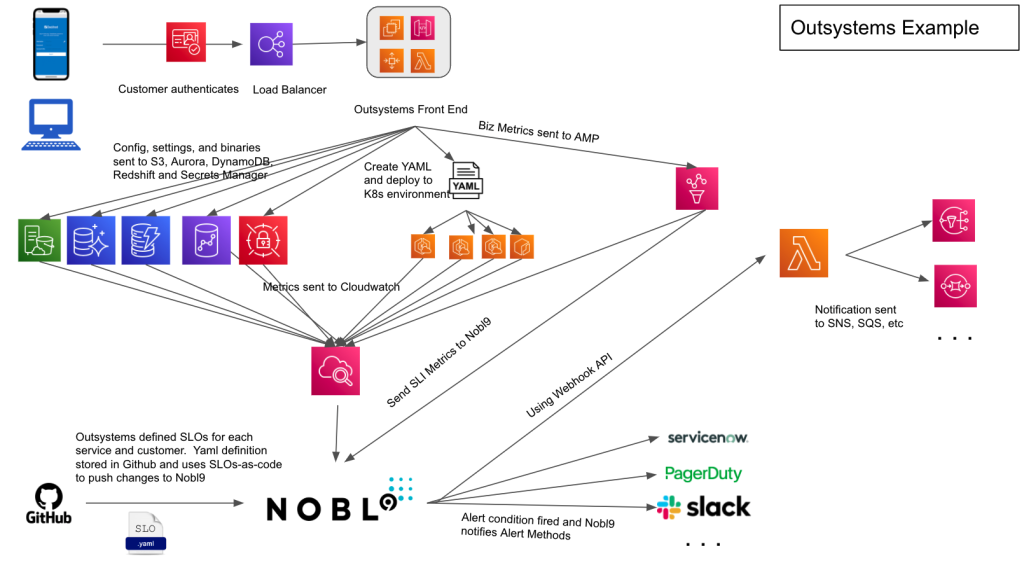
Figure 1. Architecture diagram showing Outsystems and Nobl9 integrating with AWS services
Learn how OutSystems creates SLOs in Nobl9 using AWS Observability
In this section, we’ll explore how OutSystems creates SLOs based on the AWS observability stack and uses them to stay on top of possible reliability problems. We’ll show you how to build two SLOs by leveraging data from Amazon Managed Service for Prometheus and Amazon CloudWatch.
OutSystems monitors customer deployments and other user actions, storing that data in Amazon Managed Service for Prometheus. The first SLO relates to deployments: OutSystems wants a 99% deployment success rate each week.
The second SLO relates to AWS infrastructure. Using data stored in Amazon CloudWatch, OutSystems wants to monitor the uptime of each client’s EKS environment.
Let’s walk through implementing the first SLO. To pull SLI data from Amazon Managed Service for Prometheus into Nobl9, you must set up a connection with the data source. This can be done in a couple of simple steps, beginning with configuring the data source.
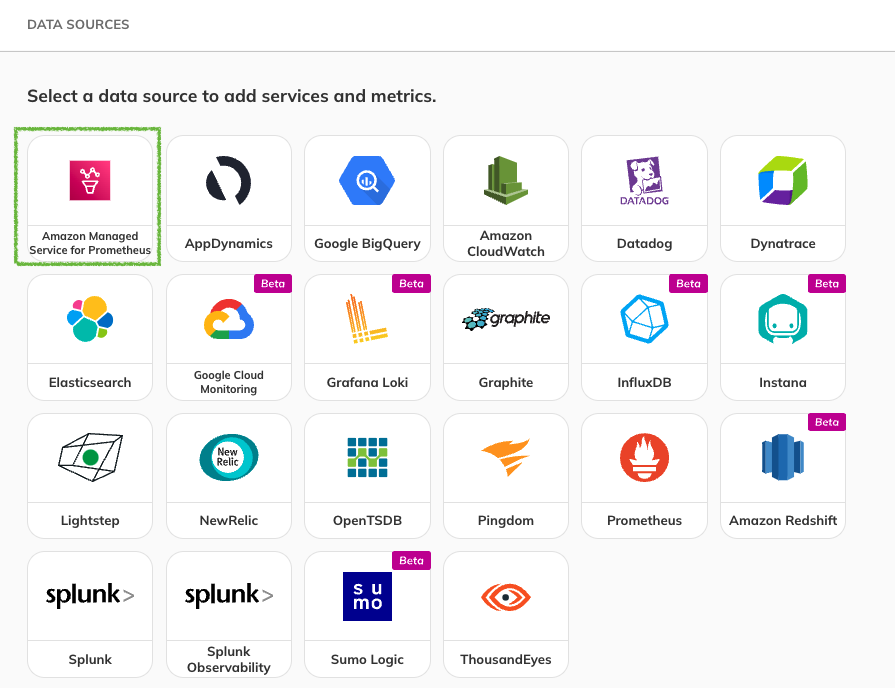
Figure 2. Nobl9 data source selector highlighting Amazon Managed Service for Prometheus integration
Next, you must specify the connection method. For most integrations, Nobl9 supports Direct and Agent connections. Customers typically choose the Agent method if they don’t want to expose their server to Nobl9, or share their credentials, or if their company’s firewall blocks outbound connections. If you want Nobl9 to be able to access your server directly over the internet, you can use the Direct connection method. This method requires you to enter your authentication credentials, which will be encrypted and safely stored on the Nobl9 server. For the purposes of this post, we’ll assume that you’re setting up an Agent connection with Amazon Managed Service for Prometheus. Similar steps can be followed to set up a connection to Amazon CloudWatch.
Once you’ve provided all of the necessary information in the Data Sources wizard, select “Save Data Source.” Nobl9 will automatically generate a Kubernetes configuration in YAML and a Docker command line that you can use to easily deploy the Agent on your infrastructure.
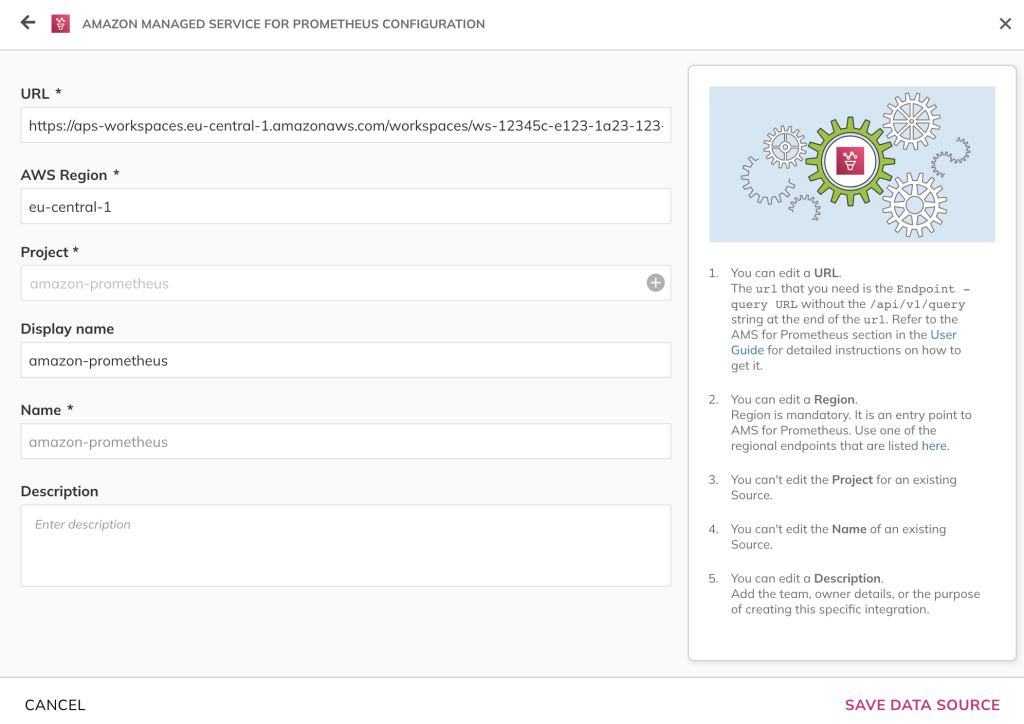
Figure 3. Configuring Amazon Managed service for Prometheus configuration in Nobl9 console
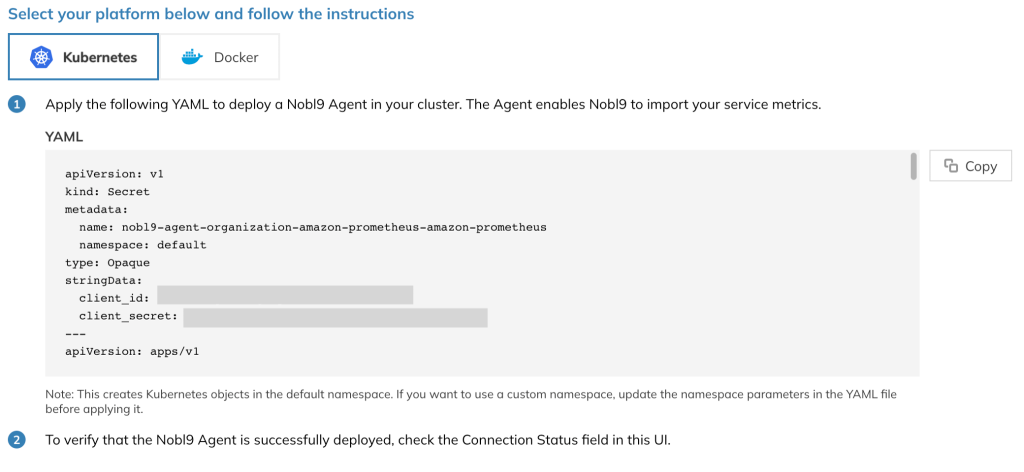
Figure 4. Configuration showing Nobl9 agent installation in Kubernetes cluster
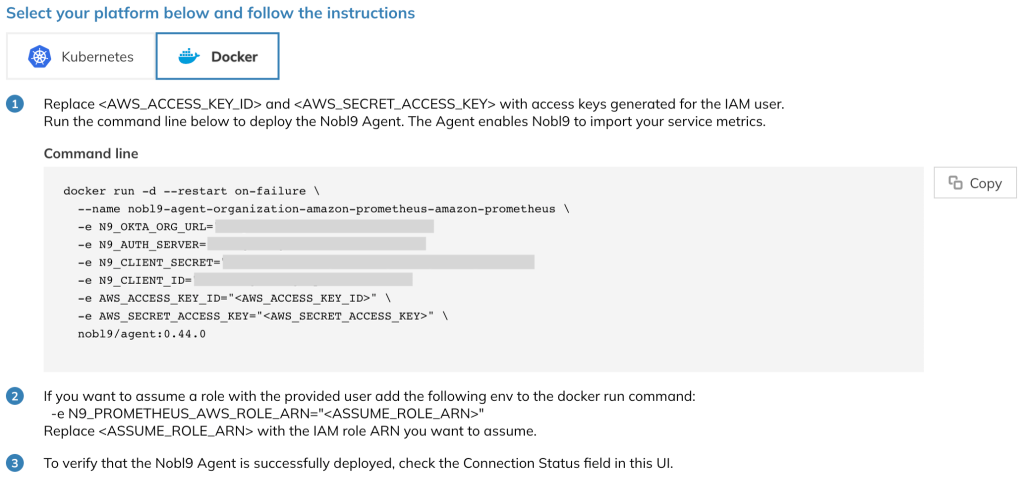
Figure 5. Docker command showing parameters to start the Nobl9 agent.
Having set up the data source connection, you can move on to creating your SLOs. To do this, navigate to the Service Level Objectives panel in Nobl9 and select the + button to open the SLO wizard.
Select the data source that you configured in the previous step, and provide the necessary information. To simplify the user journey as much as possible, Nobl9 will accept the same query used to gather your metrics in your data source, as long as it returns n9_time and n9_value fields. Let’s see how to do this.
For the first SLO, we’ll pull SLIs from Amazon Managed Service for Prometheus. First, you will be asked to provide the query. Nobl9 allows for querying for a single time series that will be evaluated against a threshold, or for two time series to compare (e.g., the count of good requests vs. total requests). Since the SLO assumes that OutSystems wants a 99% deployment success rate each week, we’ll go with a Ratio Metric (good/total).
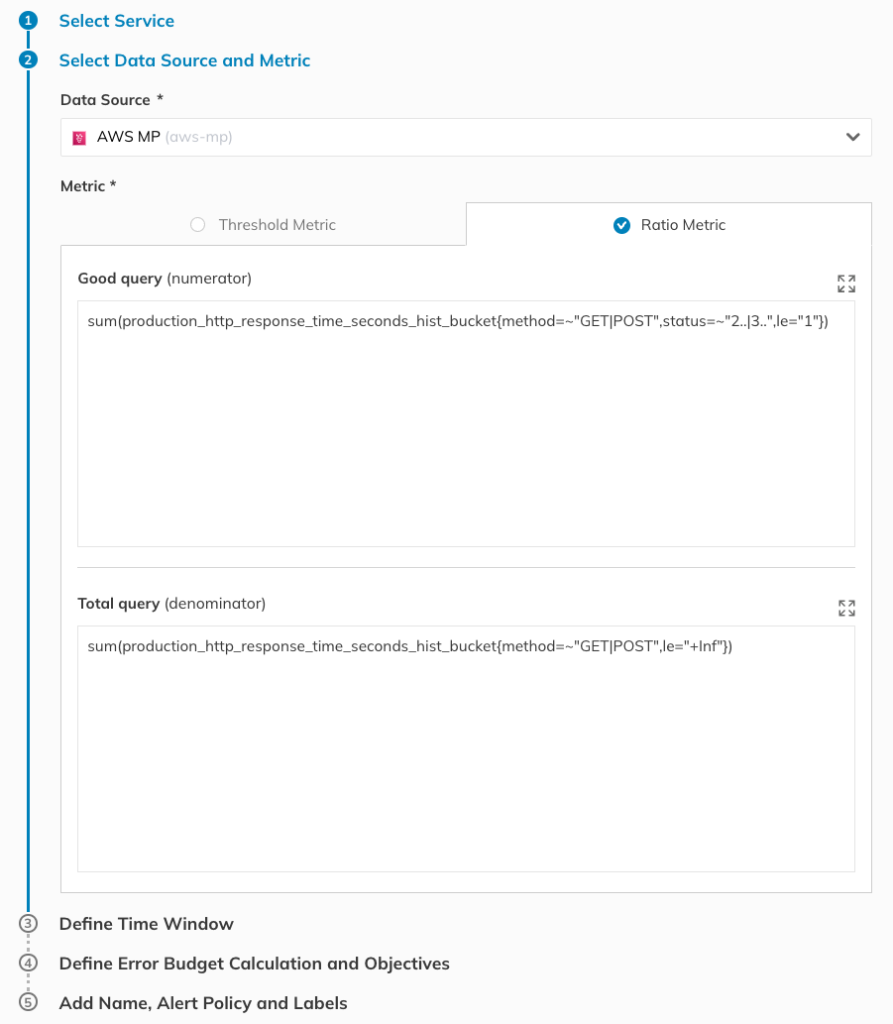
Figure 6. Since we’re looking at a 99% target for a week, we’ll set the rolling time window to 7 (seven) days in Step 3.
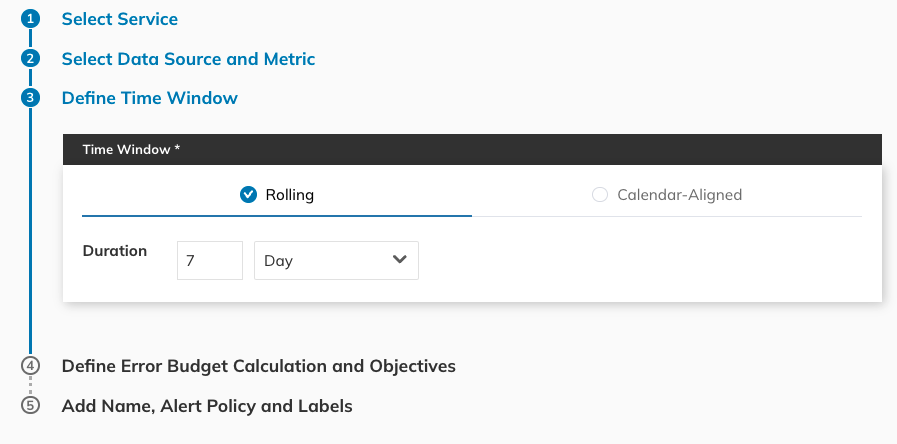
Figure 7. SLO Time Window configuration in Nobl9 console.
In Step 4 of the SLO wizard, you select the error budget calculation method (we’ll use Occurrences, as we want to count the number of good attempts out of all of the attempts) and define the target. You can also provide an experience name for the objective.
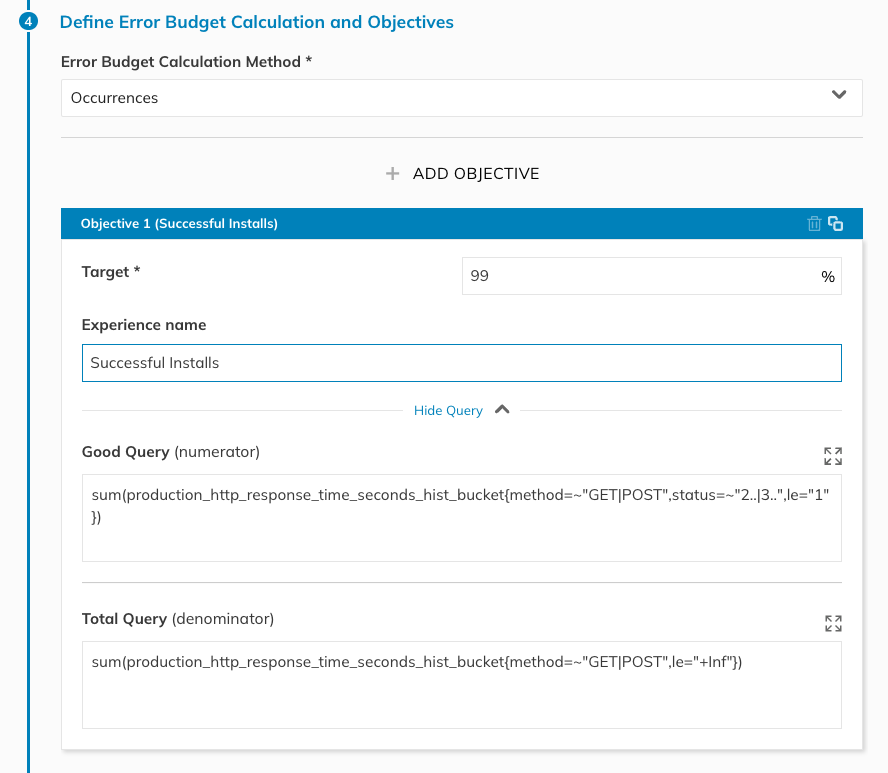
Figure 8. SLO objective configuration in Nobl9 console.
Finally, in Step 5 you can provide additional information related to the SLO, such as a name, labels, a description, and a link to the raw metrics. Nobl9 has also recently launched Composite SLOs. This innovation allows you to group multiple SLIs into a single SLO with a global error budget. More information on Composite SLOs is available here.
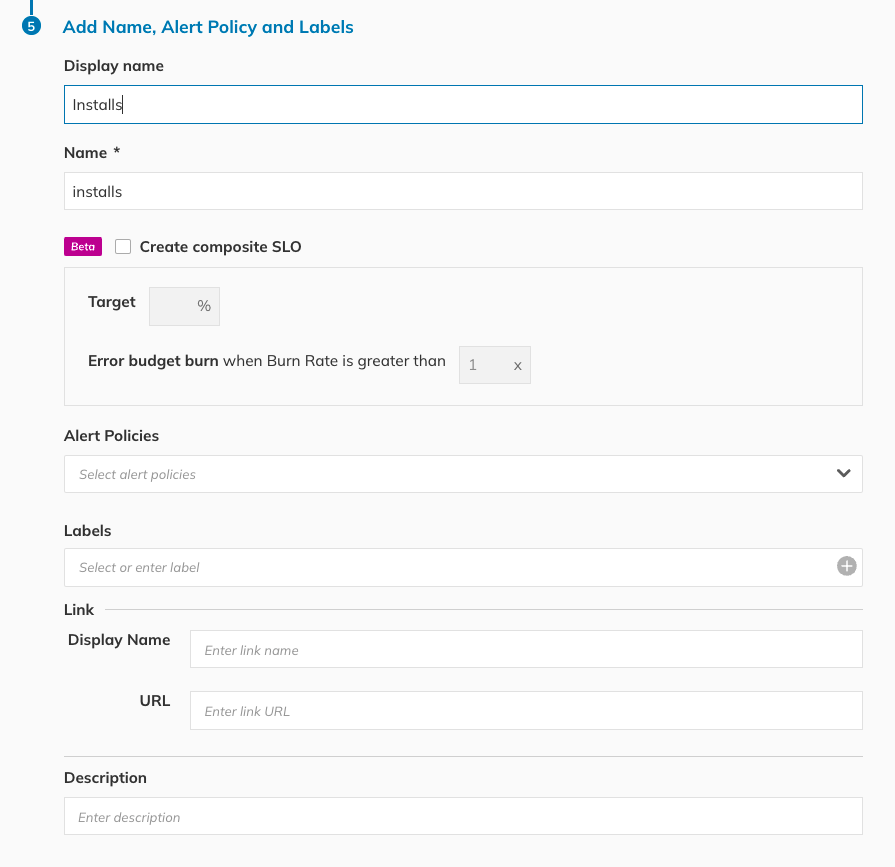
Figure 9. SLO configuration in Nobl9 console.
Once you select “Create SLO,” you’ll be taken to the SLO grid view, where you can see your SLO. The grid view provides a simple overview of all of your SLOs so that you can easily spot any services that need attention.
It will take a few minutes for your new SLO to start pulling data from Amazon Managed Services for Prometheus. However, once the data is flowing through, you’ll start seeing your burn down chart.
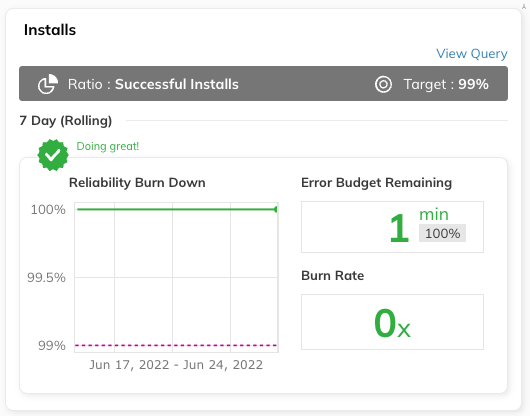
Figure 10. Reliability burn down chart on Nobl9 interface.
For our second scenario, using Amazon CloudWatch, you can follow the same steps to create the SLO. The main difference is in Step 2 of the SLO wizard where you will instead define your query through one of three ways: standard metric query, CloudWatch Metrics Insights SQL query or raw JSON query.
Managing Nobl9 SLOs
Now that you’ve created your SLOs, we can explore Nobl9 further.
First, you can get a high-level view of the overall health of all your services in the Service Health Dashboard. This view is especially useful for managers or executives who need a quick overview of the organization’s health, without going into too many technical details.
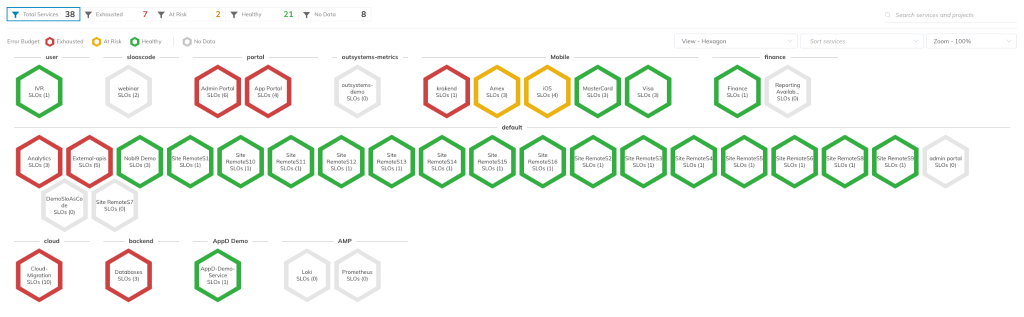
Figure 11. Nobl9 Service Health Dashboard.
After setting up your SLOs, you can also specify how you want to be alerted. Nobl9 users can choose from a variety of alert methods, including email, several popular notification tools, and webhooks.
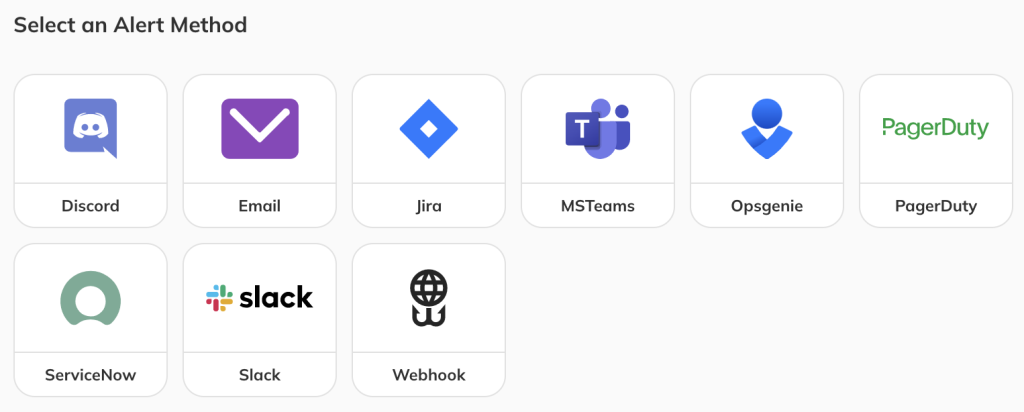
Figure 12. Supported Alert Methods in Nobl9 console.
Webhooks provide a lot of flexibility, as they enable sending alerts through an HTTP callback handler that is triggered by an event. You can send the alerts via
the tool of your choice (such as AWS Lambda). Let’s take a look at how to configure a webhook alert method in the Nobl9 UI:
- Navigate to Integrations > Alert Method.
- Select +, and select Webhook from the list of available options.
- Add the required data, such as the URL, project name, and alert method name.
The display name and description are optional, but they will help you identify this resource later on. Some tools will require passing additional information, such as bearer tokens in headers. You can include this information in the Custom Headers section.
You can choose between configuring a standard Nobl9 webhook (which lets you choose fields from a checklist that are then sent with the default Nobl9 message) or a custom webhook (which lets you create your own payload in JSON format). Once you’ve entered all of the necessary information, select Add Alert Method and proceed to the next step, specifying the conditions that will trigger an alert.
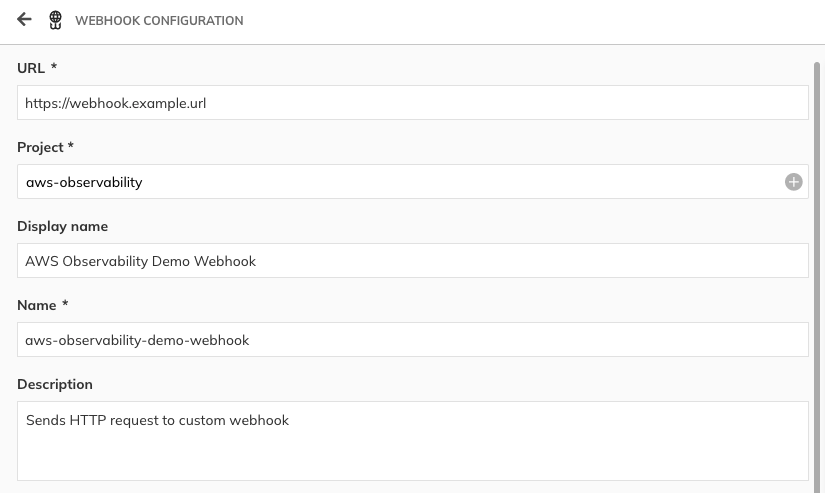
Figure 13. Webhook configuration for alerts in Nobl9 console
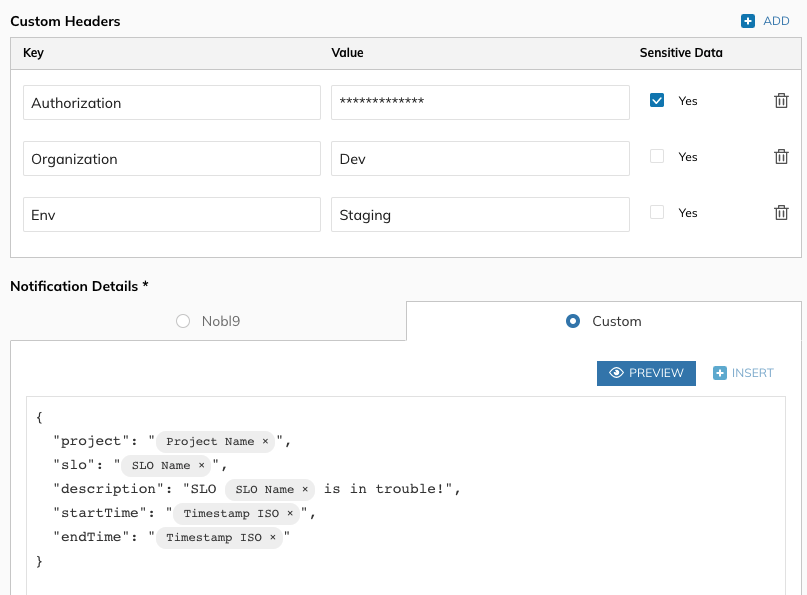
Figure 14. Webhook Alert template configuration on Nobl9 console.
Now you’re ready to set up an alert policy. Navigate to Alerts and select the + button to launch the Alert Policies wizard, where you can define the alert conditions. For some SLOs it may be useful to send an alert if the error budget will be exhausted in a certain amount of time. For others, a more appropriate condition will be alerting if the remaining error budget reaches a given threshold. In other cases the average error budget burn rate may be a better indicator of an upcoming issue, or choosing two or more conditions might be the optimal solution. This all depends on the specific use case and the problem that you’re trying to address.
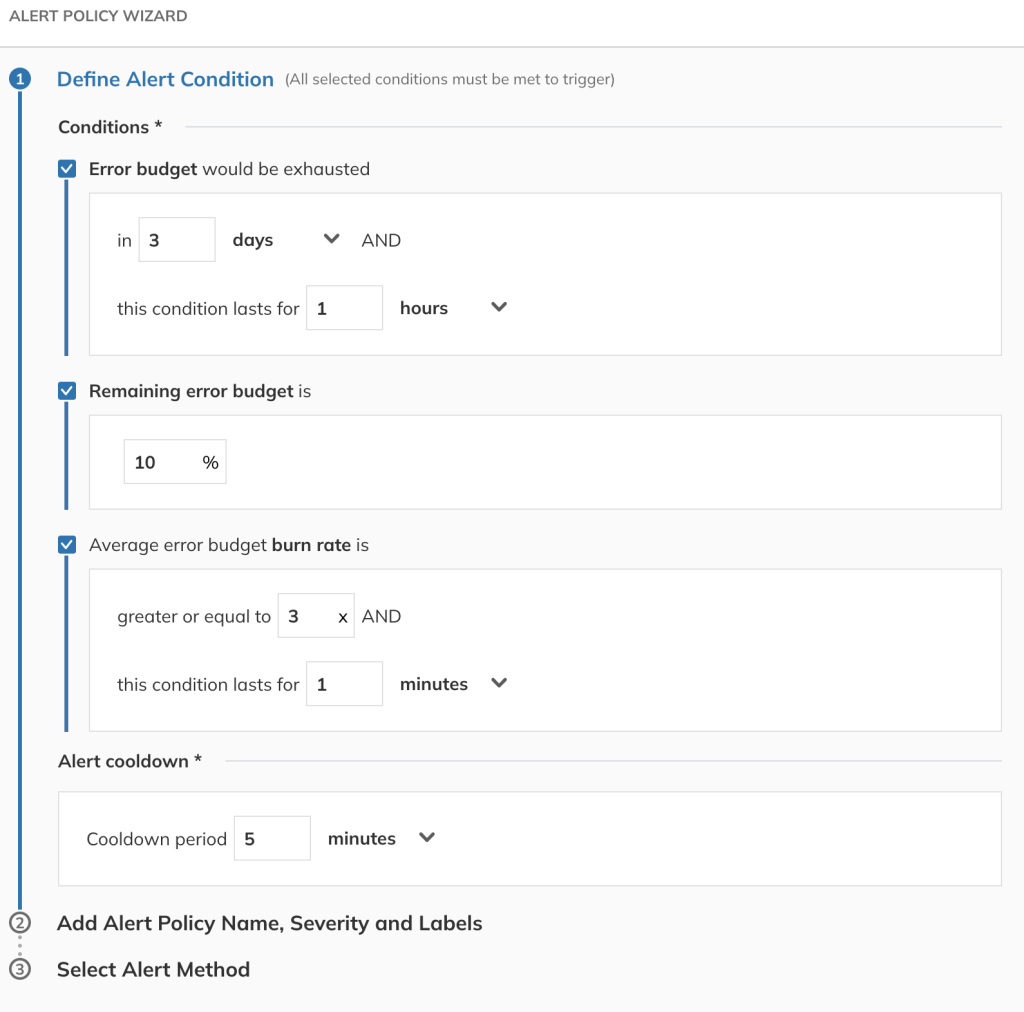
Figure 15. Alert conditions configuration on Nobl9 console.
By choosing reasonable targets, you can easily track whether or not your service is operating within defined boundaries. Having common objectives underpinned by solid data will enable you to make better decisions about resource allocation, development investments, incident prevention, and more.
Conclusion
AWS customers already have valuable data in tools like Amazon CloudWatch, Amazon Redshift, and Amazon Managed Service for Prometheus that can be easily pulled into Nobl9. Nobl9 lets customers easily monitor and manage all SLOs related to this data, thereby reducing the toil associated with managing complex services. Users can manage SLOs across the enterprise, proactively addressing potential issues before they become problems and making data-driven, high-confidence decisions about resource use.
Authors: