AWS Cloud Operations Blog
Easily set up Amazon CloudWatch Internet Monitor
Amazon CloudWatch Internet Monitor provides near-continuous internet measurements for your internet traffic, including availability and performance metrics, tailored to your specific workload footprint on AWS. With Internet Monitor, you can get insights into average internet performance metrics over time, as well as get alerts for issues (health events). You’re notified about events that impact your end user experience for applications the clients access through Amazon CloudFront distributions, Amazon WorkSpaces directories, Network Load Balancers, or in Amazon Virtual Private Cloud VPCs.
You can now onboard with a few simple steps to start using Amazon CloudWatch Internet Monitor to monitor your application’s internet traffic. Previously, CloudWatch Internet Monitor onboarding was a multi-step process as covered in this blog post. This blog post outlines the new onboarding experience as well as options to make informed decisions about choosing the optimal traffic percentages and city-networks.
Prerequisites
For the following sections, we assume that you are familiar with fundamental AWS networking services, such as VPCs and CloudFront distributions. We won’t focus on defining each service, but will outline the steps required for using them with Internet Monitor. You can find detailed information about AWS resources in the corresponding developer and user guides.
Simplified Onboarding
Create a monitor
- To create a monitor, navigate to Internet Monitor under Application Signals in the CloudWatch console, and then choose Create monitor (figure 1).
- Enter a name for your monitor, and then associate your resources to monitor through Add resources – you can monitor Amazon Virtual Private Clouds (VPCs), CloudFront distributions (CF), Amazon Workspace directories and Network Load Balancers (NLBs) with internet monitor.
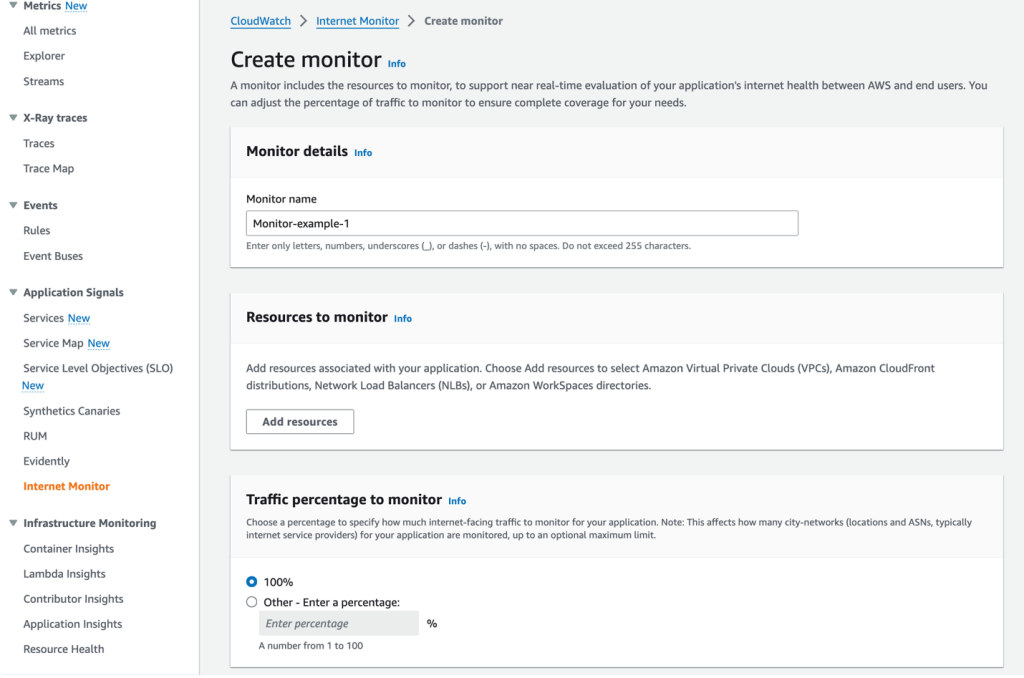
Figure 1. Screenshot of Internet Monitor creation step with required fields
- Then, you select the internet traffic percentage to monitor to derive the optimal value from the service. We recommend that users select a high traffic percent (>90%) to derive maximum value from the service. By default (shown in Figure 1) this field is set at 100% with the flexibility for users to change using Other – Enter a percentage field.
The required steps to onboard to the service are now complete.
Users also have the option to set a few additional fields, including City-networks maximum limit, publish internet measurements to Amazon S3, and add tags. These fields are now rolled up beneath the ‘Advanced settings’ tab (Figure 2). For City-networks maximum, select a maximum for the number of city-networks that you want Internet Monitor to monitor traffic for. The value that you choose here limits how much of your global application traffic over the internet that Internet Monitor monitors.
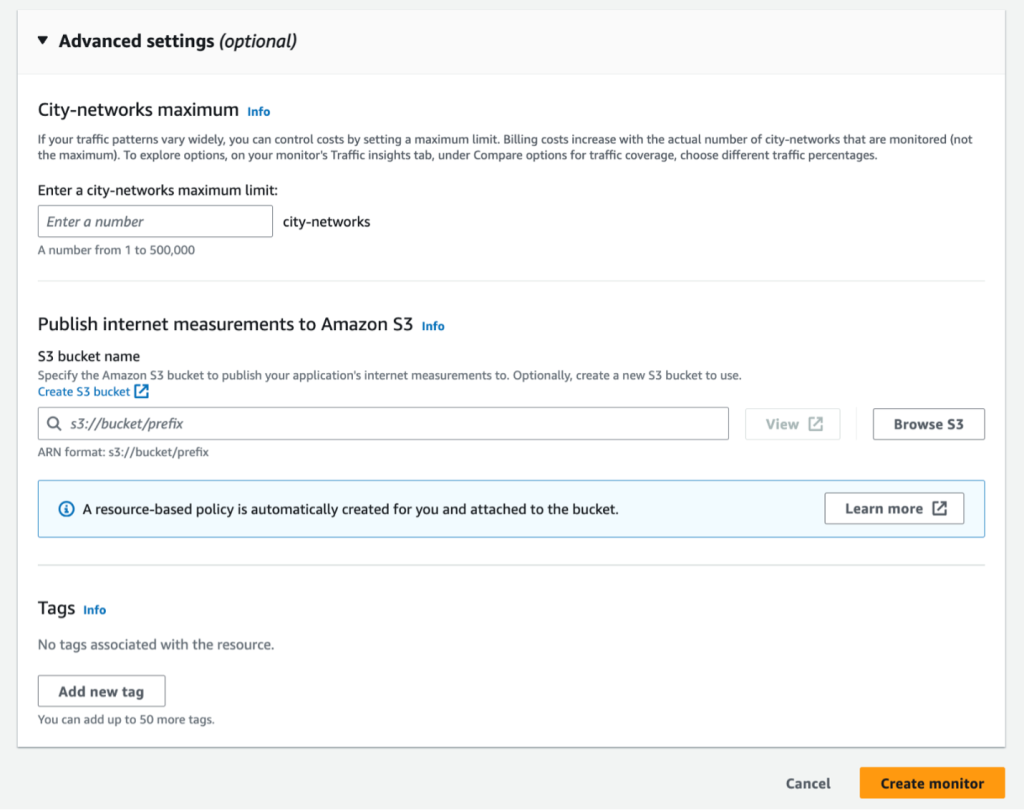
Figure 2. Screenshot of Advanced settings for Internet Monitor creation
Optimize monitor settings
- When your monitor is active, select the monitor to open the Overview page. The following screenshot (Figure 3), shows an example of an active monitor. You can see a summary about the current availability and performance scores, and information about health events for your monitored traffic.
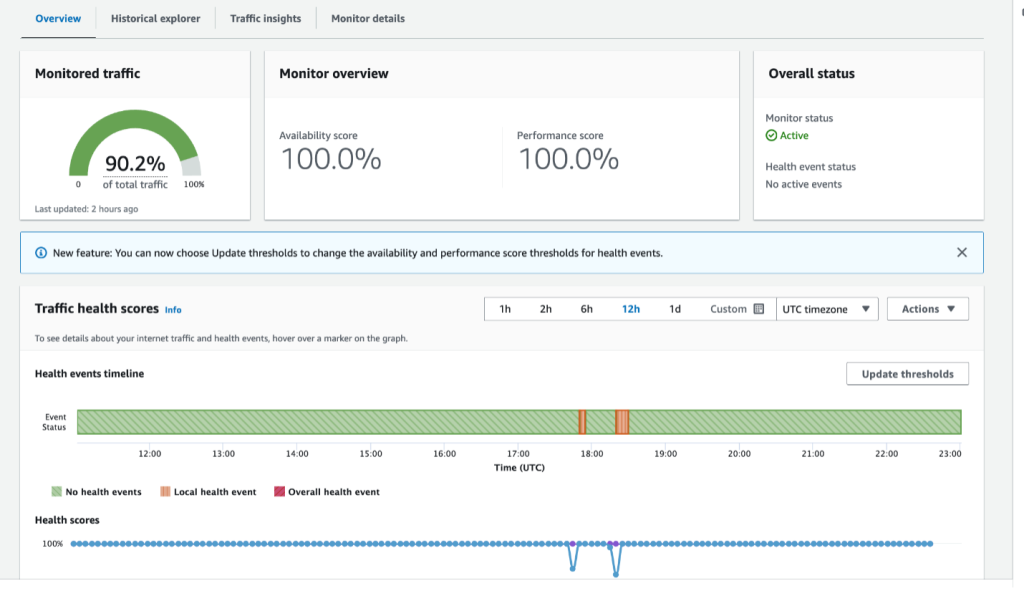
Figure 3. Screenshot of the Overview page on the Internet Monitor dashboard with the updated health events timeline
- For optimizing monitor settings, in Traffic insights tab, use the Compare options for traffic coverage to make an informed decision on the trade-off between the traffic percent to monitor and number of city-networks to monitor.
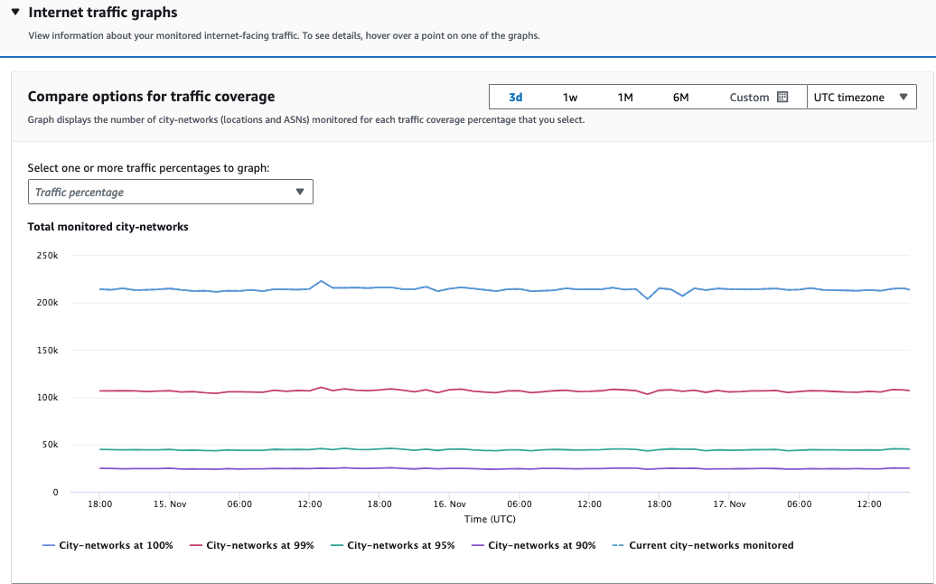
Figure 4. Screenshot of the Compare options for traffic coverage section under Traffic insights tab of Internet Monitor dashboard
As an example, the graph above (Figure 4) shows the number of city-networks derived from a range of traffic percent configured between 90-100%. It’s clear that there are a couple of inflection points (a) when traffic percent is increased from 95% to 99% and (b) from 99% to 100%.
In both cases, the number of city-networks increase is significant for marginal increase in traffic percent. The customer has a choice to limit the traffic percent at 95% to begin with and then if they need to increase accuracy, they can move the traffic percent to 99%. These options will provide the customer with optimal value while limiting the number of city-networks.
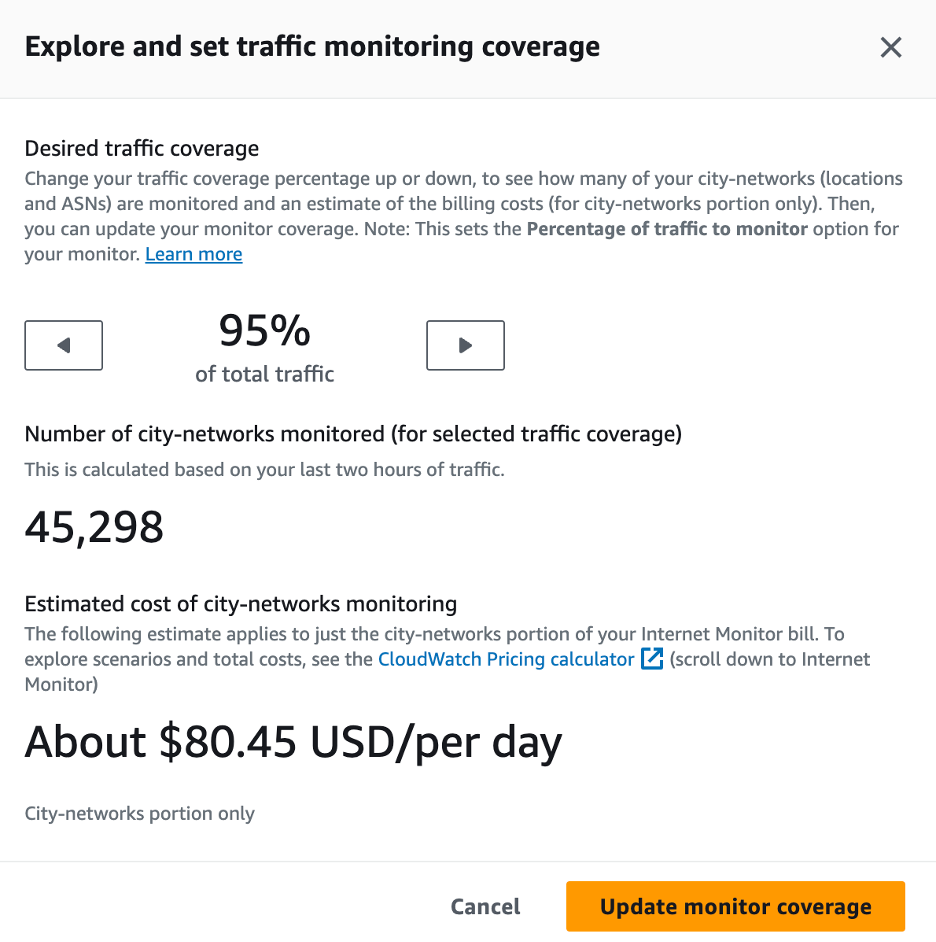
Figure 5. Screenshot of the Explore other traffic coverage options under Traffic insights
- In order to better estimate the costs for internet monitoring, select Explore other traffic coverage options under Traffic insights tab and choose the Desired traffic coverage percentage (Figure 5). This allows you to see the costs right away, so you can choose what percent of traffic to monitor, based on prices.
Conclusion
In this blog post, we explained the new simplified Amazon CloudWatch Internet Monitor onboarding experience. Also, we covered how to make an informed decision about choosing the optimal traffic percentage and city-networks, including the cost estimates for traffic percentage selections. Get started using Internet Monitor for your application today, to take advantage of continuous observability of internet availability and performance, tailored to your workload footprint on AWS.