AWS Cloud Operations Blog
Getting Started with CloudWatch agent and collectd
Observability helps you understand the health, usage, performance, and customer experience for your workloads. Observability can support many use cases, from detecting incidents and supporting incident resolution, to understanding the impact of new features on your users and workflow. Establishing the right solution depends on being able to gather the right data for your situation. In this post you will explore the use of collectd and the Amazon CloudWatch agent to add to the metrics that can be gathered from Linux instances.
You will walk through a basic setup of collectd and the CloudWatch agent on an Amazon Elastic Compute Cloud (Amazon EC2) Linux instance. The CloudWatch agent can collect system-level metrics and logs from your Amazon EC2 instances, and supports the collection of additional metrics from collectd. The data you collect can help you understand the performance and usage of your resources, and make data driven decisions to support your customers and workloads.
To help you get started, you will use a simple example of collecting data about open files, and see how to install and configure both collectd and the CloudWatch agent using AWS Systems Manager (SSM) to allow you to manage this process across multiple servers. You can then explore metrics of relevance to you and configure collectd accordingly.
Intro to Amazon CloudWatch
Amazon CloudWatch monitors your AWS resources and the applications you run on AWS in real-time. You can use CloudWatch to collect metrics, logs, traces, set up alarms, create synthetic checks, and more. The information you collect lets you observe, validate, and alert on data related to areas such as performance, errors, debugging, or root cause analysis.
Many AWS services send default metrics to CloudWatch, enabling you to get insight into your resources without any additional configuration or cost. For the Amazon EC2 service, there are a variety of metrics including CPU utilization, disk read/write and network metrics.
Further metrics can be gathered for Amazon EC2 instances using the CloudWatch agent. These additional metrics include supplementary CPU metrics, as well as metrics for disk and memory. You can also utilize collectd to gather metrics which may not be available through the CloudWatch agent alone.
What is collectd?
collectd allows you to collect system and application performance metrics from a Linux OS. collectd is an open source project, and provides a daemon for data collection. You can configure collectd so that the CloudWatch agent can capture the data and send it to the CloudWatch service. Once the collectd data is in CloudWatch, you can search, aggregate, visualize, and alarm on your data, or combine it with other CloudWatch data. By combining the system metrics that the CloudWatch agent can already collect with the additional metrics from collectd, you can better monitor, analyze, and troubleshoot your systems and applications.
In this example the focus is on using collectd and CloudWatch with Amazon EC2s, but both collectd and the CloudWatch agent can be used in hybrid and on-premises environments. In a traditional on-premises environment you may want to collect hardware level metrics such as CPU temperature and physical disk power cycles and bad sectors. The metrics can also be utilized at a higher level of abstraction such as JVM specific monitoring.
To specify the metrics you want to collect, you configure the appropriate collectd plugin. There are over 100 plugins available, which cover a broad range of areas including networking, or technology focused plugins, like Apache, Java and MySQL. For example, the Apache plugin can collect data on the number of request received, or the number of bytes transferred; the Processes plugin can collect data on the number of processes of a specific name, or the number of open files (Linux only); and the Users plugin lets you collect the number of users currently logged into the system. Here you will collect data about the number of open files using the fhcount plugin. Typically, there is a limit on the number of open files, and if one process has too many open files this can have an impact on other processes.
CloudWatch and collectd working together
You will use Systems Manager State Manager and Parameter Store to install/configure both collectd and the CloudWatch agent on the Amazon EC2 instances. This allows you to run the install/config on multiple servers at once, without the need to login to the servers individually. Using State Manager also allows us to set a schedule to reapply our setup, allowing us to keep the CloudWatch agent up to date, reapply the configurations in case they have been removed, or apply new configurations on a desired schedule. If this is not desirable you can still use State Manager without a schedule.
Utilizing Systems Manager the workflow is:
Step 1: Permissions: add CloudWatch and Systems Manager permissions to the Amazon EC2 role
Step 2: Create configurations for collectd and CloudWatch agent
Step 3: Store configurations in Parameter store
Step 4: Install/configure with State Manager for collectd and CloudWatch agent
Step 5: Check metrics are ingesting
Step 6: Create alarms/dashboards
![Diagram showing the workflow for configuration of collectd and CloudWatch agent. Steps are: create permissions, create configurations, store configurations in parameter store, use state manager to install and configure collectd and CloudWatch agent, check CloudWatch for metrics, create CloudWatch dashboards and alarms.]](https://d2908q01vomqb2.cloudfront.net/972a67c48192728a34979d9a35164c1295401b71/2023/08/10/CollectdArchticture.png)
Figure 1: Diagram showing the workflow for configuration of collectd and CloudWatch agent
Step 1: Permissions
You will need the following policies as part of the AWS Identity and Access Management (IAM) role for the Amazon EC2 instances.
- CloudWatchAgentServerPolicy: allows the CloudWatch agent to write data to CloudWatch.
- AmazonSSMManagedInstanceCore: for core Systems Manager functionality.
For guidance on how to do this in the console see the documentation on Creating IAM roles to use with the CloudWatch agent on Amazon EC2 instances.
Step 2: Create configurations
You will use basic configurations for both collectd and the CloudWatch agent to keep things simple for getting started. You can modify the configurations to collect additional data. We describe both configurations and show you how to store them within Systems Manager Parameter Store.
Step 2.1: collectd configuration
For collectd, you need to create configuration details for the desired plugins. Here you configure the network and fhcount plugins. You can also set a global value for the collection interval of 60s. You can explore the different global options available in the collectd documentation.
The network plugin allows collectd to act as a server and expose metrics on a TCP port. The CloudWatch agent gets data from host 127.0.0.1 and port 25826 by default.
Note that you can set the SecurityLevel property for the network plugin – the default is None. If you change this value, you will also need to change the security level for collectd in the CloudWatch agent configuration. We will highlight this when we discuss the CloudWatch agent configuration.
The fhcount plugin provides statistics about used, unused, and total number of file handles on Linux. You can collect the data as absolute values, percentages, or both.
It’s worth noting here that within CloudWatch you pay for metric data based on how many unique metrics you collect, so set your configuration so you collect and pay for only what you need.
- ValuesAbsolute = true will create 3 metrics for the count of file handles used/unused/max value.
- ValuesPercent = true will create 2 metrics for the used and unused percent of file handles.
Refer to the collectd documentation for the configuration options for specific plugins.
Step 2.2: CloudWatch agent configuration
The configuration for the CloudWatch agent has 3 main sections: agent, metrics, and logs. You only need the metrics section to gather the collectd metric data.
You need to specify that you want metrics from collectd using the collectd property within the metrics_collected field.
You don’t have to specify anything in the collectd section, but we have chosen to specify the following:
- collectd_security_level: With the collectd configuration for the network plugin, the data will be sent unencrypted by default. However, the CloudWatch agent looks for encrypted data by default. They have to match so the data can be collected, which is done by telling the CloudWatch agent the data will not be encrypted using a value of “none”.
Note: If you specify a value for the SecurityLevel property in the collectd configuration for the network plugin, you must make the appropriate change to the collectd_security_level property for the CloudWatch agent. - metrics_aggregation_interval: Regardless of the frequency specified in the collectd configuration, we tell the CloudWatch agent to aggregate the data into a single data point every 60 seconds. You can choose no aggregation by setting this to 0.
Step 3: Store configurations in Parameter Store
You will store the configurations in Systems Manager Parameter Store. When you use State Manager to do the setup, it will get the configuration details from Parameter store. This allows you to have a central store of the configurations which you can easily reuse and update as needed.
For each of the two configurations above, create a parameter in Parameter Store.
From the Systems Manager console choose Parameter Store, and Create parameter.
-
- Name each parameter, for example:
- collectd-config
- cloudwatch-config-forcollectd
- Choose a Tier of Standard, and a Type of String.
- Copy and paste the appropriate configuration (from above) into the Value box.
- Choose Create parameter to save.
- Name each parameter, for example:
For more details see the AWS documentation on Creating Systems Manager parameters.
A note on naming in Systems Manager Parameter Store: the name you use for the parameter depends on the permissions in the Amazon EC2 IAM role. You need two policies on the Amazon EC2 instances.
- The CloudWatchAgentServerPolicy policy enables reading from parameters starting with “AmazonCloudWatch-“.
- The AmazonSSMManagedInstanceCore policy allows reading of any parameter name.
As both policies are used, you have freedom with the names you choose for the parameters.
Step 4: Install/configure with State Manager
Before you do the installation and configuration of collectd using Systems Manager, we will briefly look at how to do this manually so you can see the connection between the manual commands and the setup for Systems Manager. We won’t walk through the manual configuration for the CloudWatch agent, as Systems Manager has predefined documents for this.
collectd: manually
If installing collectd manually, you would ssh into your Amazon EC2 instance and run the following commands:
- Install collectd
sudo amazon-linux-extras install collectd
Note that this is for Amazon Linux 2, and other distros may have a different method of installation. - Use the configuration above and replace the contents of the file at /etc/collectd.conf
sudo vi /etc/collectd.conf
and use the collectd configuration from above. - Start the collectd agent
sudo systemctl start collectd.service
You can use this to do a manual setup of collectd on a single server, but this is not feasible if you have multiple servers, or you want to automate updates. For this, you can use State Manager Associations (part of Systems Manager).
Step 4.1: collectd: State Manager association
You create a State Manager association to run the setup on the required instances. Note that the association will run as soon as you have created it.
From the State Manager Console, choose to Create association and use the following values:
-
- Name: LinuxCollectdSetup (you can use any name you wish)
- Document: AWS-RunShellScript (ensure to select using the radio button, not by clicking on the document name)
- Parameters:
Commands
-
- Target selection: select the desired instances
- Specify schedule: choose as appropriate (you can modify this later)
Leave everything else as default.
Within the commands section you run almost the same commands as you would manually. There are two differences:
- Line 2: added a stop service so that if collectd already exists, and is running, the new configuration will still be applied. This means you can use the same association to update the collectd config at a later time.
- Line 3: rather than editing the configuration file manually on the Amazon EC2 instance, you get the Value of the collectd-config parameter from Parameter Store, and place the contents in the /etc/collectd.conf file.
Choose to Create Association. You will be returned to the State Manager Associations list – find the association (LinuxCollectdSetup) and wait until the status changes from Pending to Success (refresh the association table to see status changes).
Notes:
- Status shows as failed: some common issues are highlighted in the What’s Next? section of this post.
- Permissions: In order for the State Manager association to read from Parameter store it needs permissions for ssm:GetParameters. This action is included in the AmazonSSMManagedInstanceCore policy, which is also needed for the instance to work with Systems Manager.
- Instance selection: As part of creating this association you specified the instances you wished to include. You can do this by picking them manually, by tag, resource group, or choose all. Consider selecting instances by tags or resource groups. Think about how you want to update the servers in the future, i.e. by environment, application etc., and choose tags accordingly for that group of instances. Similarly, consider when you want to update instances and set an appropriate schedule or choose to run the association manually.
Step 4.2: CloudWatch agent: State Manager association
Systems Manager has two predefined documents which contain the instructions for installation and configuration of the CloudWatch agent. This means you don’t have to worry about the commands needed to do this, you just need to know which document to use, and where the CloudWatch agent configuration is stored.
You create a separate association for each of the install and configuration steps, as they use separate documents to allow you more control over the process.
Create an association for the CloudWatch agent installation.
From the State Manager Console, and use the following values:
-
- Name: LinuxCloudWatchInstall (you can use any name you wish)
- Document: AWS-ConfigureAWSPackage
- Parameters:
- Action: Install
- Name: AmazonCloudWatchAgent
- Target selection: select the desired instances
- Specify schedule: choose as appropriate (you can modify this later)
Choose to Create Association. You will be returned to the State Manager Associations list – find the association (LinuxCloudWatchInstall) and wait until the status changes from Pending to Success.
Create another association for the CloudWatch agent configuration.
From the State Manager Console, and use the following values:
-
- Name: LinuxCloudWatchConfig (you can use any name you wish)
- Document: AmazonCloudWatch-ManageAgent
- Parameters:
- Action: configure
- Mode: ec2
- Optional Configuration Source: ssm
- Optional Configuration Location: cloudwatch-config-forcollectd (or whatever you called the parameter created earlier for the CloudWatch agent configuration)
- Optional Restart: yes
- Target selection: select the desired instances
- Specify schedule: choose as appropriate (you can modify this later)
Choose to Create Association. As before, you will be returned to the State Manager Associations list – find the association (LinuxCloudWatchConfig) and wait until the status changes from Pending to Success.
Step 5: Check metrics are ingesting
CloudWatch metrics are defined by a unique combination of a namespace, dimensions, and metric name. Metrics from the CloudWatch agent come in under the custom namespace of CWAgent (default Amazon EC2 metrics are under the AWS namespace of EC2). Note that you can control this by using the namespace property in the metrics section of CloudWatch agent configuration.
Navigate to the CloudWatch console and choose Metrics > All Metrics. Choose the custom namespace called CWAgent.
Next you will see the different dimensions the metrics have (how the metric is grouped). For this example you will see host, type, type_instance. Within this you will see all the collectd metrics which have been ingested. If you see no metrics, wait a few minutes and refresh the console.
Select one or more metrics to see a graph of the metrics. Below, the count of open files for two EC2 instances have been selected. This metric has metric name=collectd_fhcount_value, type=file_handles and type_instance=used. You can then choose to add this to a CloudWatch dashboard from Actions > Add to dashboard.
![CloudWatch console showing two metrics selected to graph the average open file count for 2 different instances.]](https://d2908q01vomqb2.cloudfront.net/972a67c48192728a34979d9a35164c1295401b71/2023/08/11/graph-simple-metric-masked.png)
Figure 2: CloudWatch console showed metrics selected for graphing
The AWS documentation contains more information about graphing metric data in a CloudWatch dashboard. You can also learn more about other capabilities in CloudWatch dashboards from creating and working with widgets on CloudWatch dashboards including how to create metric number widgets, gauge widgets, metric line (time chart) widgets, and text widgets.
Step 6: Create alarms/dashboards
Now you have your data in CloudWatch, you can use it like any other metrics. For example you can query and aggregate the data, set up alarms, and visualize your data on dashboards.
For CloudWatch dashboards, you can create visualizations of your data using metric math and metric insights queries. If you want to explore how you can search, aggregate and combine your CloudWatch metric data, the AWS documentation contains more on Using Amazon CloudWatch metrics.
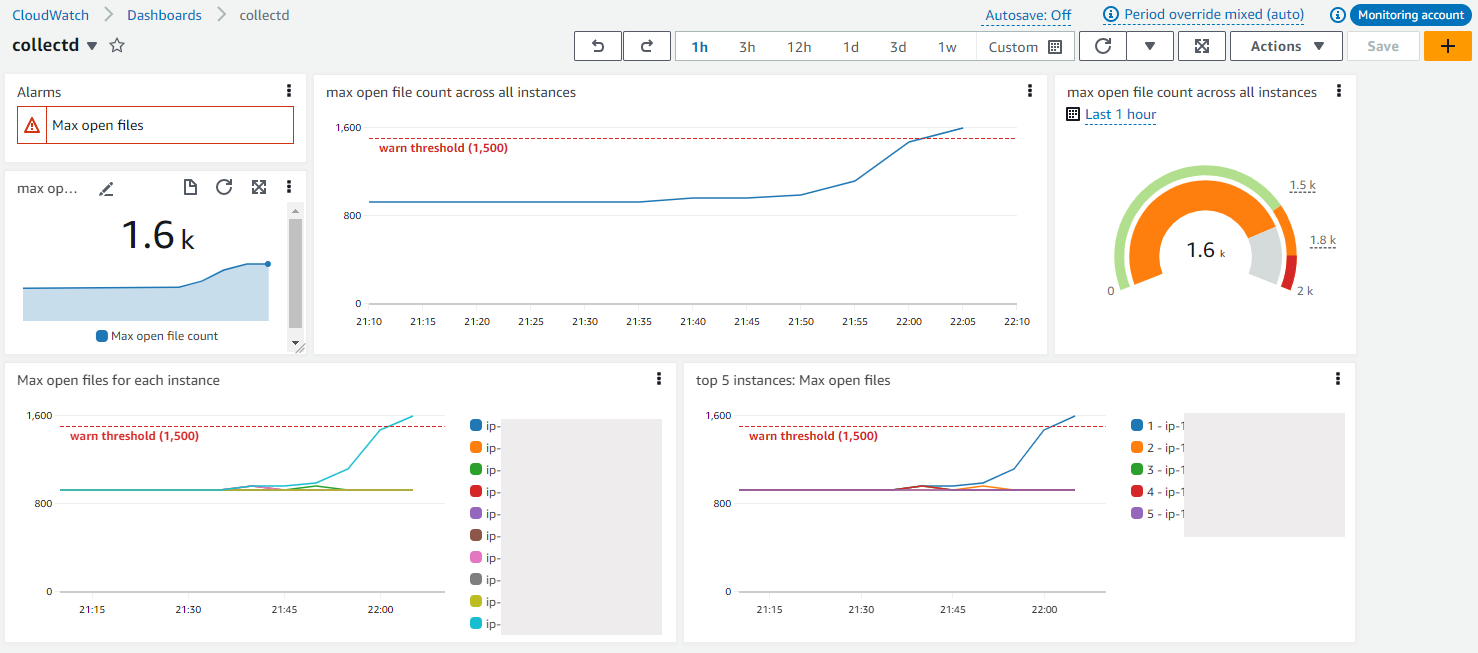
Figure 3: CloudWatch dashboard showing several visual representations of the open files data from collectd
Here are some example queries to use on your CloudWatch dashboard.
In all of these examples we are using the metric which has a metric name=collectd_fhcount_value with type=file_handles and type_instance=used, which is the count of open files for the specified host. You can write similar queries with the other metrics.
Note that the Metric Math queries include a period of 300s, or 5 minutes.
The max open file count across all instances.
Metric Insights
SELECT MAX(collectd_fhcount_value) FROM SCHEMA(CWAgent, host, type, type_instance) WHERE type = 'file_handles' AND type_instance = 'used'
Metric Math
MAX(SEARCH('{CWAgent, host, type, type_instance} MetricName="collectd_fhcount_value" type="file_handles" type_instance="used"', 'Maximum', 300))
In the dashboard above this data is shown with 3 different display styles – a number widget with a sparkline, a line chart, and a gauge widget with a warning threshold set of 1500.
The max open file count for each instance.
The maximum value is shown for each period, which you can change with the Period dropdown in the Graphed metrics tab.
Metric Insights
SELECT MAX(collectd_fhcount_value) FROM SCHEMA(CWAgent, host, type, type_instance) WHERE type = 'file_handles' AND type_instance = 'used' GROUP BY host
Metric Math
SEARCH('{CWAgent, host, type, type_instance} MetricName="collectd_fhcount_value" type="file_handles" type_instance="used"', 'Maximum', 300)
The max open file count for the top 10 instances.
Metric Insights
SELECT MAX(collectd_fhcount_value) FROM SCHEMA(CWAgent, host, type, type_instance) WHERE type = 'file_handles' AND type_instance = 'used' GROUP BY host ORDER BY MAX() DESC LIMIT 10
Metric Math
SORT(e1, MAX, DESC, 10)
Where e1 is
SEARCH('{CWAgent, host, type, type_instance} MetricName="collectd_fhcount_value" type="file_handles" type_instance="used"', 'Maximum', 300)
You can also create CloudWatch alarms from your metric data. You can choose to create alarms with a static threshold (either based on a single metric, or on the results of a metric insights query), or you can use anomaly detection.
With anomaly detection alarms, CloudWatch creates a model based on the past behaviour of the metric, and can alert you when the behaviour is outside what it considers normal. This is useful for metrics where there is no specific threshold for you to be concerned about, but a change in behaviour might need to be actioned. Our example of open files would be a good example to use anomaly detection alarms for.
For all CloudWatch alarms you can create actions based on an alarm state change. Several types of actions are possible, including an email notification or an autoscaling action. You can also capture CloudWatch alarm events using Amazon EventBridge and use it to run automation with services like AWS Lambda.
You can also add alarm widgets to your CloudWatch dashboards so you can see the current alarm state. The example dashboard above contains an example of this.
What’s Next?
Here are some areas you can explore further.
Customize the metric names to separate data
The names of the metrics you collect are defined by collectd. You will notice in our example they start with collectd_. The name_prefix field in the CloudWatch agent configuration allows you to add replace this with your own custom prefix. Below, the prefix of ecom_ is used to describe the application this data belongs to.
There is no append_dimensions option to use with individual collectd metrics to add custom dimensions, but using the name_prefix you can distinguish the data from different sources.
You can still use the append_dimensions field to add specific dimensions to all our fields – shown below with a dimension for the InstanceId.
How to see errors in associations
From the State Manager Console choose the desired association and View details. The status of the last association run is shown here.
To see the reasons for failures, or to explore previous runs, select the Execution history tab, and choose the appropriate execution id. You will see a list of all resources acted on within this run and the status. You can choose Output for each one to view both the output and errors.
Common Errors
- No output or errors
- Check the Region for your parameter store, Amazon EC2s, and State Manager Association are the same.
- Error: amazon-linux-extras: command not found
- Ensure you are using an Amazon Linux 2 AMI, or update the commands for your AMI for the State Manager association responsible for the collectd installation/configuration.
- Failure when running the CloudWatch agent configuration. Association output shows Error: Error running agent: Error loading config file /opt/aws/amazon-cloudwatch-agent/etc/amazon-cloudwatch-agent.toml: error parsing socket_listener, open /usr/share/collectd/types.db: no such file or directory
- It is looking for a collectd file which does not exist. Check you have the collectd set up and running before you configure collectd in the CloudWatch agent. You can run the association for collectd and then rerun the association for the CloudWatch agent configuration.
Costs and Cleanup
To avoid charges to your account, delete the resources that you created:
- Delete the EC2 instances
- Remove the IAM Policies added for your EC2 instance or delete the IAM role
- CloudWatchAgentServerPolicy and AmazonSSMManagedInstanceCore
- Delete the Systems Manager parameters
- collectd-config and cloudwatch-config-forcollectd
- Delete the State Manage associations
- LinuxCollectdSetup, LinuxCloudWatchInstall and LinuxCloudWatchConfig
- Delete the CloudWatch dashboard
- From the dashboard, choose Actions > Delete dashboard
- Delete the CloudWatch alarms
You cannot delete CloudWatch metrics. They will expire based on the retention schedule explained in the FAQ, What is the retention period of all metrics. There is no charge for metric storage, only ingestion.
Conclusion
In this post we have shown you how to do a basic setup of collectd and the Amazon CloudWatch agent on an Amazon EC2 Linux instance, in order to collect metrics about open files. We have also shared some examples of what you can do with this data on CloudWatch dashboards and alarms.
We encourage you to explore your own use cases, what visualizations or actions you would like to take, and therefore what data you need to support this. Explore the default data collected on different resources in CloudWatch, and the other plugins you can use with collectd.
Some resources that may be useful to you:
- CloudWatch and collectd
- CloudWatch agent configuration
- First steps with collectd
- Blog: Deliver Java JMX statistics to Amazon CloudWatch using the CloudWatch Agent and CollectD
- Blog: How to better monitor your custom application metrics using Amazon CloudWatch Agent
Want to learn more about Observability using AWS?
- Hands-on exploration of CloudWatch with the One Observability Workshop
- AWS Observability Best Practices