AWS Cloud Operations Blog
Monitoring Cisco CSR 1000v VPN tunnel and BGP status using Amazon CloudWatch
Many organizations get access to their AWS resources using a Direct Connect connection or a Site-to-Site VPN. AWS Site-to-Site VPN creates a secure connection between your data center or branch office and your AWS cloud resources. In this post, we will see how to monitor your Cisco CSR VPN tunnel and BGP (Border Gateway Protocol) peer status using CloudWatch agent and continuously monitor metrics and logs to detect, correlate anomalies to track down the issues and can reduce troubleshooting time.
AWS Virtual Private Network solutions establish secure connections between your on-premises networks, remote offices, client devices, and the AWS global network. AWS VPN contains two services: AWS Site-to-Site VPN and AWS Client VPN. Together, they deliver a highly available, managed, and elastic cloud VPN solution to protect your network traffic.
AWS Site-to-Site VPN creates encrypted tunnels between your network and your Amazon Virtual Private Cloud (VPCs) or AWS Transit Gateways. For managing remote access, AWS Client VPN connects you to AWS or on-premises resources using a VPN software client.
Most companies that use site-to-site VPNs have the service set up by a business security solutions company such as Cisco, Palo Alto Networks, or Checkpoint. Typically, the site-to-site VPN is just one part of a larger package of security services.
Some of the key factors to consider when deciding if a Site-to-Site VPN is right for your company are:
- size of the business
- number of locations
- geographical spread (how far apart locations are from each other)
- resource-sharing requirements
Since we rely on Site-to-Site VPN VPN connection to operate business, availability/observability of key component of site-to-site VPN becomes very critical for smooth operation of business. To maintain the uptime, you should collect monitoring data from all of the parts of VPN solution so that you can more easily debug a multi-point failure if one occurs.
In this post, we demonstrate how this monitoring can be achieved for a VPN-based solution using Amazon CloudWatch. We walk you through all the steps required to set up the monitoring infrastructure, including dashboards to monitor VPN resources in single view and alarms to send notifications if VPN status changes. To capture and publish the VPN metrics required for monitoring, we utilize the scripts published by Cisco DevNet team in Cisco DevNet GitHub repository. We customize the scripts to fit our monitoring needs for BGP peer and VPN tunnel status.
More information can be found on the AWS Marketplace for Cisco CSR 1000v.
Solution overview
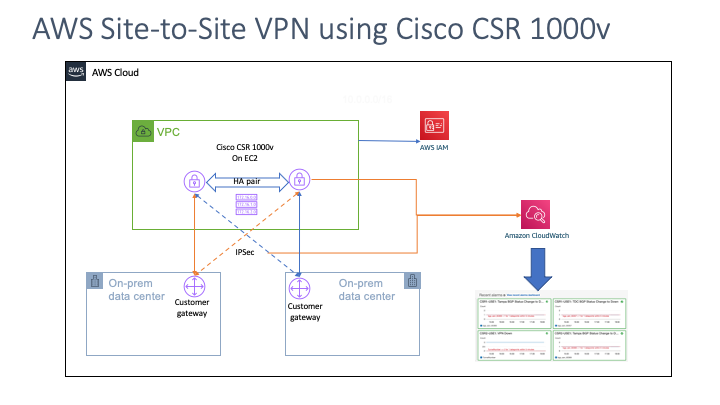
Figure-1: Cisco CSR 1000v in HA pair in AWS
This highly available design deploys two VPN appliances (Cisco CSR 1000v instances) into separate Availability Zones of a dedicated VPC. Customers can choose to automatically create a new VPC or to use an existing VPC. This design uses VPN connections to enable routing between any connected network, including external networks or VPCs in other AWS Regions. VGW (Virtual Private Gateway) connects to the transit VPC using redundant, dynamically routed VPN connections between their customer gateways and the CSR instances. This design supports dynamic routing protocols using BGP, which customers can use to automatically route traffic around potential network failures as well as to propagate network routes to remote networks.
Note that all communication with the CSR instances, including the VPN connections between corporate data centers or other provider networks and the transit VPC, uses the transit VPC Internet gateway and the instances’ Elastic IP addresses. Each CSR instance has an associated Amazon CloudWatch alarm if the underlying EC2 hardware fails.
Prerequisites
- You have an AWS account and have already set up a VPC
- Cisco CSR VPN tunnels and BGP configuration are already applied based on your environment
Steps to set up the monitoring for Cisco CSR 1000v
Step 1:
Separately, you can expedite this process to add a Cisco CSR in your environment using the following CloudFormation template
---

AWSTemplateFormatVersion: '2010-09-09'
Description: 'Create Cisco CSR 1000v template'
Parameters:
  KeyName:
    Description: Name of an existing EC2 KeyPair to enable SSH access to the instance
    Type: AWS::EC2::KeyPair::KeyName
  VpcId:
    Type: AWS::EC2::VPC::Id
    Description: VpcId of your existing Virtual Private Cloud (VPC)
  SubnetId:
    Type: AWS::EC2::Subnet::Id
    Description: SubnetId of an existing subnet in your Virtual Private Cloud (VPC)
Resources:
  IPAssoc:
    Type: AWS::EC2::EIPAssociation
    Properties:
      InstanceId: !Ref Ec2Instance
      AllocationId: <EIP-association-ID>
  InstanceSecurityGroup:
    Type: AWS::EC2::SecurityGroup
    Properties:
      VpcId:
        Ref: VpcId
      GroupDescription: Enable SSH access via port 22
      SecurityGroupIngress:
      - IpProtocol: tcp
        FromPort: '22'
        ToPort: '22'
        CidrIp: <MyIP>
      SecurityGroupEgress:
      - IpProtocol: tcp
        FromPort: '443'
        ToPort: '443'
        CidrIp: 0.0.0.0/0
          # Ref: SSHLocation
  Ec2Instance:
    Type: AWS::EC2::Instance
    Properties:
      ImageId: <CSR_AMI_ID_from_respective_Region>
      InstanceType: <Instance_Type>
      Tags:
        - Key: Name
          Value: <Name_Of_Your_CSR>
      BlockDeviceMappings:
        - DeviceName: /dev/xvda
          Ebs:
            VolumeSize: '10'
            DeleteOnTermination: 'false'
            Encrypted: 'true'
            KmsKeyId: <Your_KMS_Key_ID>
      SourceDestCheck: 'false'
      DisableApiTermination: 'true'
      SecurityGroupIds:
      - Ref: InstanceSecurityGroup
      SubnetId:
        Ref: SubnetId
      KeyName:
        Ref: KeyName
Outputs:
  InstanceId:
    Value:
      Ref: Ec2Instance
    Description: Instance Id of newly created instance
Step 2:
Once Cisco CSR is set up, you can login into Cisco CSR using SSH key into EC2 instance (Amazon Elastic Compute Cloud) and enable guest shell for python monitoring script to work. Refer to this
Guestshell is required for AWS cloudwatch agent to work and monitor critical VPN components.
- To enable guest-shell on CSR on AWS
ios-prompt# guestshell enable VirtualPortGroup 0 guest-ip 192.168.35.2 name-server 8.8.8.8
Please wait for completion
2. Once Guest shell is enabled, you can invoke the guestshell using guestshell command line option.
ios-prompt# guestshell
3. From guestshell we can initiate to bring default python monitoring scripts provided by Cisco
[guestshell@guestshell ~] $ sudo pip install csr_aws_guestshell
This step will bring all the necessary python scripts from GitHub link
Step 3:
Once guestshell is enabled and verified, you can check that the correct IAM (AWS Identity and Access Management) role is created and attached with Cisco CSR EC2 instance. An appropriate IAM role is required for EC2 instance to publish the metrics into AWS CloudWatch metrics.
Sample cloud formation to create the role with appropriate policy
 ---
Resources:
  CsrIamRoleProd:
    Type: AWS::IAM::Role
    Properties:
      AssumeRolePolicyDocument:
        Version: '2012-10-17'
        Statement:
        - Effect: Allow
          Principal:
            Service:
            - ec2.amazonaws.com
          Action: sts:AssumeRole
          Condition:
            StringEquals:
              sts:ExternalId: '123456789'
      ManagedPolicyArns: []
      Policies:
      - PolicyName: csr-iam-policy-prod
        PolicyDocument:
          Version: '2012-10-17'
          Statement:
          - Action:
            - logs:CreateLogStream
            - logs:PutLogEvents
            - logs:DescribeLogStreams
            - logs:DescribeLogGroups
            - logs:CreateLogGroup
            Effect: Allow
            Resource: arn:aws:logs:*:*:log-group:/csr-router-log/*:log-stream:*
          - Action:
            - cloudwatch:GetMetricData
            - cloudwatch:DescribeAlarmsForMetric
            - cloudwatch:GetMetricStatistics
            - cloudwatch:ListMetrics
            Effect: Allow
            Resource: "*"
      RoleName: csr-iam-role
Once we use the previously mentioned CloudFormation template for role creation, make sure to check the box in the CloudFormation note that appears related to IAM roles, shown in the following picture. If you don’t acknowledge IAM check box, the CloudFormation stack will fail.

Access the new role in IAM and validate that the IAM role and policy exist and are correct.

Step 4:
Once the correct IAM role is attached with Cisco CSR ec2 instance, you can manually validate your setup by running the following python script. If the IAM role is set up correctly, the python script will send the metrics into CloudWatch metrics section under CSR instance.
- Below guestshell python script will help you get your ec2 instance information
guestshell>get-metadata.py
{
"ami-id": "ami-1234abcd",
"ami-launch-index": "0",
"ami-manifest-path": "(unknown)",
"block-device-mapping": {
"ami": "/dev/xvda",
"root": "/dev/xvda"
},
"hostname": "ip-XXX-XX-XX-XXX.ec2.internal",
- Retrieves statistics from cli and publishes them to CloudWatch
guestshell>get-stat-drop.py
This step will send metrics CloudWatch in the AWS Management Console.
- You can run the python command from IOS prompt or from guestshell. Both the examples are given below.
-
- Run the command from guestshell
guestshell>monitor-vpn.py
TunnelNumber is 2
2. Run the command from IOS prompt
csr2-use1#guestshell run monitor-vpn.py
TunnelNumber is 2
csr2-use1#
The above metrics are sent to CloudWatch endpoint and can be validated accessing CloudWatch Console under metrics for CSR instance
Note: In case of issue with the python code or IAM permission, the python code will throw exception errors related to permission issues.
Step 5:
After we validated python scripts are working and metrics are visible on the CloudWatch console, we can schedule following script to run on regular intervals
event manager applet CSR1-USE1-Stats
event timer watchdog time 120 action 0.0 cli command "enable"
action 1.0 cli command "guestshell run get-stat-drop.py"
action 2.0 cli command "guestshell run monitor-vpn.py"
Note: You can check the router logs in Cisco CSR ec2 instance under “/var/log/messages” if the scheduled action is getting executed as expected.
Step 6:
Go into the CloudWatch console. You should be able to see metrics under CSR instance

Step 7:
The default code from GitHub doesn’t provide monitoring capability for BGP. You can use the following custom python code to monitor BGP.
edit get-stat-drop.py (Choose your unix editor, vi, nano, etc.)
Add following function in the file anywhere
def get_bgp_state(print_output):
    cmd_output = execute_command(
        "show ip bgp neighbors", print_output)
    tunnel_states = cmd_output.split('BGP neighbor is ')
    for tunnel_state in tunnel_states:
        for line in tunnel_state.splitlines():
            if 'remote AS' in line:
                as_number = re.search(r'remote AS (\d+)', line).group(1)
            if 'BGP state =' in line:
                if 'UP' in line.upper():
                    csr.send_metric("bgp_asn_"+as_number, 1, "BGP State")
                else:
                    csr.send_metric("bgp_asn_"+as_number, 0, "BGP State")
Add following snippet in main function at the end.
if args.category in ["all", "bgp_status"]:
get_bgp_state(args.display)
updated get-stat-drop.py
On the next run, you should be able to see BGP metrics showing in CloudWatch metrics for Cisco CSR EC2 instance. You can select the metrics for BGP status so the graph shows a consistent line, meaning the data is being received. If metrics are not sent from Cisco CSR (either tunnel is down or connectivity issue with EC2 instance), the line will be set on “0”, as shown in picture below:

Step 8:
Set up an alarm based on the metrics you see on the cloudwatch metrics tab for Cisco CSR instance
Example: if you have a three VPN tunnel, you want to setup your alarm status when number of VPN tunnels goes below three.
The following screen shows a configuration with a three VPN tunnel.

Step 9:
Set up alerts and notifications. In this step, you will use a CloudFormation template to set up an SNS topic and subscription related to alerts of a VPN failure.
This CloudFormation template shown below creates an Amazon Simple Notification Service (SNS) topic and subscription:
Resources:
  CsrMonitoringNotification:
    Type: AWS::SNS::Topic
    Properties:
      DisplayName: CSR-VPN-Monitoring
      Subscription:
        - Endpoint: 'someone@email.com'
          Protocol: email-json
      TopicName: CSR-VPN-Monitoring
  emailSubs:
    Type: AWS::SNS::Subscription
    Properties:
      Endpoint: someone@email.com
      Protocol: email-json
      TopicArn: !Ref 'CsrMonitoringNotification'
Once above Cloudformation is ran, you should be able to see email notification is sent to user and waiting for confirmation. Below image is snipper from Amazon SNS(Simple Notification Services)
Step 10:
Now we are able to see metrics on CloudWatch console, its time to set up alarms based on the criteria you define in your CloudWatch console.
- In the CloudWatch console "Alarm" --> Create Alarm
- Select Metrics
- Select instance (csr1000)
- You should be able to see all the metrics published from Cisco CSR 1000v instance
- Select VPN tunnel status from metrics for Cisco CSR instance
- You should be able to see historical metrics in graph (as shown below). Ideally you should see one straight line, in case there is an incidence, you will see line is dropping down to lower number.

- Define the Condition, how often you want to check for the status, and who you want to notify upon an event
- Specify the name of the Alarm and description for the alarm
- Preview and confirm
Step 11:
In the event that a VPN tunnel goes down, the respective email distribution team that needs to be notified when a BGP has an issue will receive an email. The email will have details about tunnel and BGP pair.
Sample email:
From: SNS Topic <no-reply@sns.amazonaws.com>
Date: Fri, Aug 21, 2020 at 12:03 PM
Subject: [E] ALARM: "CSR-VPN-Down" in US East (N. Virginia)
To: <someone@email.com>
You are receiving this email because your Amazon CloudWatch Alarm "CSR-VPN-Down" in the US East (N. Virginia) region has entered the ALARM state, because "Threshold Crossed: 1 out of the last 1 datapoints [2.0 (21/08/20 19:03:00)] was less than or equal to the threshold (2.0) (minimum 1 datapoint for OK -> ALARM transition)." at "Friday 21 August, 2020 19:03:26 UTC".
View this alarm in the AWS Management Console:
<CloudWatch_Console_URL>
Alarm Details:
- Name:                       CSR-VPN-Down
- Description:                Test
- State Change:               OK -> ALARM
- Reason for State Change:    Threshold Crossed: 1 out of the last 1 datapoints [2.0 (21/08/20 19:03:00)] was less than or equal to the threshold (2.0) (minimum 1 datapoint for OK -> ALARM transition).
- Timestamp:                  Friday 21 August, 2020 19:03:26 UTC
- AWS Account:                123456789
- Alarm Arn:                  arn:aws:cloudwatch:us-east-1:123456789
:alarm:CSR-VPN-Down
Threshold:
- The alarm is in the ALARM state when the metric is LessThanOrEqualToThreshold 2.0 for 10 seconds.
Monitored Metric:
- MetricNamespace:                     csr1000v
- MetricName:                          TunnelNumber
- Dimensions:                         [InstanceId = i-123456789]
- Period:                              10 seconds
- Statistic:                           Average
- Unit:                                not specified
- TreatMissingData:                    missing
State Change Actions:
- OK:
- ALARM: [arn: aws:sns:us-east-1:123456789:csr-vpn-tunnel-status]
- INSUFFICIENT_DATA:
Step 12:
When you log in to the CloudWatch service, you get an option to create your own custom dashboard for the key alarms or metrics you want to see to check overall health of your VPN service.
Select CloudWatch service Dashboard. If you have created a custom dashboard for all the alarms you want to see every day, your default dashboard will look like this:
Troubleshooting:
- When a monitoring python script executes in guestshell, memory from guestshell may run out of capacity. This is because of small amount of memory is allocated to guestshell.
Error:
Aug 24 23:17:37.833: %IOSXE-3-PLATFORM: R0/0: kernel: Memory cgroup out of memory: Kill process 32180 (monitor-vpn.py) score 53 or sacrifice child *Aug 24 23:17:37.833: %IOSXE-3-PLATFORM: R0/0: kernel: Killed process 32180 (monitor-vpn.py) total-vm:140764kB, anon-rss:26880kB, file-rss:908kB, shmem-rss:0kB
Known issue : https://quickview.cloudapps.cisco.com/quickview/bug/CSCvq90876
- Check current memory allocation and usage
csr2-use1#show app-hosting utilization appid guestshell
Application: guestshell CPU Utilization:
CPU Allocation: 800 units
CPU Used: 0.00 %
Memory Utilization:
Memory Allocation: 256 MB
Memory Used: 127248 KB
Disk Utilization:
Disk Allocation: 1 MB
Disk Used: 0.00 MB
- Depending upon instance type you are using, you can allocate some extra memory for the guest shell by editing the configuration with following steps:
csr2-use1(config)#app-hosting appid guestshell
csr2-use1(config-app-hosting) #resource profile custom cpu 800 memory 1024
csr2-use1(config-app-hosting) #end
csr2-use1#guestshell disable Guestshell disabled successfully

csr2-use1#guestshell enable Interface will be selected if configured in app-hosting
Please wait for completion guestshell activated successfully
Current state is: ACTIVATED
guestshell started successfully Current state is: RUNNING
Guestshell enabled successfully

csr2-use1#show app-hosting utilization appid guestshell
Application: guestshell

CPU Utilization:
CPU Allocation: 800 units
CPU Used: 0.00 %

Memory Utilization:
Memory Allocation: 1024 MB
Memory Used: 127628 KB

Disk Utilization:
Disk Allocation: 1 MB
Disk Used: 0.00 MB
Conclusion:
In this post, we saw how to start monitoring your Cisco CSR VPN tunnel and BGP peer status using CloudWatch agent. CloudWatch agent installed on Cisco CSR continuously monitors metrics and logs to detect and correlate anomalies and errors. With this tool, identifying and tracking down this issue takes a lot less manual effort and can reduce downtime if there are issues, especially in production scenarios where it is critical to address any issues, minimizing the downtime of any production service.