AWS Cloud Operations Blog
Using Generative AI to Gain Insights into CloudWatch Logs
Have you ever been investigating a problem and opened up a log file and thought “I have no idea what I am looking at. If only I could get a summary of the data.”
Observability and log data play an important role in maintaining operational excellence and ensuring the reliability of your applications and services. However, understanding log data can be a challenge. Typically log data comes from multiple systems, containing different information, in a variety of formats, and exploring this data requires knowledge of the logs and the query language for your observability tool. Add to this the volume of log data generated by modern systems, and understanding your log data can become overwhelming.
In this blog post, you will explore how to use Generative AI to summarize Amazon CloudWatch log data. This summarized data can be placed as a widget on a CloudWatch Dashboard so it can be viewed alongside with other operational metric and log data. We will walk you through how you can deploy this widget in your own dashboards. The screenshot below shows a CloudWatch dashboard where the top left widget is the Generative AI summary widget. Additional widgets are displayed on the same dashboard.
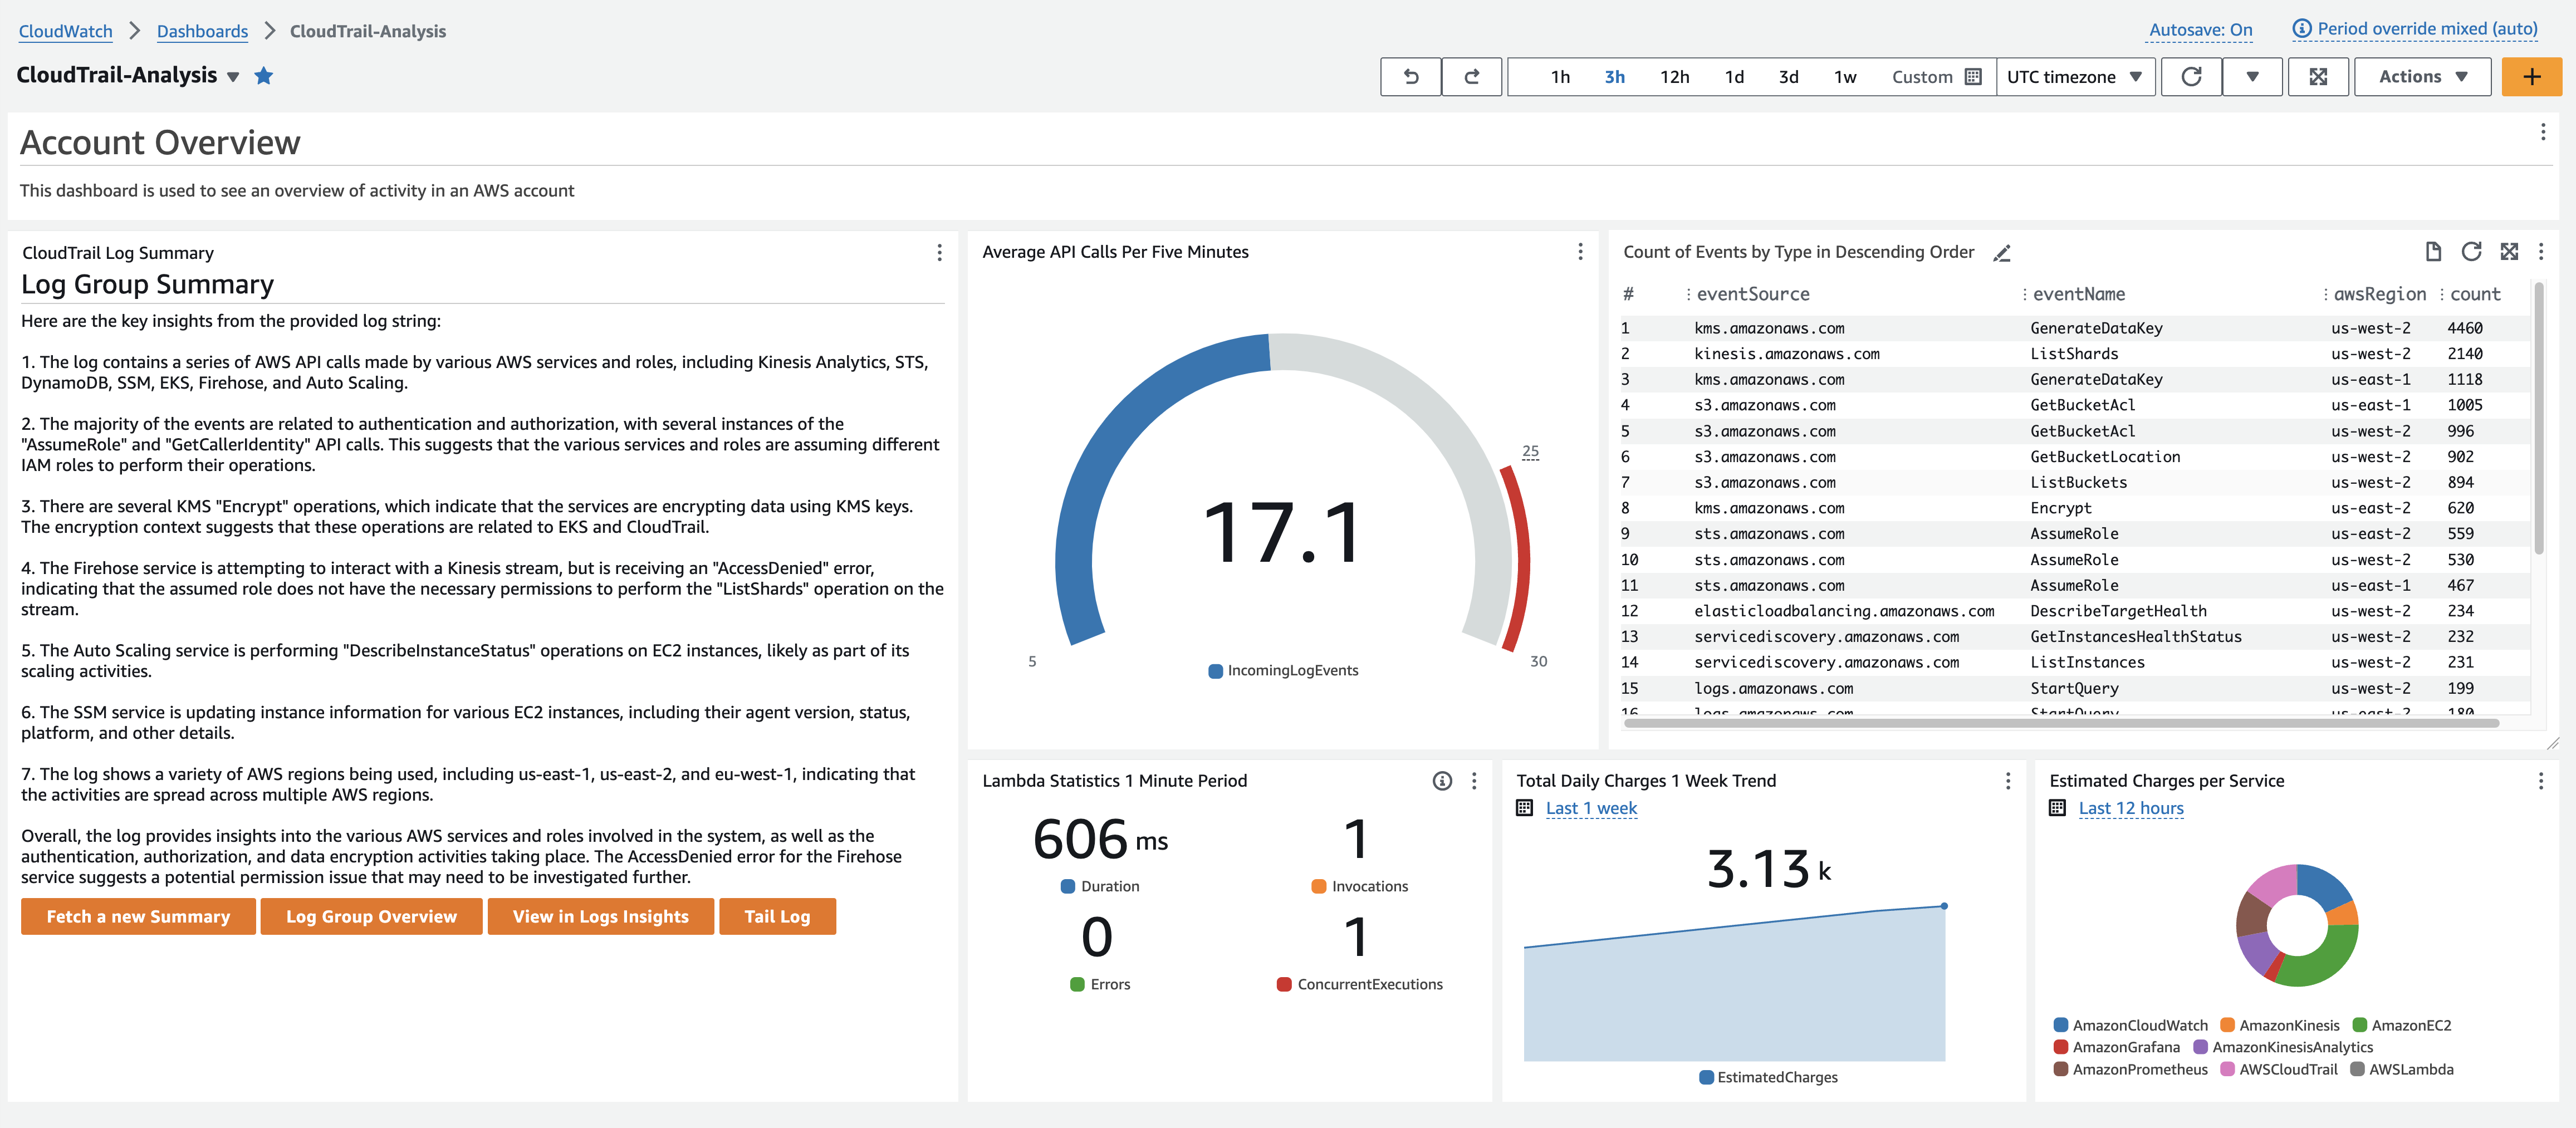
Fig 1. Screenshot of CloudWatch Logs Summary on a Dashboard with Other Widgets.
Overview:
Amazon CloudWatch is a monitoring and observability service. It allows you to collect, analyze, and visualize metrics, logs, and traces from your applications to help you understand resource and application health, identify and troubleshoot issues, and make data driven decisions.
Amazon Bedrock is a managed service that allows you to build generative AI capabilities using a range of foundation models (FMs) from leading AI companies, including Amazon’s own Titan models. It simplifies access to large-scale AI models and helps accelerate development and deployment of AI applications. Using a few lines of code and Bedrock API calls, we can send our data to an existing FM and ask the model to summarize the data for us. In addition, Amazon Bedrock is serverless, so there is no infrastructure to manage.
Amazon Bedrock models are used to summarize CloudWatch log messages and display it on your CloudWatch Dashboards in the form of a custom widget. The widget has links to directly take you to log features such as Logs Insights so you could further analyze the log data based on the insights that are generated.
CloudWatch Custom Widgets allow you to create a widget that is backed by an AWS Lambda Function. When the dashboard is loaded, or refreshed, CloudWatch invokes the Lambda function, and displays the data it returns. Lambda functions are serverless compute, and can be written in a number of languages. Within the Lambda function you can gather data from many sources through API calls, including Bedrock, and use logic in code to aggregate or manipulate the data as needed. For a custom widget, you return what you would like to display as HTML or JSON, and this is shown on the widget in the CloudWatch dashboard.
In the event of an incident or system anomaly, having a concise, natural language summary of the most recent log events can greatly accelerate the triage process. Instead of manually sifting through voluminous log data, the AI-generated summary can quickly provide an overview of the current state, enabling faster decision-making and response times. Generative AI models can provide summaries even when the data is not well-structured or otherwise easily queryable using traditional query languages.
The AI-generated summaries can highlight potential issues or anomalies before they escalate into major incidents, allowing you to take preventive measures and mitigate risks promptly. These summaries can also facilitate better collaboration and communication among teams involved in incident response and system monitoring. These summaries can be easily shared and understood by stakeholders with varying technical backgrounds, enabling more efficient coordination and knowledge sharing. The log summary widget in its final state looks like this:
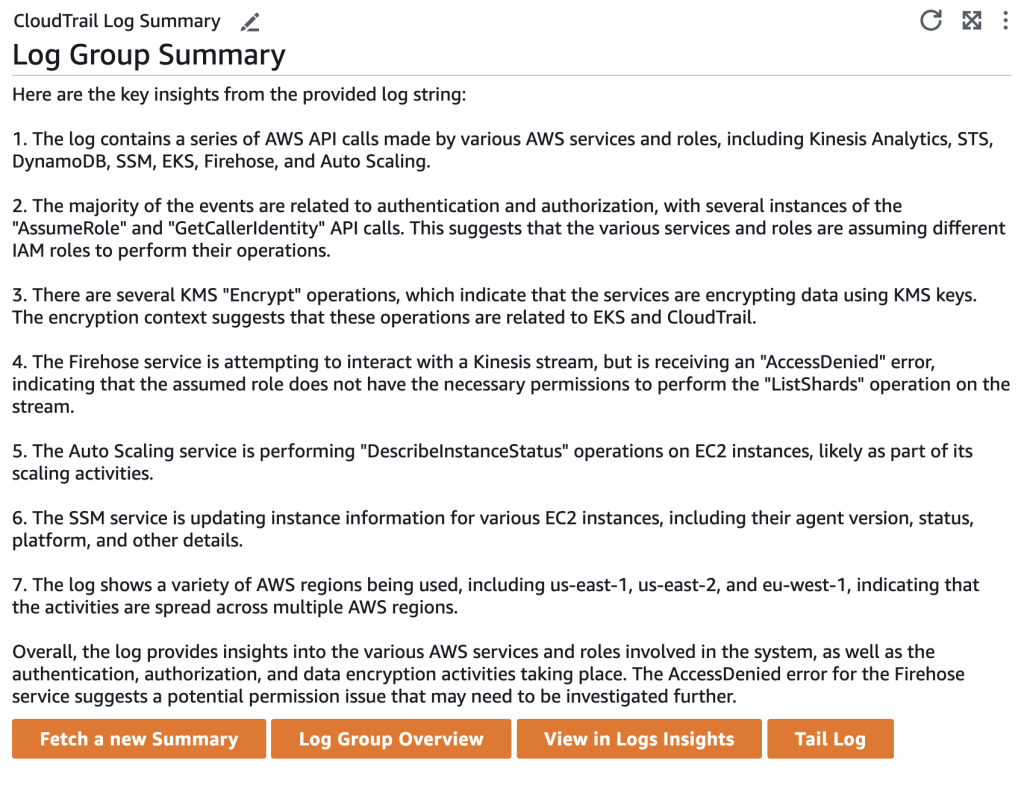
Fig 2. Screenshot of Log Summary Custom Widget
Architecture:
The architecture diagram below shows the components involved in the custom widget.
- The CloudWatch dashboard serves as the central interface where users can view the log summaries alongside other operational data, such as alarms and metric graphs.
- A Lambda Function is responsible for invoking the Bedrock model and retrieving the summarized log data.
- Bedrock acts as the log analysis engine, processing the CloudWatch log messages from the selected log group and generating concise summaries using the selected model.
- The summarized data is cached in Amazon DynamoDB for efficient retrieval and display on the dashboard.
- Finally, the summarized data is returned from the Lambda Function for CloudWatch to display on the custom widget.
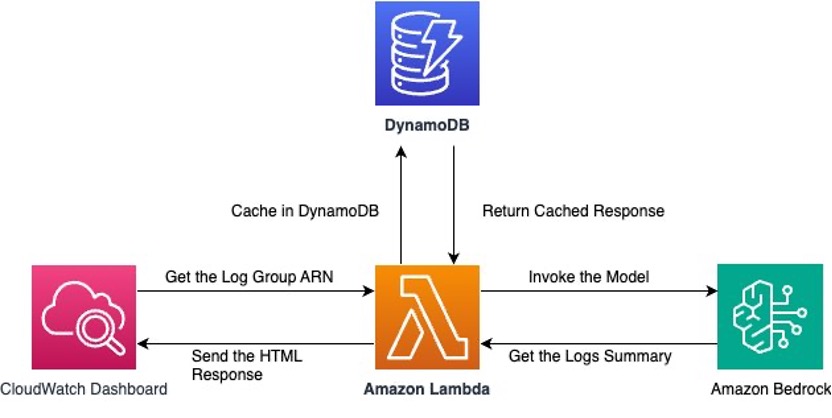
Fig 3. Architecture Diagram
Costs:
The costs associated with using this solution are from the CloudWatch dashboard, the custom widget, a Dynamo DB Table and Bedrock. Custom widgets run Lambda code, and in this case the Lambda functions make API calls. The cost should be minimal, but you should still be mindful. As a best practice you can utilize AWS Budgets with Cost Allocation Tags to monitor costs. All pricing details are on the Amazon CloudWatch, AWS Lambda, DynamoDB, and Bedrock pricing pages.
Implementation Steps:
Prerequisites:
- Claude3 Haiku model access is required to generate the summaries.
- Other models can be used, and would require access to the desired model, and modification of the Lambda function code to specify the model and send the information to the model in the correct format.
Create resources: Lambda Function, Lambda Execution Role, and DynamoDB table
- Download the yaml file.
- Navigate to the CloudFormation console in your AWS Account.
- Choose Create stack.
- Choose Template is ready, upload a template file, and navigate to the yaml file that you just downloaded.
- Choose Next.
- Give the stack a name (max. length 30 characters), and select Next.
- Add tags if desired, and select Next.
- Scroll to Capabilities at the bottom of the screen, and check the box I acknowledge that AWS CloudFormation might create IAM resources with custom names, and Create stack.
- Wait for the stack creation to complete.
- Once succeeded, you should see the stack ARN that was deployed in your selected account & region. You can also verify by going to Lambda console and looking or a function name starting with `BedrockLogAnalysisFunction`
Create a CloudWatch dashboard and add the custom widget
- Next you need to Navigate to the CloudWatch console → Create a Dashboard -> Name your Dashboard or Select the Dashboard where you need to create a custom widget as per below instructions.An “Add widget” pop-up will open. Click on “Other content types” and select “Custom widget”.

Fig 4. Widget Selection Menu
- Click on “Next” (you are not using a sample). You need to specify which Lambda Function is backing this custom widget: For “Select a Lambda function“ choose “Select from a list”, and the region where you deployed the CloudFormation Template and then pick the deployed Lambda Function called “BedrockLogAnalysisFunction”.
- You will then need to pass the log group arn in the yaml format in the input box under “Parameters” section of the widget configuration window. JSON format can also be used but for the rest of this blog post, yaml will be shown.
- We use the ARN of the log group to allow for CloudWatch cross-account capabilities to work with the solution. This way you could pass in a log group from another account assuming you have set up the CloudWatch cross-account feature. The log selected needs to be “Standard Access Tier” since the GetLogEvents api call is used.
- Note: Make sure you omit the `*` added after the log group name if you select to copy from the console.
- Optional: You can also click on “Get Documentation” in the above screenshot to see the format you need to pass the log group arn parameter to this function.
YAML parameters format
log_group_arn: arn:aws:logs:$REGION:$ACCOUNTID:log-group:/log/GroupName
The completed widget configuration is shown below:
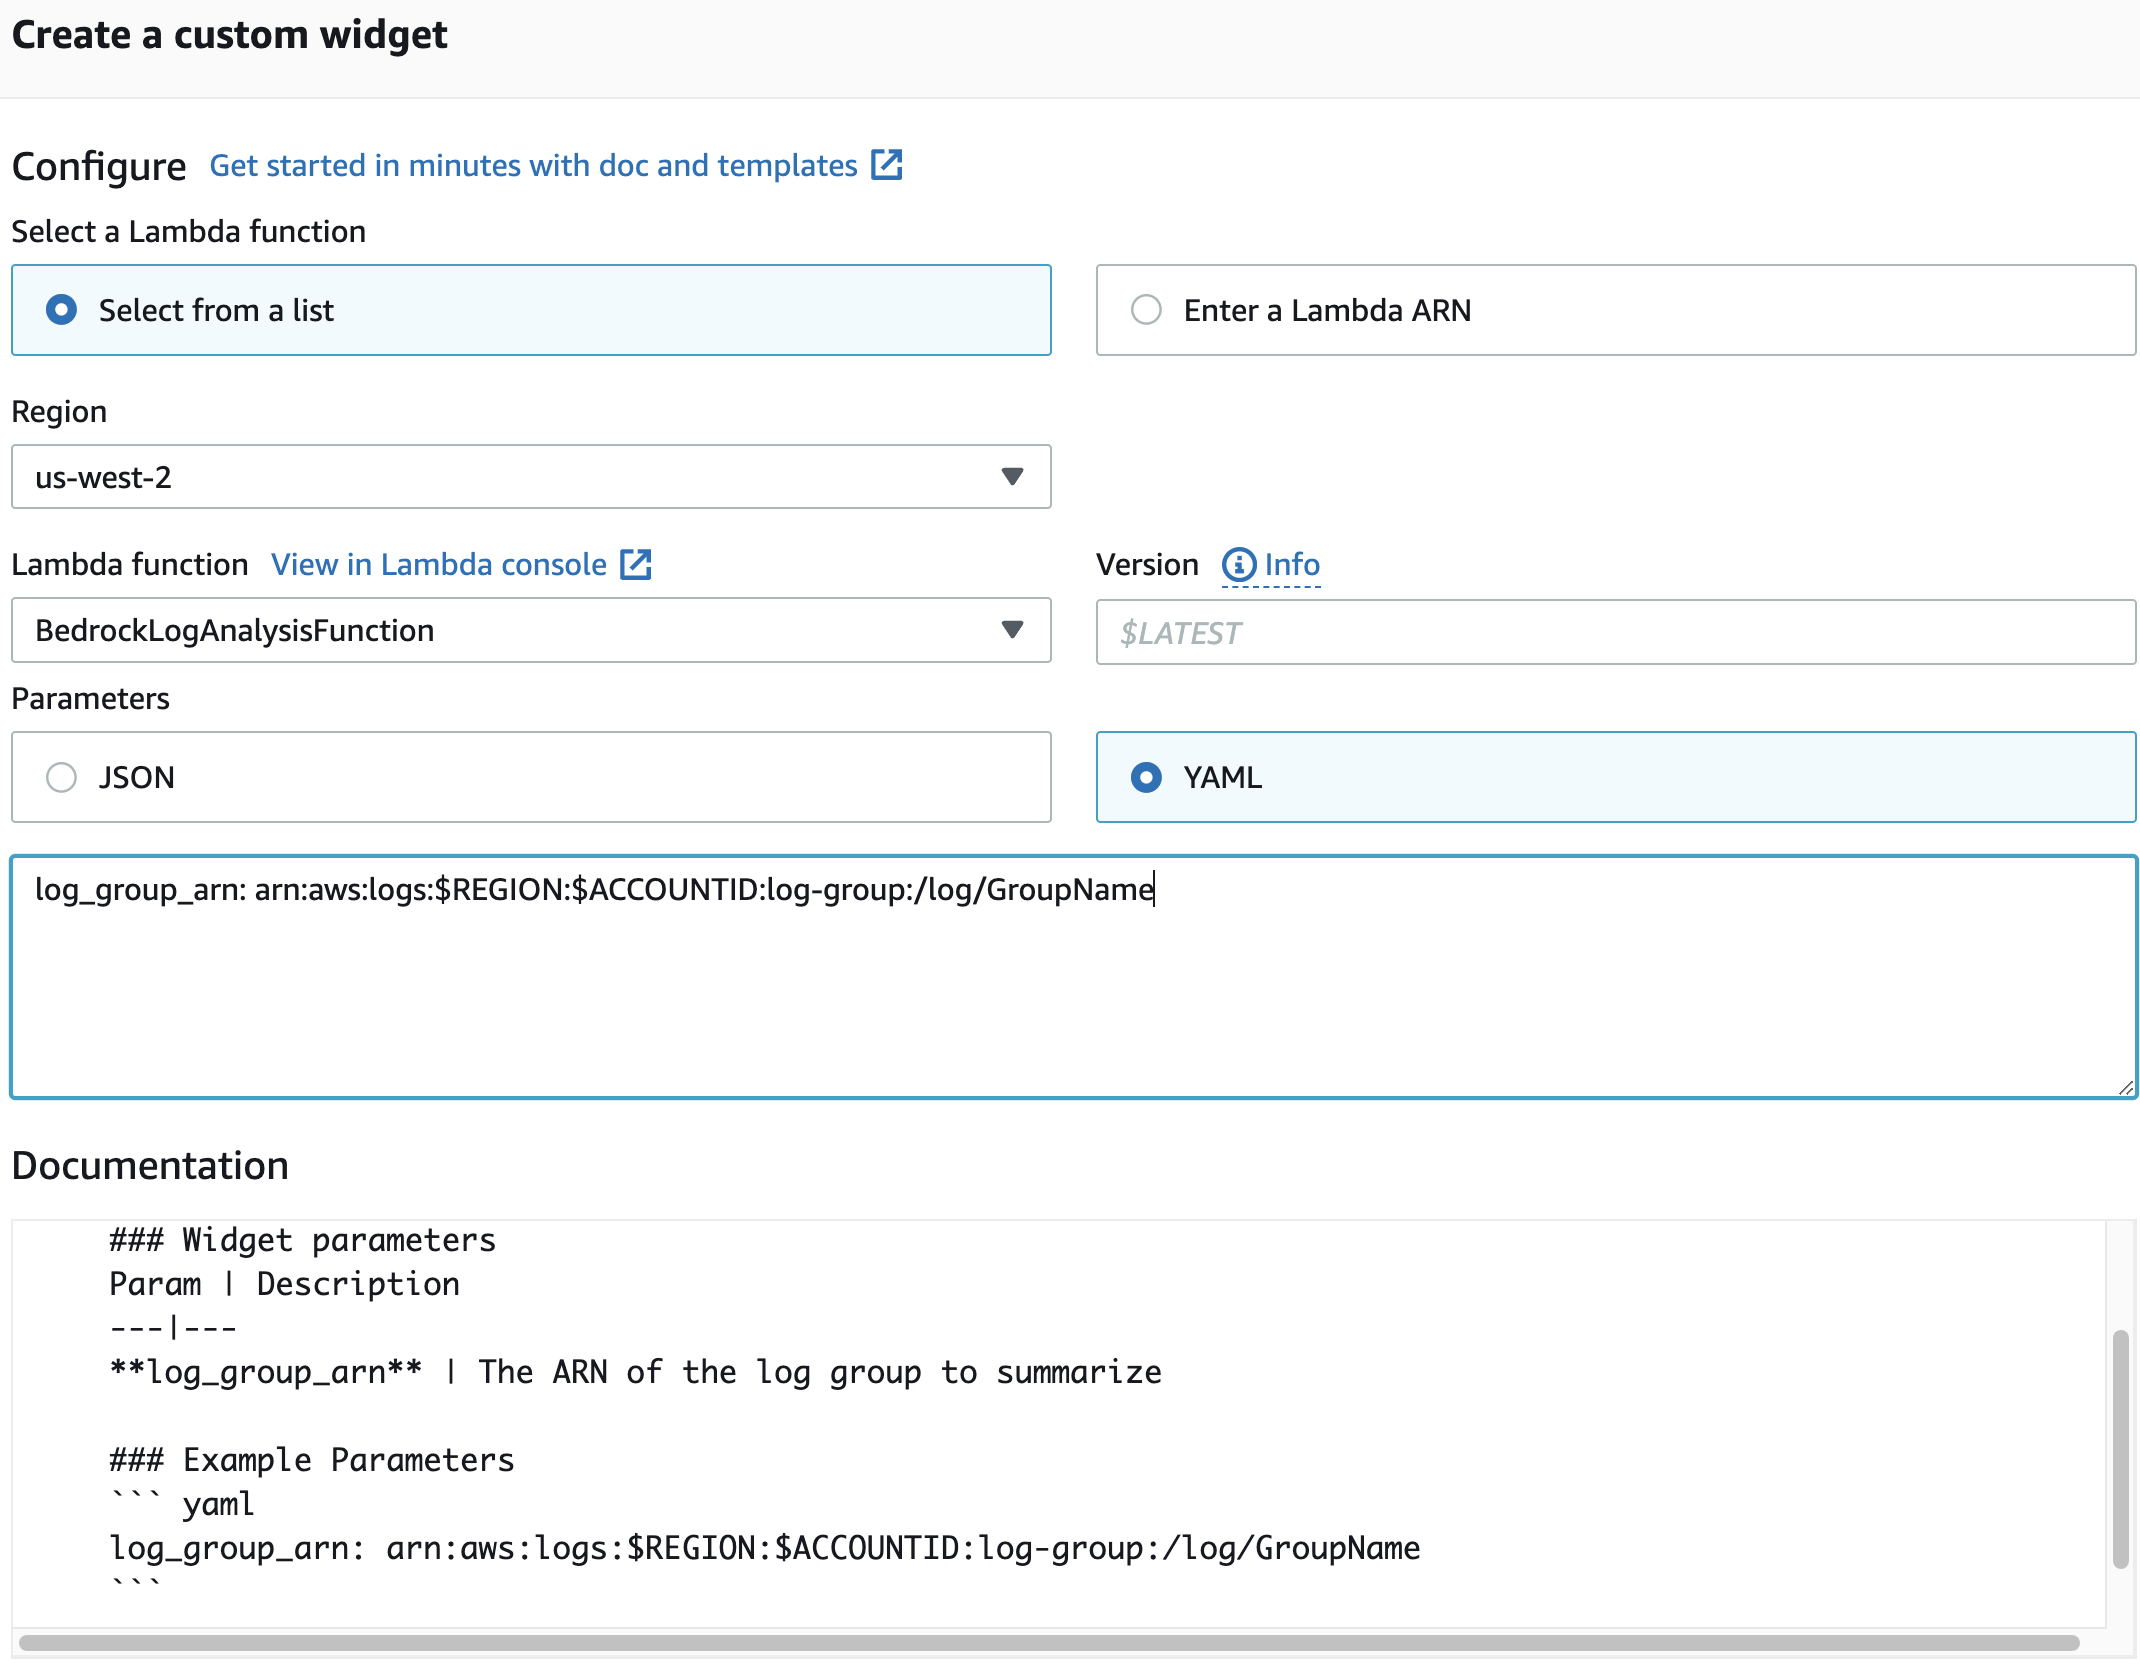
Fig 5. Completed Widget Configuration
- Click on “Preview Widget” to see the summary of your logs from that log groups. It might take a while to load for the first time (~30 seconds).
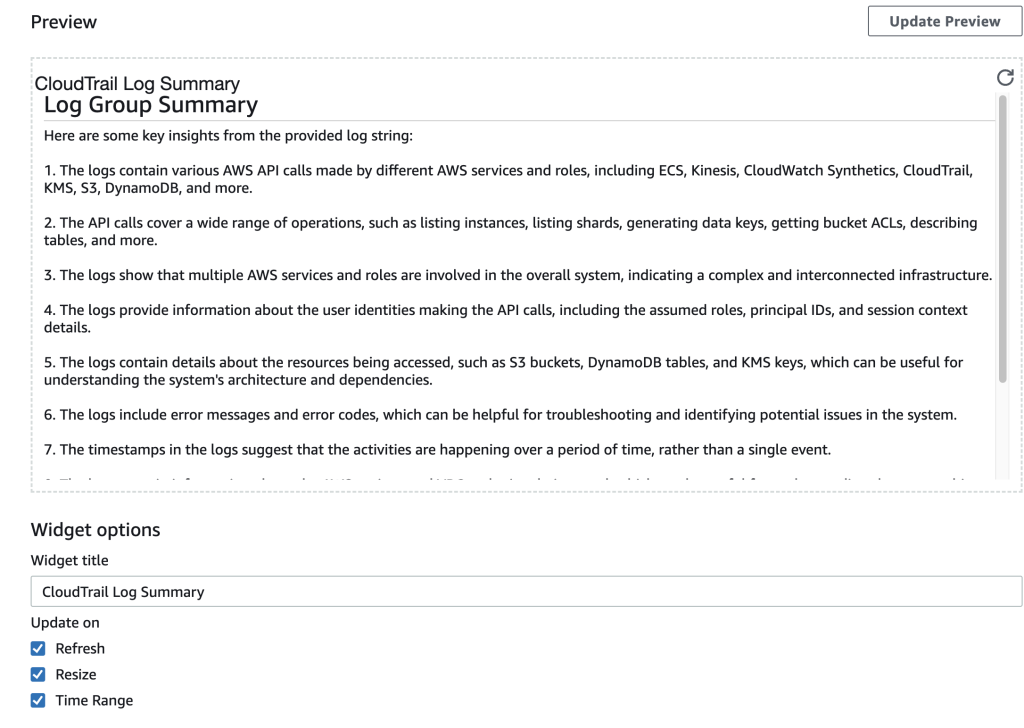
Fig 6. Widget Preview
16. You can then verify if everything is working properly and click on “Add Widget”. You will then see the custom widget appear on the dashboard, which could contain any other metrics or queries that are relevant to you for exploring the log group.
17. Click on “Save Dashboard” to save the changes you made.
Clean Up:
Delete the CloudFormation stack to terminate all resources.
Next Steps:
This solution can complement CloudWatch Logs Insights native Pattern Analysis capabilities. You can choose the Patterns tab to see the patterns that CloudWatch Logs found based on a sample of your results. These patterns are used to power CloudWatch Log Anomaly Detection . By using the solution described in this blog we can see natural language summaries of log data to go along side the token-based patterns provided by the existing feature set in CloudWatch. The combination of the two capabilities will provide context to a user of a log group who needs to know what is happening at any given time:
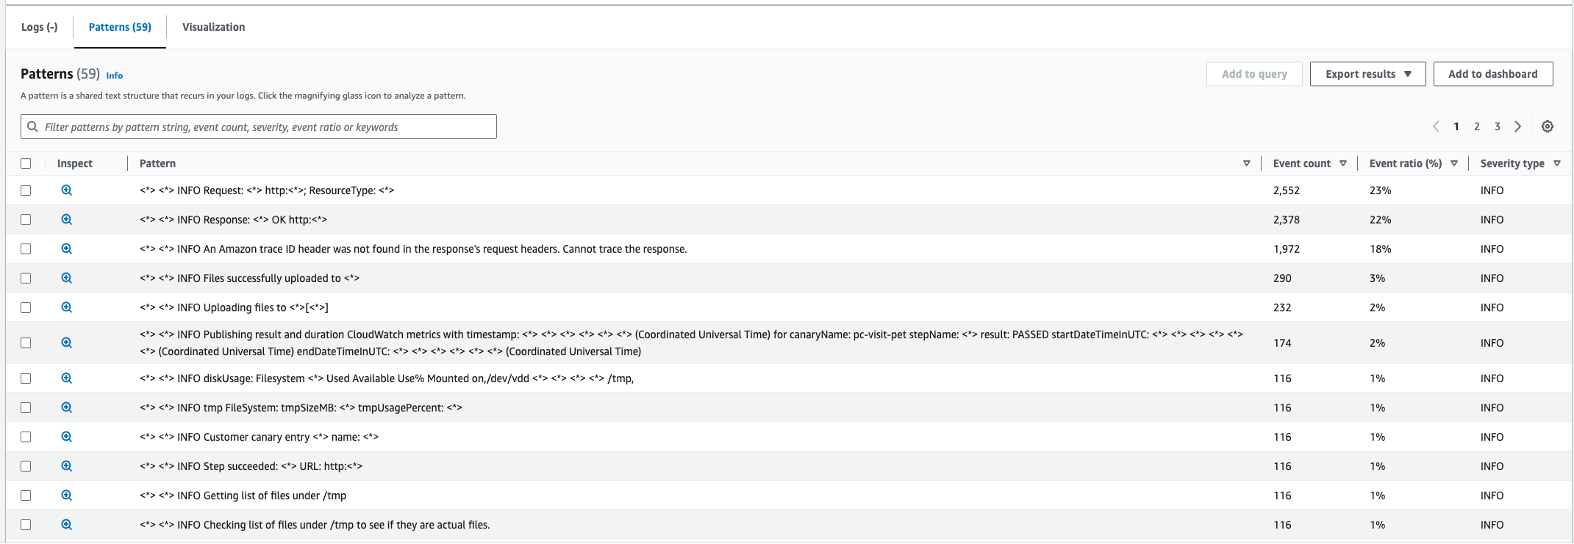
Fig 7. CloudWatch Log Insights Patterns
We have also demonstrated the power and flexibility of CloudWatch custom widgets. Since we can easily display the html, json, or markdown value returned from a Lambda function, there are a huge number of possible data visualizations you could create. There is a large library of example custom widgets to help provide a foundation to build your own custom views that are impactful to your stakeholders.
The Bedrock portion of the solution also has a potential for further customized usage to meet your needs. The prompt that is used when calling on Bedrock is “Please create some insights on the following log string.” This could easily be changed to support a variety of use cases you might have from your log data. Here are some potential examples:
– for analyzing REST API logs, you could add “Ignore all logs that are 200 OK responses”. This would allow you to filter for non OK responses.
– for budget related analysis you may want to prompt “Analyze the given log messages and detect any activity that could result in an unwanted spike in cost.”
The interesting thing about using an LLM(Large Language Model) to generate the response is that it is easy to adjust the solution to whatever your needs are. You could also explore creating and training a custom model if you need more customized responses to meet your needs.
Conclusion:
By integrating Amazon Bedrock into your CloudWatch log analysis workflow, you can unlock the power of advanced large language processing models to simplify and summarize your log data. The ability to generate concise, natural language summaries of your CloudWatch logs can significantly enhance your operational visibility and incident response capabilities. With log summaries readily available on your CloudWatch dashboards, you can quickly identify potential issues or anomalies without the need to sift through vast amounts of raw log data manually. This accelerated triage process enables faster decision-making and more efficient incident response. The natural language summaries facilitate better communication among teams as technical stakeholders can easily share and understand these summaries, leading to more coordinated efforts. By leveraging the capabilities of Amazon Bedrock and the seamless integration with CloudWatch custom widgets, you can streamline your log analysis processes, gain valuable insights from your log data, and drive operational excellence within your organization.