AWS Startups Blog
Scaling Down your Infrastructure Part 2: Cost Optimization
Post by Mathew Rowlands, AWS Senior Solutions Architect and Antoine Brochet, AWS Senior Business Development Manager
We started on April 7th 2020 a series of blog posts to help startups downscale their infrastructure and reduce their AWS spend during business slowdowns. We focused on analyzing your AWS usage with the AWS Cost Explorer, reducing your compute footprint through the right-sizing of your Amazon EC2 instances, and optimize your data storage on Amazon S3, Amazon EBS and Amazon EFS. If you missed it, feel free to give it a read (7 minutes read).
In this second installment, we are looking into cost optimization techniques for your databases, on the popular engines we see you using the most, whether it’s in an analytical or transactional style, or if it’s relational, document, key value or time series in nature.
Always Be Right-sizing
In the first post of this series we introduced the concept of rightsizing, and that is as true for data as it is for compute and storage, so let’s start where we left off and look into Cost Optimization for Amazon RDS.
First, make sure you are using the right instance size for your purposes, in the right instance family. For this, you can check the Freeable Memory and the CPU Utilization metrics. You can find these by going on the Database menu of your RDS Console, selecting your instance from the list (you may have to change your region if you can’t see the databases you expect to), and then opening the monitoring tab. You can go back 2 weeks in the Monitoring console, which s is enough data to make a decision when you have consistent, predictable traffic. Finally, check that you are on the latest version of an instance type, because the newer versions usually come with a better performance to cost ratio. For example, the newer memory optimized R5 instances deliver a 10% price per GiB improvement and a ~20% increased CPU performance over the previous generation R4.
Next, if you have Database Instances deployed using Provisioned IOPS, please make sure those settings are still valid, and adjust as needed, by looking at the Read IOPS and Write IOPS metrics for your instances following the same path as explained above.
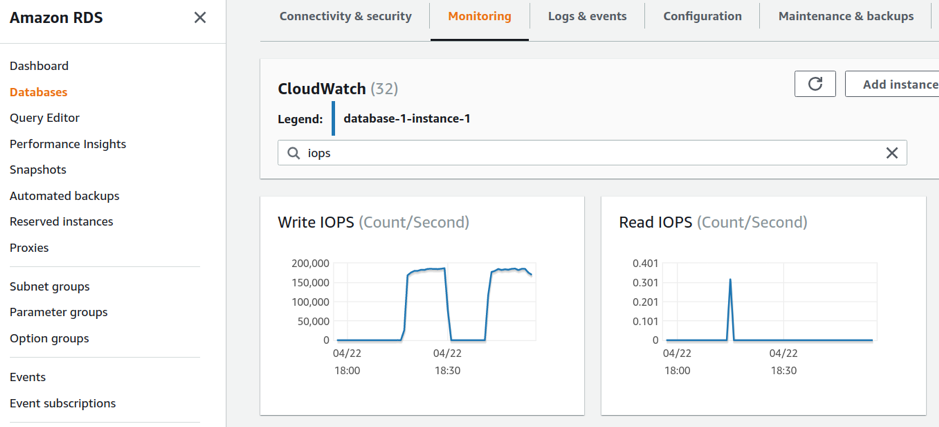
The monitoring tab in your Amazon RDS console helps understanding your database usage and practice right-sizing
For Amazon RDS and Amazon Aurora, Performance Insights gives you extra visibility, and comes with a free tier offering 7 days of data retention (the default), which is enough data to make a sizing decision when you have predictable, consistent daily traffic patterns. You can enable and disable the Performance Insights service from the RDS console, by selecting each instance in a cluster and selecting Modify. Once you have enabled the service, and collected enough data, select ‘Performance Insights’ from the left hand menu in the RDS console, choose an instance, and check the ‘Database load’ metric.

Performance Insights helps to detect performance problems with an easy-to-understand dashboard
In the graph above, the dotted line represents the number of CPU’s in your instance. In this case you can see that only one core is being used for the traffic generated by my lock generating load test, and if this was real traffic, there would be an opportunity to down size to a smaller instance.
Scheduling and retiring instances
It is really quick to stand up a new Database, whether it’s for a PoC, or for production. De-commissioning one that has been in use for a while can be a more nervy business, though, in case there are any consumers lurking in the darker corners of your infrastructure that have been missed as part of a decom process.. Here the Amazon RDS Idle DB Instances check, part of the Trusted Advisor service, can give you the visibility into utilization, allowing you to turn off any RDS instance that hasn’t had a connection in the last 7 days. There is a similar Underutilized Redshift clusters check, too.
If you are not on Business or Enterprise support, you can check one cluster at a time via the AWS RDS Console. Select Databases from the left hand menu, choose your instance from the list, and then flip to the Monitoring tab and check the DB Connections (Count) metric, going back as far as the last 2 weeks.
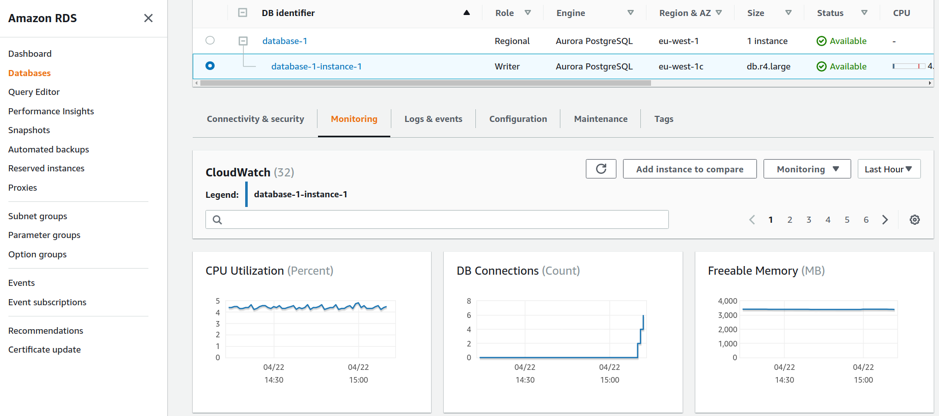
Checking the DB Connections Counts helps identifying idle databases instances.
If you have a predictable, periodic usage such as a reporting cluster, but can’t go to a full serverless solution, then consider shutting down your clusters when they are not being used. Both Amazon Aurora and Amazon RDS clusters can be stopped and started, for up to 7 days, after which they are automatically re-started. This can be scheduled by a Lambda and CloudWatch scheduled event combination, and the start and stop DB Instance API calls. For Amazon Redshift customers, please see this blog article, introducing the new Pause and Resume cluster actions.
If it’s not working hard, change the model
Let’s look into engine specifics optimizations. Before jumping into it, this could be a good time to weigh all of these options through the lens of their pricing models. When you are building something quickly, it’s hard not to reach for the tried and trusted, and fire up an Aurora instance of MySQL or similar, and get building.
However, we also recommend evaluating Document Databases for a number of reasons. Firstly, because they scale dynamically, with you, at high volume. Secondly, because Document Databases that have a throughput based pricing (e.g. Amazon DynamoDB or Amazon Keyspaces) are incredibly cost efficient in a production setting at low volume. Thirdly, because these are fully managed, serverless and highly available databases, leaving you no infrastructure to manage.
Adopt a Serverless solution
If your data fits in a key/value or document model, look at growing with Amazon DynamoDB or Amazon Keyspaces. As an example, for a 20GB database, you would have to make about 30 million eventually consistent reads and writes (assuming a generic read / write ratio of 80:20) a month before you have spent as much as launching a single db.t3.small general purpose OnDemand MySQL Aurora instance, with matching 20GB backups enabled. Network costs are the same across the services.
Aurora Serverless is ideal for Development and Staging environments, infrequently used applications like back office reporting or rarely used but important features of your offering. It is also a great choice forunpredictable workloads with no daily or weekly pattern you can scale horizontally into. If your data is relational, and fits into one of those usage patterns, make the move to Aurora Serverless for MySQL or PostgreSQL, and pay per second of actual usage, rather than run time.
Preparation through separation
We mentioned that Document Databases scale horizontally really well, but there are options with relational databases too. It is always a good practice to review and right size your cloud resources. This enables you to to find the best fit by scaling vertically as an ongoing process as you evolve.d. Horizontal scaling is also an option, with RDS supporting up to 5 read replicas, and Aurora supporting up to 15 read replicas, providing a lot of runway before you need to reach for a sharding solution. This functionality has a pre-requisite on having separate read and write connection strings defined, and using them correctly in your application code, and can be made more elegant by using DNS, and creating a read and write entry. As we mentioned before, the majority of online applications are read heavy, around the 80:20 read / write ratio. This means that you can use Aurora Auto Scaling to perhaps drop to one master read and write instance overnight, reserve that baseline capacity, and as traffic grows during the day, launch more read replicas to handle the uptick, rather than having a big instance that is under utilized at times. For a comparison between multi-az, multi-region and read replica deployments, please see this document.
Compression, logging, tuning
Data volume mostly trends upwards, using more memory and more disk space, whilst the CPU characteristics are often more constant over time, as long as appropriate indexes are in place. As you scale vertically to get more memory, you also get more CPU capacity, and ultimately you will hit an inflection point where there is more than enough CPU spare to enable compression, and start reducing the memory and storage requirements. This is a common case, with research from Fujitsu showing a potential 50% cost saving over 3 years with PostgreSQL on AWS. There are ways to enable various forms of compression across the supported engines, and we’ll look into the details of a few next, for data and for log files.
Postgres
For Postgres, there is TOAST, which currently uses the LZ family of compression. The Extended storage mode is the most effective at reducing disk and memory usage, as it tries compressing first, and then falls back to out-of-line storage if the row is still too big. This is the default for most TOAST-able data types, and you can check that it is set correctly, by
connecting to your instance, using a command like pgcli -U postgres -W -h database-id.cluster-id.eu-west-1.rds.amazonaws.com -p 5432, and then running the \d+ psql command to describe a table.
To set a column to Extended mode, run a query like alter table table_name alter column column_name set storage EXTENDED;
For further disk space gains, you can also be more aggressive with your log file retention and rotation periods. The default period is 3 days (4320 minutes), and can be adjusted by setting rds.log_retention_period in your Parameter Group.
It is also worth checking the settings on these, as they can add a fair bit of disk overhead, and evaluating which are needed during standard operation.
If you are using Postgres engine 11, please consider turning on the ‘off by default’ wal_compression flag. This uses some CPU, but can reduce the Write Ahead Log volume without increasing the risk of unrecoverable data corruption.
Postgres also has a housekeeping process called Vacuuming that reclaims dead space left by deleted tuples. Auto vacuuming is enabled to take place in the background, using the Plain mode which can run whilst normal reads and writes are ongoing, but doesn’t return reclaimed space to the Operating System, and rather keeps it for the table to re-use in the future. If you are using Postgres in an OLAP style, and you frequently run large Delete or Update SQL commands on tables, consider running the VACUUM FULL variant, if you can use a maintenance window to run the command. This requires disk space to swap on, but if the end result is a much more compact disk usage, consider scheduling this periodically, and then using the \copy psql command or the newer, faster Transportable Databases feature to migrate over to a smaller provisioned Database instance. For general best practices around maintaining a Postgres RDS / Aurora deployment, please see the guide here.
MySQL / MariaDB
In a similar vein to the approach we took with Postgres, we’ll be looking at compressing data, truncating storage, and right sizing, with the aim of using the spare CPU cycles from reduced traffic to allow us to optimize memory, IOPS and storage.
Again, there are instance and cluster parameters that are configurable. The primary one to look at is innodb_compression_level, which is defaulted to 6 in the range 0 – 9. A higher value allows you to fit more data onto your storage, at the expense of the CPU overhead during compression. You may like to consider tuning some of the other innodb_compression_* parameters after a review. The next parameter to check is innodb_file_per_table, which, when enabled (the default) means that each table is written to the file system separately, and allows us to reclaim space more easily.
To determine how fragmented a table is in MySQL, run a query like the following, and check the results for the data_free column, which will show the free space held by the table.
With the parameter innodb_file_per_table set to 1, you can run a null ALTER TABLE query, such as ALTER TABLE tbl_name ENGINE=INNODB; to de-fragment this table (or an OPTIMIZE TABLE tbl_name; query, which RDS treats as a null ALTER TABLE style query in the background). Either will compact the b-tree structure that MySQL Uses for the InnoDB table type, and which can be up to 50% un-utilized.
There are some built-in commands you can run to help with spotting more right sizing opportunities. The output from show engine innodb status has a metric for ‘Free buffers‘. If this is still high under full production load, there is an opportunity to downsize, and the opposite is true with ’pages evicted without access’ being greater than zero, which means data is being added to the buffer pool as a performance optimization, but evicted before use because of memory constraints.
The binary log file is used for read replica data replication, and has a Disaster Recovery (DR) function. Its size is surfaced via the BinLogDiskUsage CloudWatch metric. It is by default set to a 3 day retention period, and you can update it by calling the rds_set_configuration stored procedure, like call mysql.rds_set_configuration('binlog retention hours', 24);. To get a dump of the current configuration run the following: call mysql.rds_show_configuration; The general log and the slow query log are both disabled by default, but this is a good time to check that they haven’t been left enabled after an investigation. For a deeper look into managing log files, and how to disable them and reclaim space, please see the documentation here for RDS, and here for Aurora. There is a blog post looking at all aspects of RDS MySQL optimization here, showing how to set the optimum log file size, among other settings, based on load. Because of architectural differences between Aurora MySQL and MySQL, innodb_log_file_size is not applicable to the Aurora variant.
Finally, you can create an alarm based on the FreeStorageSpace CloudWatch metric.
For general best practices around managing and maintaining a MySQL RDS / Aurora deployment, please see the best practices guide here.
Amazon DynamoDB
With Amazon DynamoDB, there are two primary metrics to pay attention to in CloudWatch for cost optimisation purposes, ConsumedReadCapacityUnits and ConsumedWriteCapacityUnits, and two dynamic usage models, Auto-scaling and the newly released On-demand mode. Auto-scaling allows you to set a minimum and maximum IOPS as part of the Provisioned model, whereas On-demand is fully elastic. To help you decide which model suits you best for your data, first validate your usage profile using the metrics above. If you have a stable throughput, use the Provisioned Model, potentially without Auto-scaling if you are confident in the stability of usage. In the other case, choose Provisioned with Auto-scaling.
Next, consider the importance of your data and observe how it is consumed. Understand what the impact is if the data is throttled and what the mitigation procedures in place are. If the data is not critical to your application (e.g. a current user count, local weather, or news ticker), you may want to limit the potential cost, even under heavy load. You can achieve this by clamping the IOPS to a maximum via Auto-scaling, and wrapping the calling code in a circuit breaker. If the data is central to the experience, choose On-demand, and scale in according your load. To enable Auto-scaling on existing tables, please see the documentation here, and for On-demand mode, please start here. You can change mode every 24 hours.
This is also a prudent time to look into the nature of the data stored, and query models and indexes. We see customers using DynamoDB for time series data (e.g. like IoT sensor data, website click stream data) and often in a Provisioned IOPS model. If this is your situation, consider using this strategy for keeping only fresh data in a table with high IOPS, and rotate the rest out periodically. If you want to move old data to a data lake for further insights, look at moving it automatically from Amazon DynamoDB to Amazon S3 when an item level TTL fires, using this guide. This will reduce storage costs as well. Document databases often suffer from ‘Index creep’ over time, as more varied questions are asked of the data, and with global secondary indexes on a provisioned mode table you must specify read and write capacity units for the expected workload on that index. There is a great post showing you the patterns that can help you improve performance whilst reducing cost, optimizing your Filter Expressions for your Global Secondary Indexes, using Range-based queries effectively and harnessing sort order, to reduce the scope of scanned data, and bring you faster, cheaper results.
For a further look at best practices around Amazon DynamoDB, please start here.
Conclusion
In this post, we looked at different best practices to reduce your database usage and costs. Just like in our compute best practices blog post, it all starts with right-sizing your databases instances and cleaning idle resources. In addition, we recommended reevaluating your data structure of choice for new and existing projects. We also recommend considering using serverless document databases when possible for their high scalability and low-cost. We also looked at improving the flexibility of your database workloads by automatically scaling horizontally and vertically your databases. Finally, we discussed about the benefits of data compression and engine specific optimizations.
In the next part of the “How to Scale Down your AWS Architecture” series, we will cover caching, and networking. Until then, feel free to share your best practices to keeping to AWS cost low in comments.