AWS Storage Blog
Analyzing and monitoring CloudEndure Disaster Recovery replication traffic
For the purposes of data, application, and workload disaster recovery (DR), an optimal Recovery Point Objective (RPO) is essential to saving time and data critical to business operations. Ensuring that your DR setup is functional and architected according to best practices can help you achieve a functional RPO of seconds. Monitoring your DR setup to ensure that there are no issues, like bottlenecks along the network path that can cause lag and affect your DR plan’s ability to meet your business continuity requirements, is important to achieving a desired RPO.
CloudEndure Disaster Recovery provides scalable and cost-effective business continuity for physical, virtual, and cloud servers, and uses nearly continuous block level replication to achieve an RPO of seconds. In this blog post, I cover how to analyze and monitor your replication traffic to ensure that your CloudEndure Disaster Recovery setup is functioning optimally and architected according to best practices. I discuss the main components of the CloudEndure Disaster Recovery replication stream and how to analyze them, which should enable you to ensure that your DR setup avoids bottlenecks and lag to meet your business continuity requirements.
CloudEndure Disaster Recovery replication stream components and testing
CloudEndure replication can be broken down into three main components that combine to form the replication stream. The first component is the source, which is where your CloudEndure agent is running. The CloudEndure agent pushes across blocks to the second component, which is called the Staging Area. The Staging Area is an AWS subnet you define in your replication settings that serves as a low-cost pilot light location for your storage. The third component is the network itself between the two areas. Once you initiate a failover, the data that has been replicated to the Staging Area is orchestrated into a production-grade instance.

You can monitor and analyze traffic on both sides of the replication in order to maintain business continuity in your DR projects. Refer to this guide as a template for network analysis.
Source network and machine
This article assumes that you have already set up CloudEndure Disaster Recovery and have begun replication. For help with getting started with CloudEndure Disaster Recovery, see the following quick start documentation here.
The CloudEndure agent runs on the source machine that you are replicating to the Staging Area. This machine has two main network requirements that must be made to ensure a successful replication. Perform the following tests on a vanilla Linux machine that is launched in the same subnet as your source machine. The first key requirement is HTTPS connectivity to the CloudEndure console. Test this using the following command on your Linux machine:
# wget https://console.cloudendure.com/
A successful response will look like the following image:
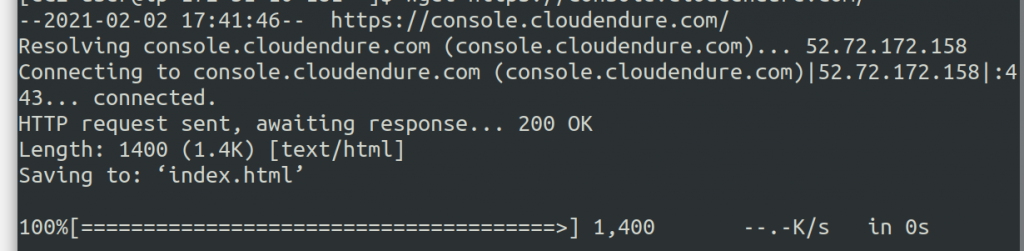
You should see the 200 OK HTTP response, indicating successful connection. If you are not getting a response, then it is possible that a firewall or network access control list (network ACL) is blocking this type of communication. Review with your network administrator to ensure this is resolved.
The second component of the replication is SSL communication between the source machine and the CloudEndure replication server on TCP port 1500. It allows for encrypted communication between the agent and replication server. Check this by performing a speed test with SSL to an appliance that exists in the same subnet as the CloudEndure replication server as defined in the replication settings of your CloudEndure Disaster Recovery project. Download the SSL speed test instructions here. This is a good test to run because it ensures connectivity while also giving you a baseline speed for your replication stream. The test will also determine if there is any issue with SSL interception on any of the network devices along the network path.
Disk change rate
Once you have a good baseline reading on the speed of your replication, analyze the change rate on the source machine that you are replicating. On a Linux server use the following command:
# sudo iostat -x -m 1 10
The test will look like this:

This test will only look at the last 10 seconds of I/O activity. Run this periodically throughout the day to determine what the I/O load is as the workload changes. If the wMB/s exceeds the amount of network throughput that can be provided, you will likely run into lag in the replication. For Windows machines, you can monitor the load from the native resource monitoring tool. If your overall rate of change exceeds the upload speed of your network, your CloudEndure machines may go into a lag state. This will then adversely affect your business RPO.
Staging Area
In this section, I discuss monitoring and analyzing the Staging Area component of the CloudEndure Disaster Recovery replication stream using VPC Flows Logs and replication server CloudWatch metrics.
VPC Flow Logs
Amazon Virtual Private Cloud (Amazon VPC) Flow Logs can be a useful tool for analyzing your replication server traffic. Set up flow logs on the staging area subnet in order to capture all traffic. The output will be familiar if you have ever looked at a pcap file using Wireshark or a similar utility. For more information on setting up VPC Flow Logs, use the VPC Flow Logs quick start guide. You can push a flow log to Amazon CloudWatch for analysis, or you can get the text file and analyze it manually. You can take a flow log and then filter for port 1500 in order to see our replication traffic. Here is an example image.
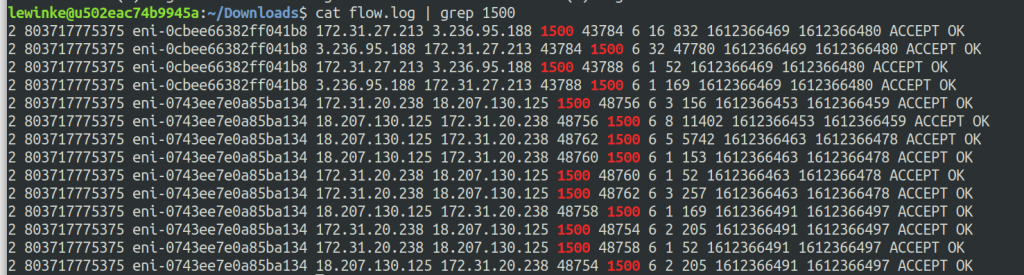
This gives us two important pieces of information. You can use this to easily determine which replication server your source machine is replicating to by checking the source and destination IP addresses. You can also easily see if traffic is being rejected due to a network ACL or security group rule. This information is useful when you are troubleshooting replication that will not start or inconsistent replication that seems to lose connection frequently. An example of a VPC flow log showing rejected traffic can be seen in the following screenshot.

If the flow logs are no longer needed after network connection analysis, you can disable them.
Replication server CloudWatch metrics
CloudEndure replication speed is dependent on the ability of the replication server to be able to receive and write blocks to the attached Amazon EBS volumes. CloudEndure Disaster Recovery does not have any form of queue or cache on the replication server side beyond default I/O and file system buffering. This means that the next block to be replicated will not leave the source machine until the previous block has been written in the staging area. If the replication server cannot keep up with the change rate, due to a network bottleneck, CPU utilization issue, or a disk I/O bottleneck, the replication will start to lag and the RPO will grow. You can monitor replication server metrics from the console. The CloudEndure replication servers will all be titled ‘CloudEndure replication Server con17.’ They can be found in the staging area subnet that you selected in the CloudEndure console. Put a check in the box for a replication server then click on the Monitoring tab that appears at the bottom. The first metric I discuss is Network in (bytes), shown in the following screenshot.
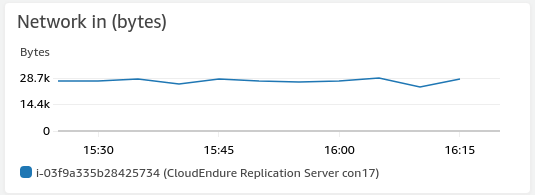
EC2 instances can support varying amounts of network bandwidth depending on the Amazon EC2 instance type. If your network throughput is reaching the bandwidth limit for the instance, throttling will occur, which will affect your replication speed and therefore RPO. In this situation, you should use a bigger instance type that can support the required bandwidth. This is controlled by a setting in the CloudEndure replication settings. The instance should be increased to a type that can support the total network throughput generated by the replication stream.
Another CloudWatch metric to look at is the disk throughput. If the volume write speed on the replication server cannot match the rate of change, lag and backlog will accumulate. On the replication server storage page, click on one of the Amazon EBS data volumes to get a closer look at it. Look at the EBS metrics for all the volumes attached to the replication Server except for /dev/sda1 as it is the root volume of the replication Server, and therefore not relevant. Once you click on one of the data volumes, you can look at the Monitoring tab to view the metrics. The most relevant metric to look at is Write Bandwidth,as shown in the following screenshot.
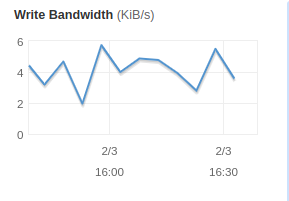
If your Write Bandwidth cannot match the change rate occurring on the source machine, you will start to see lag and backlog. In this situation, you can upgrade your volume type to use a faster type that provides higher IOPS and Amazon EBS bandwidth. By default, volumes under 500 GiB in CloudEndure use a magnetic volume. For most cases, this will be fine. If you are struggling to keep up with the pace of change on the source, you will want to change this to be an SSD volume. You can select this on a per machine basis in the CloudEndure replication settings.
Final thoughts
CloudEndure replication involves three areas of focus. The source machine, the staging area, and the network itself. In this blog post, I discussed monitoring and analyzing the activity of the replication stream. I accomplished this using the CloudEndure SSL speed test, VPC Flow Logs, CloudWatch Logs, and native Linux tools. This provides an accurate picture of the CloudEndure replication workflow and helps you meet RPOs in your CloudEndure Disaster Recovery projects. I encourage you to review the CloudEndure documentation portal for more detailed information on any of the topics covered in this post.
Thanks for reading this blog post on analyzing and monitoring CloudEndure Disaster Recovery replication traffic. If you have any comments or questions, please leave them in the comments section.