AWS Storage Blog
Disaster recovery monitoring of AWS Elastic Disaster Recovery
Monitoring and troubleshooting disaster recovery (DR) solutions is a critical component of any DR strategy. The ability to receive alerts and status updates is imperative when it comes to limiting downtime and maintaining operations. Often, monitoring a DR solution is a post-deployment afterthought. Administrators must be logged in to the tool to see if it’s falling into a lag or backlog state. If the solution isn’t properly monitored and tested, it may not be in working order when it’s needed.
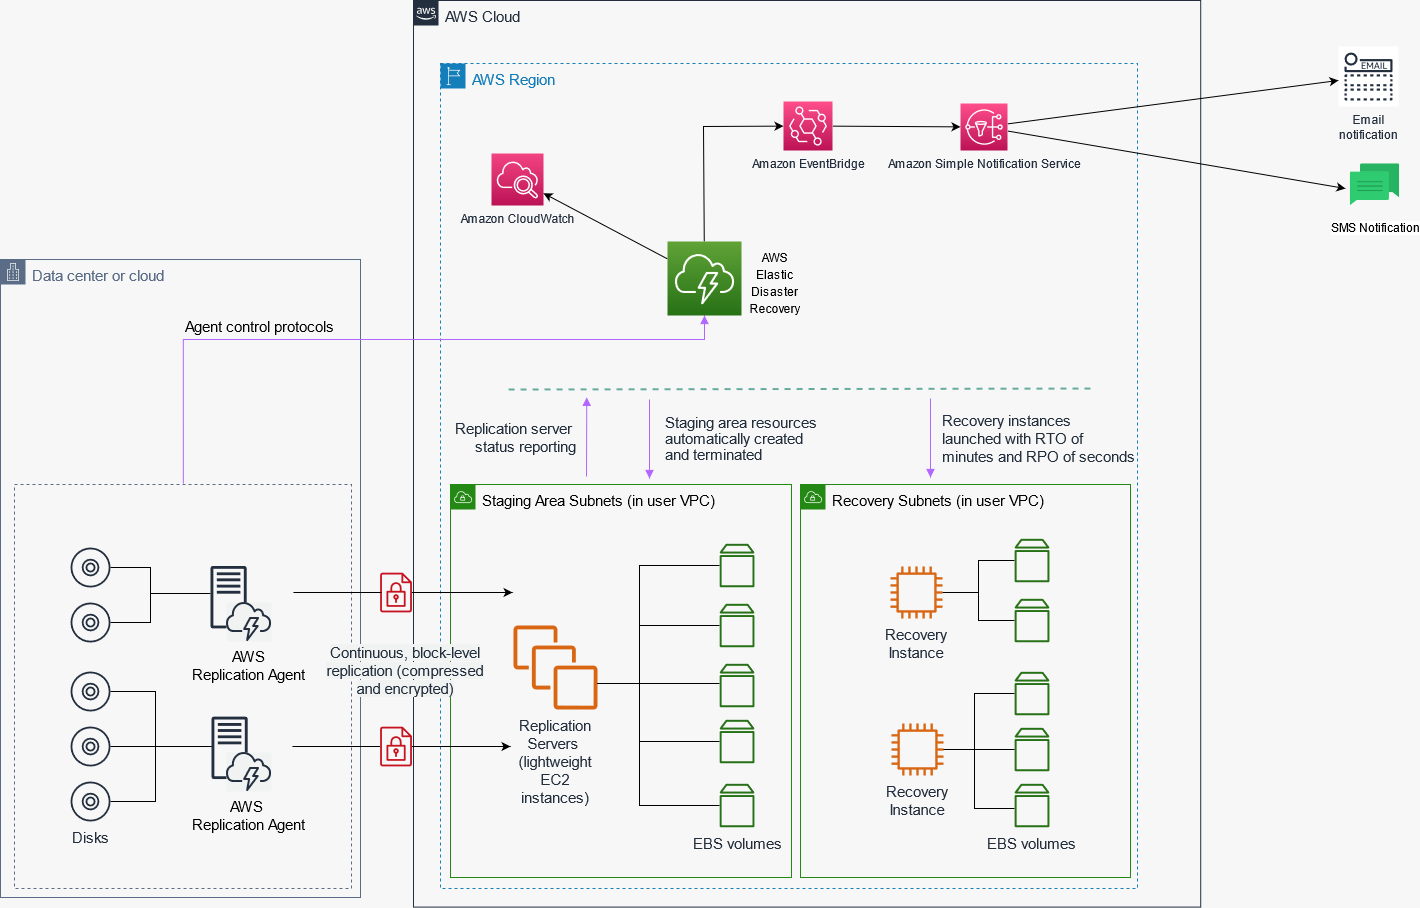
AWS Elastic Disaster Recovery is a block-level replication DR solution for physical and virtual workloads that aids in accelerating and automating DR failover. Amazon CloudWatch is a monitoring service that helps you monitor AWS resources as they are being consumed within the account. In this blog, I show how to use existing Elastic Disaster Recovery events and Amazon CloudWatch integration to build a customizable and detailed dashboard for Elastic Disaster Recovery. You’ll learn how to get a deeper view of your DR health and receive critical updates using Amazon EventBridge and Amazon Simple Notification Service.
Prerequisites
For this walkthrough, you should have the following:
- An AWS account
- AWS resources
- AWS Elastic Disaster Recovery with agents installed in a healthy state as shown in the AWS Elastic Disaster Recovery User Guide
- Access to the following AWS services:
Overview of solution
This post uses AWS Elastic Disaster Recovery to replicate workloads from the source environment to the AWS Region. It uses Amazon CloudWatch to monitor the replication health. Amazon EventBridge notifies users of any servers with replication issues through the Amazon SNS topic that they are subscribed to via email or text message.
Walkthrough
This section will take you through the steps to get started with setting up your dashboard, and the notifications that will alert you to replication issues.
Create your dashboard
You can visualize and share your metrics using CloudWatch dashboards. There are many metrics available, and CloudWatch helps you build a single view of your operations. Include metrics on bandwidth consumption, throughput, security, or other metrics that show the health of your DR function. This is a quick reference for operations staff. For this blog, I also add monitoring to show lag of source machines within Elastic Disaster Recovery. This occurs when the DR service is no longer achieving RPOs of seconds and must be remediated. I also monitor CPUUtilization and inbound network bytes of the replication servers to help ensure they are sized appropriately.

- Navigate to Amazon CloudWatch dashboard.
- Under Dashboards, select Create dashboard and provide a name for your new dashboard (for example, “DRS-health”).
- Choose Add widget.
- In the Add widget window, select a graph type (I recommend Line to illustrate a continuous trend).
- Choose Metrics.
- Select DRS, then By source server to see all of the source servers DRS is installed on.
- Choose the dropdown arrow next to LagDuration and Backlog, and Add to search.
- LagDuration shows that the source machine should be sending more blocks than we are currently receiving. Due to this, our RPOs are affected.
- Backlog informs us that replication is healthy. However, there is data that has been written to disk that we still must replicate to AWS. This also affects RPOs.
- Select all machines and choose Create widget.
- Choose the dropdown arrow next to LagDuration and Backlog, and Add to search.
- To monitor these replication server metrics as well, choose Add widget.
- Select Line, then Metrics.
- Choose EC2.
- Now select EC2>Per-Instance Metrics.
- Filter by Instance name of AWS Elastic Disaster Recovery Replication Server to see available metrics such as:
- NetworkIn
- This provides a metric of bytes into the replication server. If this is too high for your instance type, you can upgrade that replication instance size.
- CPUUtilization
- This will provide overall CPU usage of your replication servers. You want to make sure this is not in too high of a range. If this utilization is too high, you can upgrade instance sizes.
- EBSIOBalance%
- This is the amount of available I/O for your replication servers. If this gets too low, you may want to update the disk type.
- NetworkIn
- Choose Create widget.
- Follow steps 7a through 7e for both NetworkIn and CPUUtilization.
Create your Amazon SNS topic
I use Amazon SNS to alert a specific inbox or distribution list of any AWS Elastic Disaster Recovery source machines with stalled replication that must be addressed. Doing so helps your teams to identify and remediate issues quicker, so your RPO remains as expected. Stalled replication is the main indicator of replication issues and can indicate multiple issues.
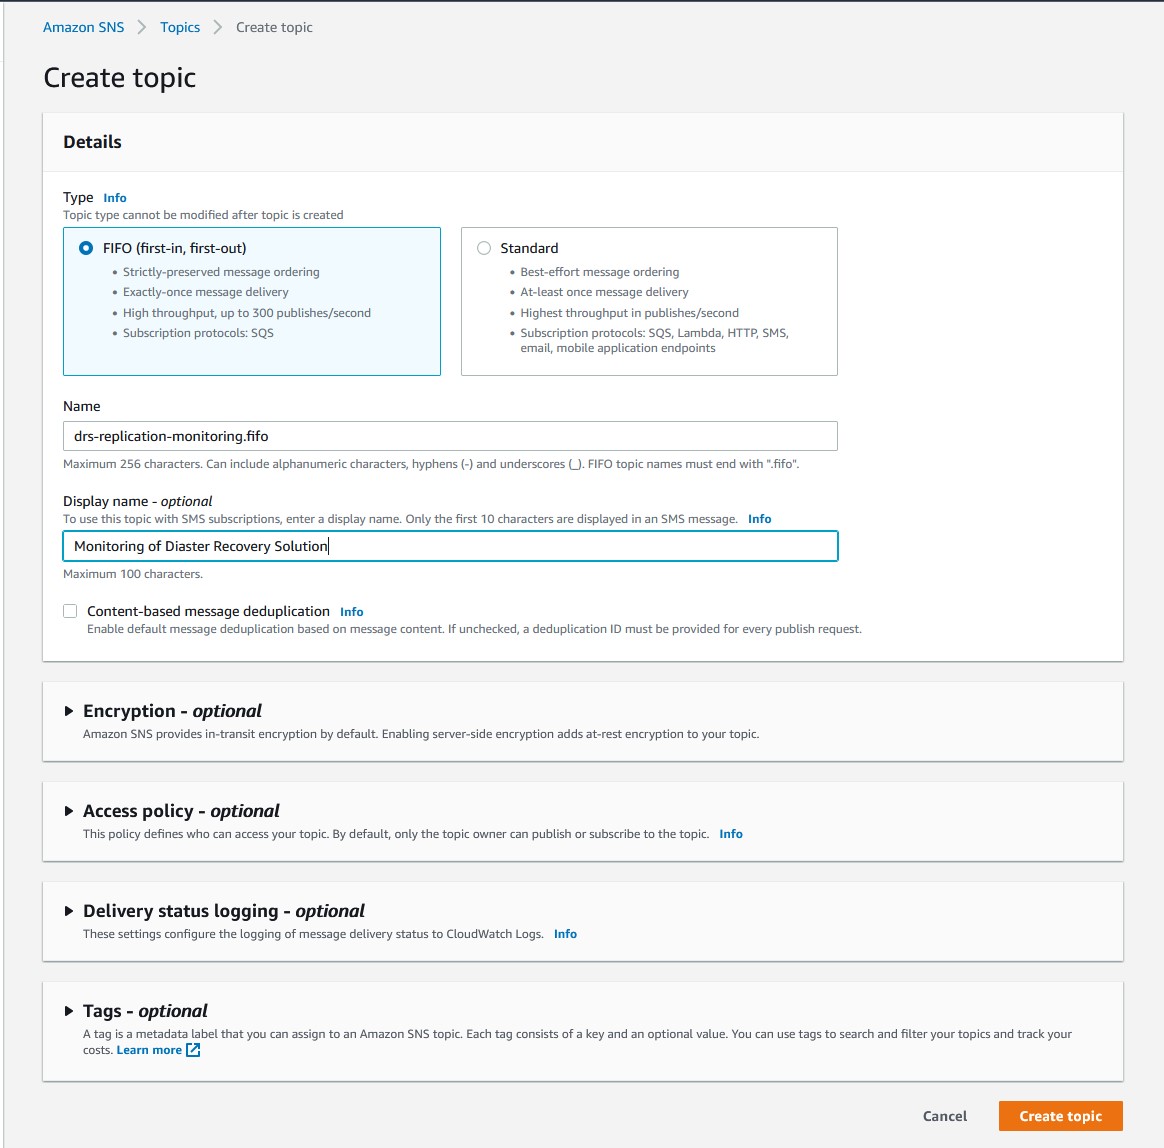
- Navigate to Amazon Simple Notification Service.
- Choose Create Topic.
- Under Details and Type choose FIFO (first-in, first-out).
- Under Name enter a name for this topic. (I chose “drs-replication-monitoring.”)
- (Optional) – Enter a display name for SMS messages to mobile devices.
- Note: As of June 1, 2021, US telecom providers no longer support person-to-person long codes for applications-to-person communications. See the Amazon SNS Developer Guide for more information.
- (Optional) – For Tags, enter a key-value pair for easy identification later.
- Select Create topic.
- Once the topic is created, select the drs-in-lag from the list.
- Choose Create subscription.
- Validate that the Topic ARN under Details is the same as drs-in-lag.
- From the Protocol dropdown, choose email.
- Under Endpoint and the email or distribution list to receive these alerts.
- Choose Create subscription.
Create a rule using the console
I use Amazon EventBridge to monitor for specific Elastic Disaster Recovery events related to replication health. Should EventBridge receive an event for unhealthy replication status for Elastic Disaster Recovery, it will notify the Amazon SNS topic. This, in turn, notifies the subscribers of that topic.
- Open the Amazon EventBridge
- Choose Create rule.
- Under Name and description and Name, enter the name for this rule. (I use “drs-replication-monitoring” for this blog.)
- Under Define pattern, choose Event pattern.
- Select Pre-defined pattern by service.
- From the dropdown menu for Service provider, choose AWS.
- Under the Service name dropdown, choose Elastic Disaster Recovery Service.
- Under Event type, choose DRS Source Server Data Replication Stalled Change.
- Select Pre-defined pattern by service.
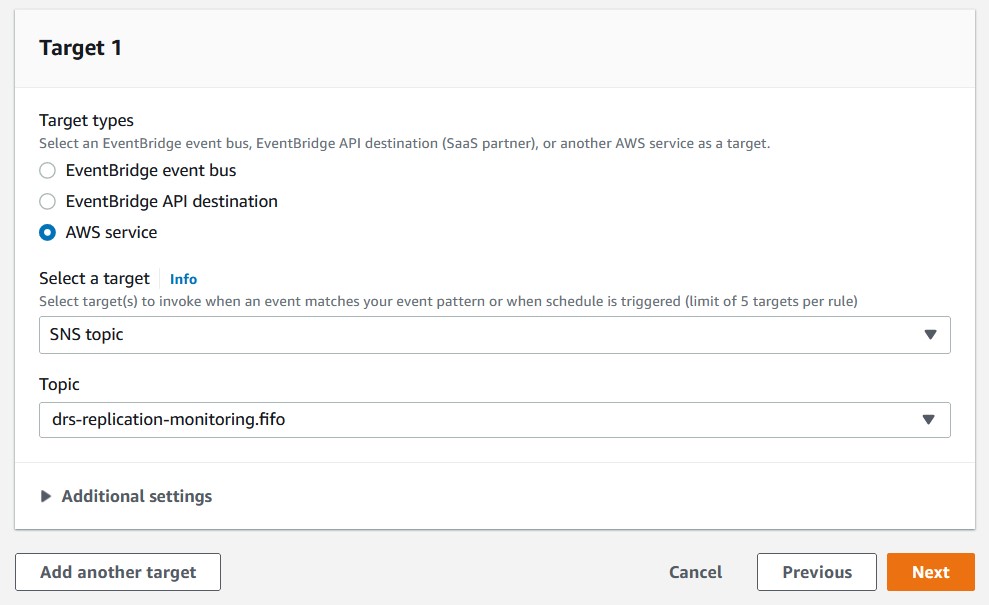
- Under Select targets and Target, choose SNS topic.
- For Topic, choose the SNS topic created earlier, drs-replication-monitoring.
- Choose Create.
Cleaning up
To avoid incurring future charges, delete the supporting resources and alerting you’ve implemented. The following links contain relevant processes.
Conclusion
In this post, I covered everything that you must create to monitor replication health for Elastic Disaster Recovery deployment, including optional metrics to monitor replication servers.
Monitoring and notification of any replication interruptions should be a high priority when it comes to keeping your disaster recovery solution healthy. The AWS Elastic Disaster Recovery events provide a powerful method to include specific instrumentation details of your resources under AWS Elastic Disaster Recovery protection. This helps you to draw insights, enable operations, and drive proactive alerting and action using CloudWatch and other AWS services. With these in place, administrators can be sure they are continuously up to date with the health of the AWS Elastic Disaster Recovery service.
Thanks for reading this blog post! If you have any comments or questions, don’t hesitate to leave them in the comments section.