Containers
Centralized Logging for Windows Containers on Amazon EKS using Fluent Bit
Introduction
Today, Amazon Web Services (AWS) announced the support for Fluent Bit container images for Windows operating system. This support eliminates the need for Windows customers to implement any custom logging solutions in their application code or manage custom agents on their Windows nodes to scrape the logs. For more details about the supported Windows versions and the image tags for Fluent Bit, please visit our documentation here.
Fluent Bit is a fast and flexible log processor and router supported by various operating systems. It’s used to route logs to various AWS destinations, such as Amazon CloudWatch, Amazon Kinesis Data Firehose destinations, Amazon Simple Storage Service (Amazon S3), and Amazon OpenSearch. In addition to the AWS destinations, Fluent Bit supports common partner solutions such as Datadog, Splunk, custom HTTP servers, and many more. For more details about container log routing, please visit the blog link here. AWS already supports the Fluent Bit container images based on Linux operating system, and this release allows the customers to have a centralized mechanism for processing and routing their logs across Amazon Elastic Container Service (Amazon ECS) and Amazon Elastic Kubernetes Service (Amazon EKS) for both Linux and Windows workloads.
In this post, we cover how Amazon EKS customers can deploy Fluent Bit Windows images as a DaemonSet on their Windows nodes to stream Internet Information Services (IIS) logs generated in the Windows pods to Amazon CloudWatch logs as a way to centralize logging. We’ll configure Fluent Bit to route all the logs generated by pods in different namespaces to respective CloudWatch log groups. Additionally, each log entry would be enriched with additional Kubernetes metadata such as namespace, pod name, container name, image name, host name, etc. For more details on deploying Fluent Bit on Amazon ECS Windows cluster, please visit our blog post here.
Prerequisites
Prerequisites and assumptions:
- Amazon EKS cluster (1.20 or newer) up and running. See this step by step guide.
- Launch Amazon EKS Windows worker nodes. See this step by step guide.
- You have properly installed and configured Amazon Command Line Interface (AWS CLI), eksctl, and kubectl.
- For building Windows container image, you have created Amazon Elastic Compute Cloud (Amazon EC2) Windows instance with Docker installed, which is based on the same Windows version as the Amazon EKS Windows worker nodes. Alternatively, you can also use Amazon EC2 Image Builder for building your container image.
- You have created Amazon Elastic Container Registry (Amazon ECR) repository to host Windows container image. See this step by step tutorial.
Solution overview
In this post, we’ll complete the following tasks:
- Validate the Windows worker nodes are up and running.
- Create Kubernetes namespace amazon-cloudwatch in which Fluent Bit runs.
- Configure the AWS Identity and Access Management (AWS IAM) policies required for enabling Fluent Bit to send the logs to required destinations.
- Create a config map with the required configuration.
- [Optional] Build a Windows container image containing IIS and LogMonitor.
- Deploy Fluent Bit on Windows node as a DaemonSet.
- Deploy Windows container image containing IIS and LogMonitor.
- [Optional] Access the IIS pods to generate logs.
- Checking logs on Amazon CloudWatch logs.
- Cleanup the created resources.
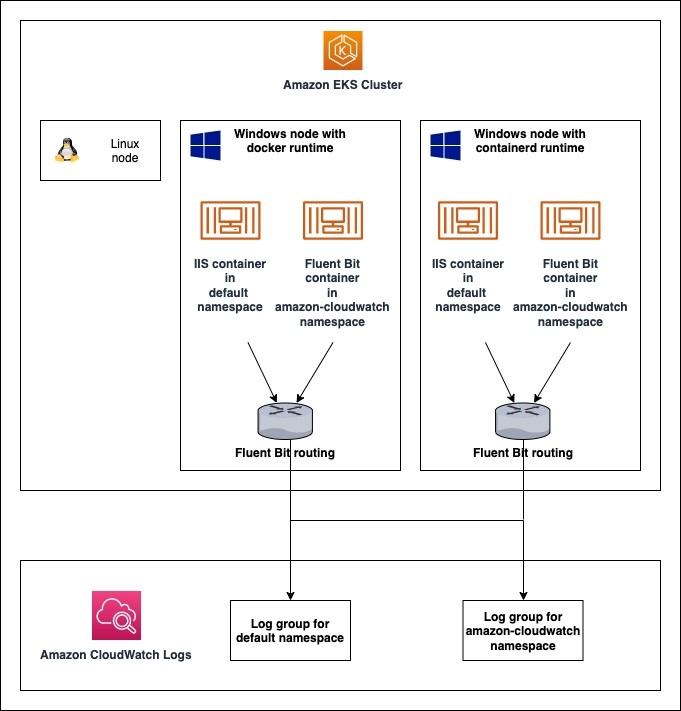
Architecture of setup used in this blog post
Walkthrough
1. Validate the Windows worker nodes are up and running
To follow along in this tutorial, you must have an existing Amazon EKS cluster with Windows nodes running in it. To create the same, please follow our guide here.
- To check that Windows worker nodes are ready, run the following command.
You can expect the following output:
As you can see, we have two Windows Server 2019 nodes based on Amazon EKS version 1.23, which are using docker and containerd runtime, respectively.
2. Create Kubernetes namespace amazon-cloudwatch for Fluent Bit
Kubernetes namespaces provide a scope for names and organize your workload inside the cluster. For consolidating all the Fluent Bit resources, we’ll create a namespace named amazon-cloudwatch.
2.1 Create a file with the following content and name it namespace.yaml:
2.2 Run the following command to create the namespace:
3. Configure the IAM policies required for enabling Fluent Bit to send the logs to required destinations
Fluent Bit requires specific IAM permissions to send the logs to AWS destinations. The permissions required for a Fluent Bit output plugin are mentioned in the documentation for that specific output plugin. For example, we use Amazon CloudWatch as the log destination. The following IAM permission applies:
You can also check for additional details in the official Fluent Bit documentation.
Going by the principle of least privilege, instead of creating and distributing your AWS credentials to the containers or using the Amazon EC2 instance’s role, you can use IAM Roles for Service Accounts (IRSA) and configure your pods to use the Kubernetes service account. For more details, please refer to the documentation here.
Alternatively, Fluent Bit can use the permissions from the IAM role attached to the Amazon EC2 instance. For more details on how to attach specific IAM policies when creating nodegroups using eksctl, please visit the schema documentation here. You can also attach the IAM policies once the nodegroup has been created. Please refer to documentation here.
3.1 To configure IAM roles for service accounts (i.e., IRSA) on Amazon EKS, we need to associate an IAM OpenID Connect (OIDC) provider to the Amazon EKS cluster. Check if your Amazon EKS cluster has an existing IAM OIDC provider by executing the following command:
3.2 If you need to create an IAM OIDC provider run the following command:
3.3 Create a file named fluent-bit-policy.json with the policy mentioned above. Run the following command to create the IAM policy.
3.4 Create the IAM service account and attach the policy previously created.
Run the following command to create IAM service account using eksctl:
In order to configure the same using AWS CLI, please refer to the documentation here.
4. Create a config map with the required configuration
We need to provide few details to Fluent Bit to configure it. These include the cluster name and region. We accomplish the same using Config Maps.
4.1 Run the following to create a config map for providing configuration options to Fluent Bit:
By default, Fluent Bit reads log files from the tail, and captures only new logs after it’s deployed. If you want the opposite, set FluentBitReadFromHead='On' and it collects all logs in the file system.
5. [Optional] Build a Windows container image containing IIS and LogMonitor
If you already have a Windows container image for your application, please feel free to skip this section.
5.1 To test the functionality explained in this post, we create a Windows container image containing IIS and LogMonitor. By default, the Windows containers send logs to Event Tracing for Windows (ETW), Event Log, and custom logs files. However, log processors such as Fluent Bit and fluentd fetch containers logs from a STDOUT pipeline which doesn’t exist on Windows containers. LogMonitor is an open-source plugin created by Microsoft to create a STDOUT pipeline within the Windows container so such tools can successfully fetch logs in the same way they do on a Linux environment.
For more instructions on how to use LogMonitor, access the official GitHub repository or Microsoft blog post about the same.
In the example below, we have a Dockerfile build the Windows container image containing IIS and LogMonitor.
This sample LogMonitorConfig configuration retrieves all the logs files with the extension .log saved in C:\inetpub\logs and sub directories, including the IIS access logs.
As the build completes, push the image to your Amazon ECR registry.
6. Deploy Fluent Bit on Windows nodes as a DaemonSet
A DaemonSet ensures that all (or some) nodes run a copy of a pod. As nodes are added to the cluster, pods are also added to them. In order to make sure that all Windows worker nodes have a copy of the Windows Fluent Bit pod, we deploy a DaemonSet using the deployment file specified in the following steps.
6.1 Copy the following manifest into a file named fluent-bit-daemon-set.yaml.
Based on the above configuration, Fluent Bit would:
- Use tail output plugin to find new log entries which are appended to the container specific log files maintained by container runtime.
- Use Kubernetes Fluent Bit filter to append additional metadata to each log entry. This is done by querying the Kube-API server.
- Use Amazon CloudWatch log group ending with
defaultfor sending application logs of pods running indefault Kubernetes namespace. - Use Amazon CloudWatch log group ending with
amazon-cloudwatchfor sending logs generated by Fluent Bit pods running inamazon-cloudwatchKubernetes namespace.
The tag with each log entry is of the format application.C.var.log.container.<POD_NAME>_<NAMESPACE_NAME>_<CONTAINER_NAME>-<DOCKER_ID>. In the above example Fluent Bit configuration, we route logs based on namespaces using the regex in Match settings for output plugins. For more details about how Fluent Bit can be configured to use Tag and Match, please visit the documentation here.
You can also visit our documentation here for instructions on customizing your Amazon CloudWatch Log Group or Stream with Kubernetes metadata.
Note: In this post, we configured Kubernetes filter to use Kube API Server instead of kubelet endpoint for querying the additional metadata. This is because kubelet runs in host network namespace on Windows where Fluent Bit runs in the container network. We can use kubelet endpoint if the Fluent Bit pods are launched as HostProcess pods.
6.2 Deploy this manifest using the following command:
7. Deploy Windows container image containing IIS and LogMonitor
In this step, we will deploy Windows pods on the Windows worker nodes.
7.1 Create a deployment file named windows_manifest.yaml with the following content:
7.2 Deploy the manifest using the following command:
8. [Optional] Access the IIS pods to generate logs
This is an optional step. You can either wait for actual traffic to hit your Windows pod hosting the IIS webserver. Alternatively, you can log into your container and force the logs.
8.1 Run the following command to log into your container:
8.2 From inside the container, run the following command to hit the web server:
9. Checking logs on Amazon CloudWatch logs
In this step, we login into the Amazon CloudWatch console and observe the logs that were generated. The Amazon CloudWatch console can be accessed via the link here. Access Log Group console from side panel via Logs/Log Groups.
You can expect log groups with name:
/aws/containerinsights/<CLUSTER_NAME>/default/aws/containerinsights/<CLUSTER_NAME>/amazon-cloudwatch
Each log group would contain logs from the pods deployed in respective Kubernetes namespaces.
Cleaning up
When you have finished the tutorial in this post, clean up the resources associated with it to avoid incurring charges for resources that you aren’t using:
- Delete the Windows deployment
- Delete the Fluent Bit
DaemonSet
- Delete the log groups created by Fluent Bit
- Delete the Windows container image created in step 5
- Delete the Service Account and IAM policy created in step 3
- Delete the
amazon-cloudwatchnamespace
Conclusion
In this post, we showed you how to deploy Fluent Bit as a DaemonSet on Windows worker nodes in Amazon EKS.
Using Fluent Bit as a log router is a beneficial way to centralize logging across Amazon EKS for both Linux and Windows workloads. Fluent Bit can send the logs to various destination solutions allowing flexibility for customers.