AWS Big Data Blog
Accelerate data insights with Elastic and Amazon Kinesis Data Firehose
February 9, 2024: Amazon Kinesis Data Firehose has been renamed to Amazon Data Firehose. Read the AWS What’s New post to learn more.
This is a guest post co-written with Udayasimha Theepireddy from Elastic.
Processing and analyzing log and Internet of Things (IoT) data can be challenging, especially when dealing with large volumes of real-time data. Elastic and Amazon Kinesis Data Firehose are two powerful tools that can help make this process easier. For example, by using Kinesis Data Firehose to ingest data from IoT devices, you can stream data directly into Elastic for real-time analysis. This can help you identify patterns and anomalies in the data as they happen, allowing you to take action in real time. Additionally, by using Elastic to store and analyze log data, you can quickly search and filter through large volumes of log data to identify issues and troubleshoot problems.
In this post, we explore how to integrate Elastic and Kinesis Data Firehose to streamline log and IoT data processing and analysis. We walk you through a step-by-step example of how to send VPC flow logs to Elastic through Kinesis Data Firehose.
Solution overview
Elastic is an AWS ISV Partner that helps you find information, gain insights, and protect your data when you run on AWS. Elastic offers enterprise search, observability, and security features that are built on a single, flexible technology stack that can be deployed anywhere.
Kinesis Data Firehose is a popular service that delivers streaming data from over 20 AWS services such as AWS IoT Core and Amazon CloudWatch logs to over 15 analytical and observability tools such as Elastic. Kinesis Data Firehose provides a fast and easy way to send your VPC flow logs data to Elastic in minutes without a single line of code and without building or managing your own data ingestion and delivery infrastructure.
VPC flow logs capture the traffic information going to and from your network interfaces in your VPC. With the launch of Kinesis Data Firehose support to Elastic, you can analyze your VPC flow logs with just a few clicks. Kinesis Data Firehose provides a true end-to-end serverless mechanism to deliver your flow logs to Elastic, where you can use Elastic Dashboards to search through those logs, create dashboards, detect anomalies, and send alerts. VPC flow logs help you to answer questions like what percentage of your traffic is getting dropped, and how much traffic is getting generated for specific sources and destinations.
Integrating Elastic and Kinesis Data Firehose is a straightforward process. There are no agents and beats. Simply configure your Firehose delivery stream to send its data to Elastic’s endpoint.
The following diagram depicts this specific configuration of how to ingest VPC flow logs via Kinesis Data Firehose into Elastic.
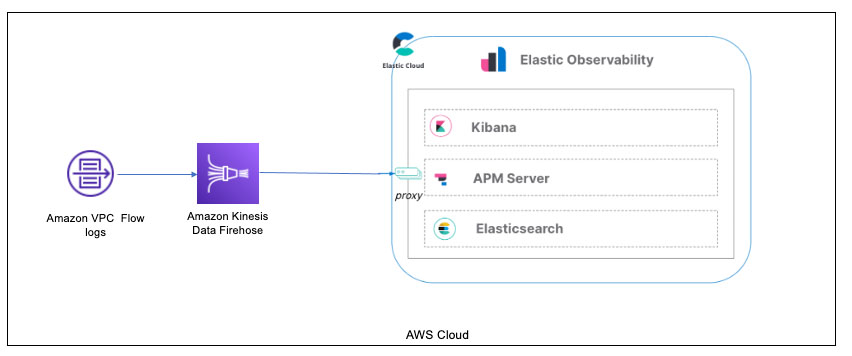
In the past, users would have to use an AWS Lambda function to transform the incoming data from VPC flow logs into an Amazon Simple Storage Service (Amazon S3) bucket before loading it into Kinesis Data Firehose or create a CloudWatch Logs subscription that sends any incoming log events that match defined filters to the Firehose delivery stream.
With this new integration, you can set up this configuration directly from your VPC flow logs to Kinesis Data Firehose and into Elastic Cloud. (Note that Elastic Cloud must be deployed on AWS.)
Let’s walk through the details of configuring Kinesis Data Firehose and Elastic, and demonstrate ingesting data.
Prerequisites
To set up this demonstration, make sure you have the following prerequisites:
- An account on Elastic Cloud and a deployed stack on AWS. Deploying this on AWS is required for Kinesis Data Firehose log ingestion. For instructions, refer to Installing the Elastic Stack.
- An AWS account with permissions to pull the necessary data from AWS.
- VPC flow logs enabled for the VPC where the application is deployed and configured to send data to Kinesis Data Firehose.
- A three-tier web architecture in AWS, which can ingest metrics from several AWS services.
We walk through installing general AWS integration components into the Elastic Cloud deployment to ensure Kinesis Data Firehose connectivity. Refer to the full list of services supported by the Elastic/AWS integration for more information.
Deploy Elastic on AWS
Follow the instructions on the Elastic registration page to get started on Elastic Cloud.
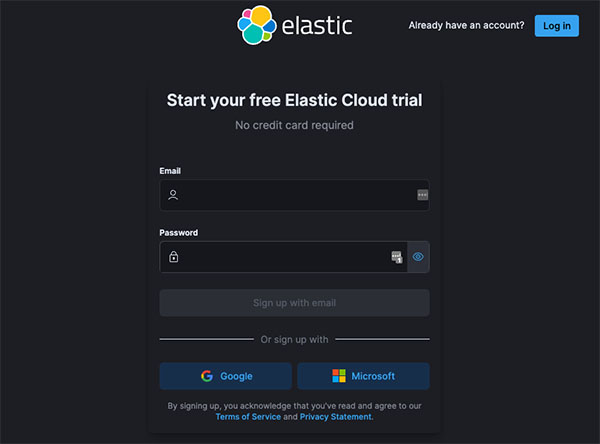
Once logged in to Elastic Cloud, create a deployment on AWS. It’s important to ensure that the deployment is on AWS. The Firehose delivery stream connects specifically to an endpoint that needs to be on AWS.
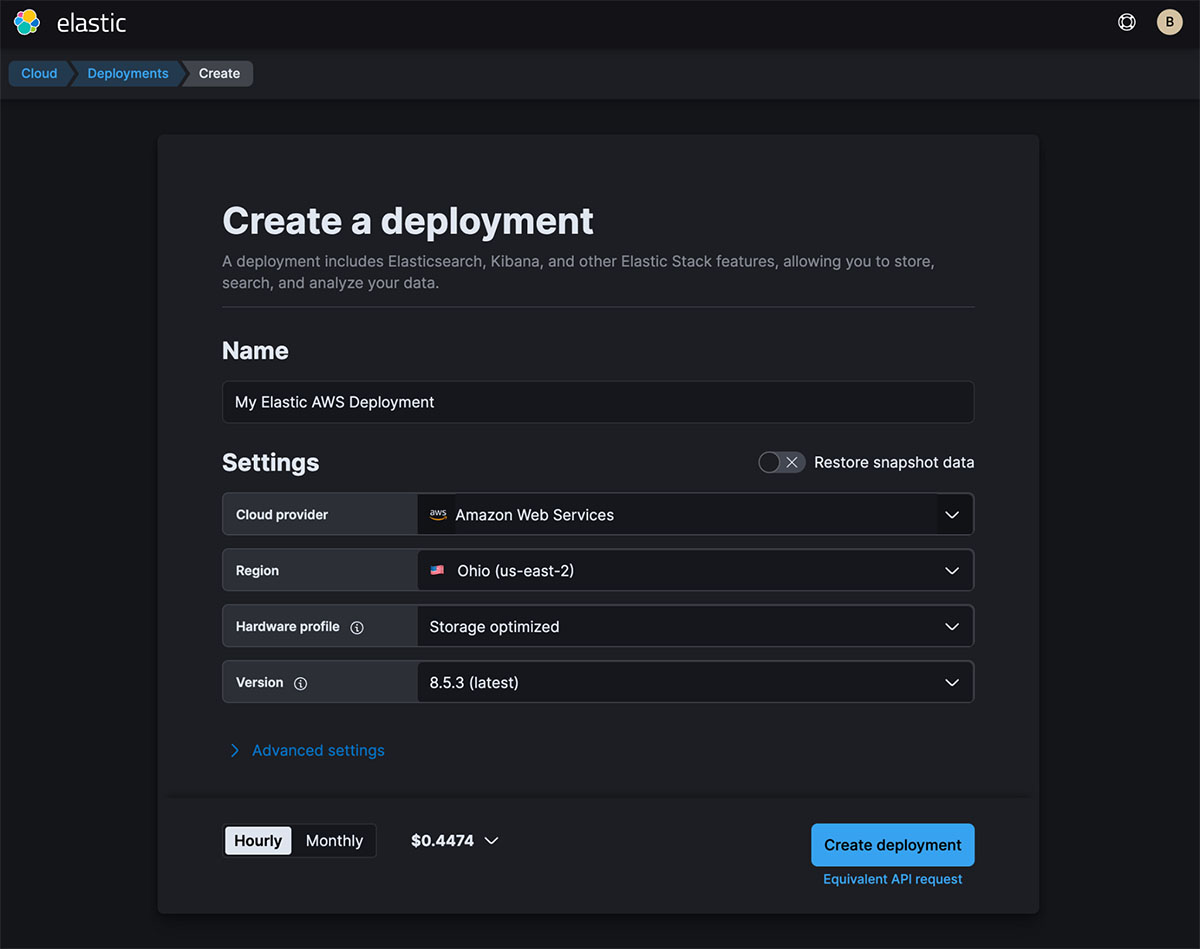
After you create your deployment, copy the Elasticsearch endpoint to use in a later step.

The endpoint should be an AWS endpoint, such as https://thevaa-cluster-01.es.us-east-1.aws.found.io.
Enable Elastic’s AWS integration
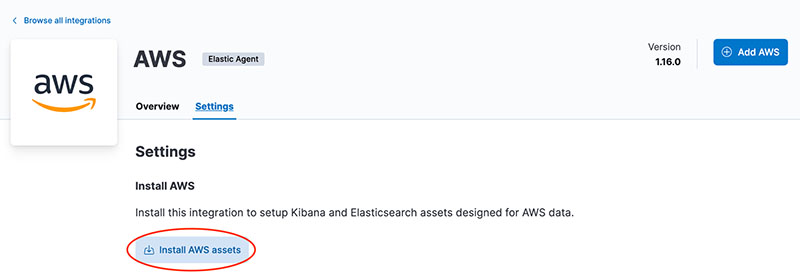
In your deployment’s Elastic Integration section, navigate to the AWS integration and choose Install AWS assets.
Configure a Firehose delivery stream
Create a new delivery stream on the Kinesis Data Firehose console. This is where you provide the endpoint you saved earlier. Refer to the following screenshot for the destination settings, and for more details, refer to Choose Elastic for Your Destination.

In this example, we are pulling in VPC flow logs via the data stream parameter we added (logs-aws.vpcflow-default). The parameter es_datastream_name can be configured with one of the following types of logs:
- logs-aws.cloudfront_logs-default – AWS CloudFront logs
- logs-aws.ec2_logs-default – Amazon Elastic Compute Cloud (Amazon EC2) logs in CloudWatch
- logs-aws.elb_logs-default – Elastic Load Balancing logs
- logs-aws.firewall_logs-default – AWS Network Firewall logs
- logs-aws.route53_public_logs-default – Amazon Route 53 public DNS queries logs
- logs-aws.route53_resolver_logs-default – Route 53 DNS queries and responses logs
- logs-aws.s3access-default – Amazon S3 server access log
- logs-aws.vpcflow-default – VPC flow logs
- logs-aws.waf-default – AWS WAF logs
Deploy your application
Follow the instructions on the GitHub repo and instructions in the AWS Three Tier Web Architecture workshop to deploy your application.
After you install the app, get your credentials from AWS to use with Elastic’s AWS integration.
There are several options for credentials:
- Use access keys directly
- Use temporary security credentials
- Use a shared credentials file
- Use an AWS Identity and Access Management (IAM) role Amazon Resource Name (ARN)
For more details, refer to AWS Credentials and AWS Permissions.
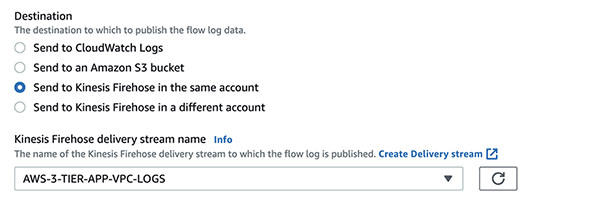
Configure VPC flow logs to send to Kinesis Data Firehose
In the VPC for the application you deployed, you need to configure your VPC flow logs and point them to the Firehose delivery stream.
Validate the VPC flow logs
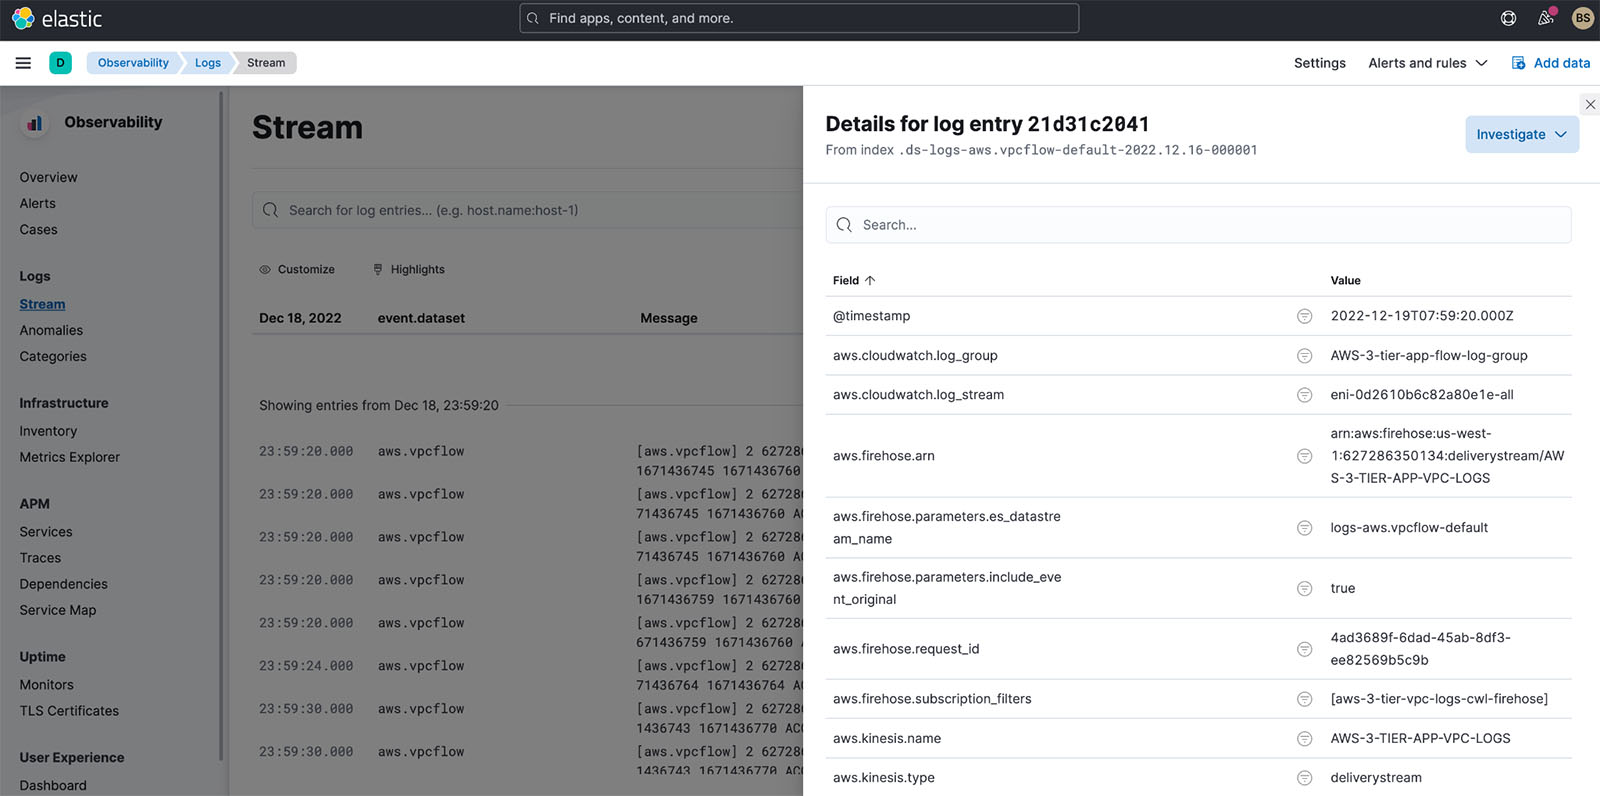
In the Elastic Observability view of the log streams, you should see the VPC flow logs coming in after a few minutes, as shown in the following screenshot.
Analyze VPC flow logs in Elastic
Now that you have VPC flow logs in Elastic Cloud, how can you analyze them? There are several analyses you can perform on the VPC flow log data:
- Use Elastic’s Analytics Discover capabilities to manually analyze the data
- Use Elastic Observability’s anomaly feature to identify anomalies in the logs
- Use an out-of-the-box dashboard to further analyze the data
Use Elastic’s Analytics Discover to manually analyze data
In Elastic Analytics, you can search and filter your data, get information about the structure of the fields, and display your findings in a visualization. You can also customize and save your searches and place them on a dashboard.
For a complete understanding of Discover and all of Elastic’s Analytics capabilities, refer to Discover.
For VPC flow logs, it’s important to understand the following:
- How many logs were accepted or rejected
- Where potential security violations occur (source IPs from outside the VPC)
- What port is generally being queried
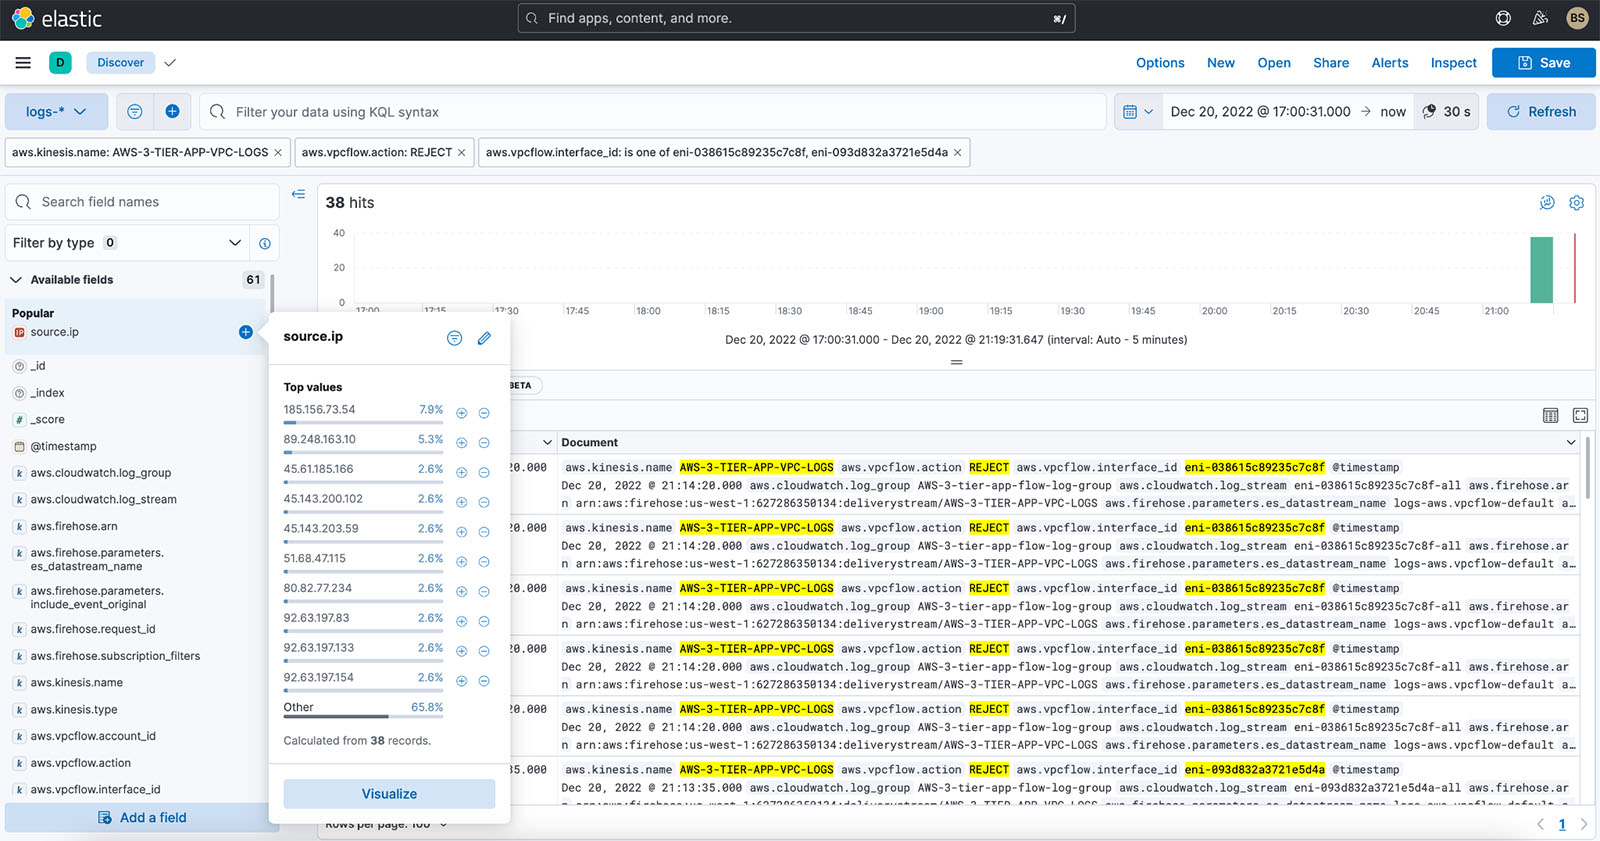
For our example, we filter the logs on the following:
- Delivery stream name –
AWS-3-TIER-APP-VPC-LOGS - VPC flow log action –
REJECT - Time frame – 5 hours
- VPC network interface – Webserver 1 and Webserver 2 interfaces
We want to see what IP addresses are trying to hit our web servers. From that, we want to understand which IP addresses we’re getting the most REJECT actions from. We simply find the source.ip field and can quickly get a breakdown that shows 185.156.73.54 is the most rejected for the last 3 or more hours we’ve turned on VPC flow logs.
Additionally, we can create a visualization by choosing Visualize. We get the following donut chart, which we can add to a dashboard.

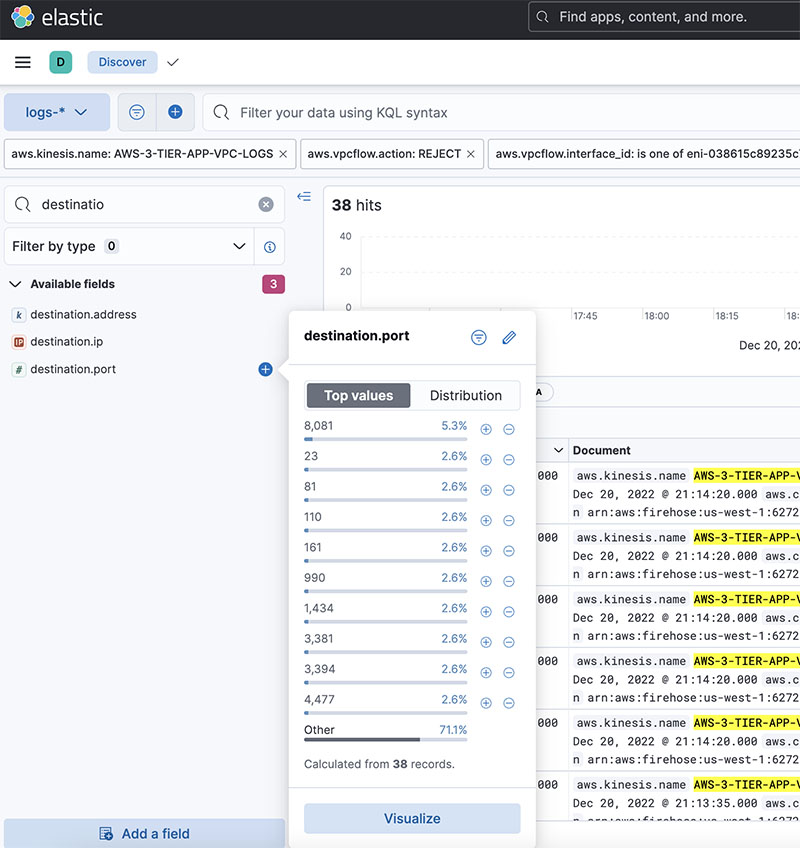
Additionally to IP addresses, we want to also see what port is being hit on our web servers.
We select the destination port field, and the pop-up shows us that port 8081 is being targeted. This port is generally used for the administration of Apache Tomcat. This is a potential security issue, however port 8081 is turned off for outside traffic, hence the REJECT.
Detect anomalies in Elastic Observability logs
In addition to Discover, Elastic Observability provides the ability to detect anomalies on logs using machine learning (ML). The feature has the following options:
- Log rate – Automatically detects anomalous log entry rates
- Categorization – Automatically categorizes log messages
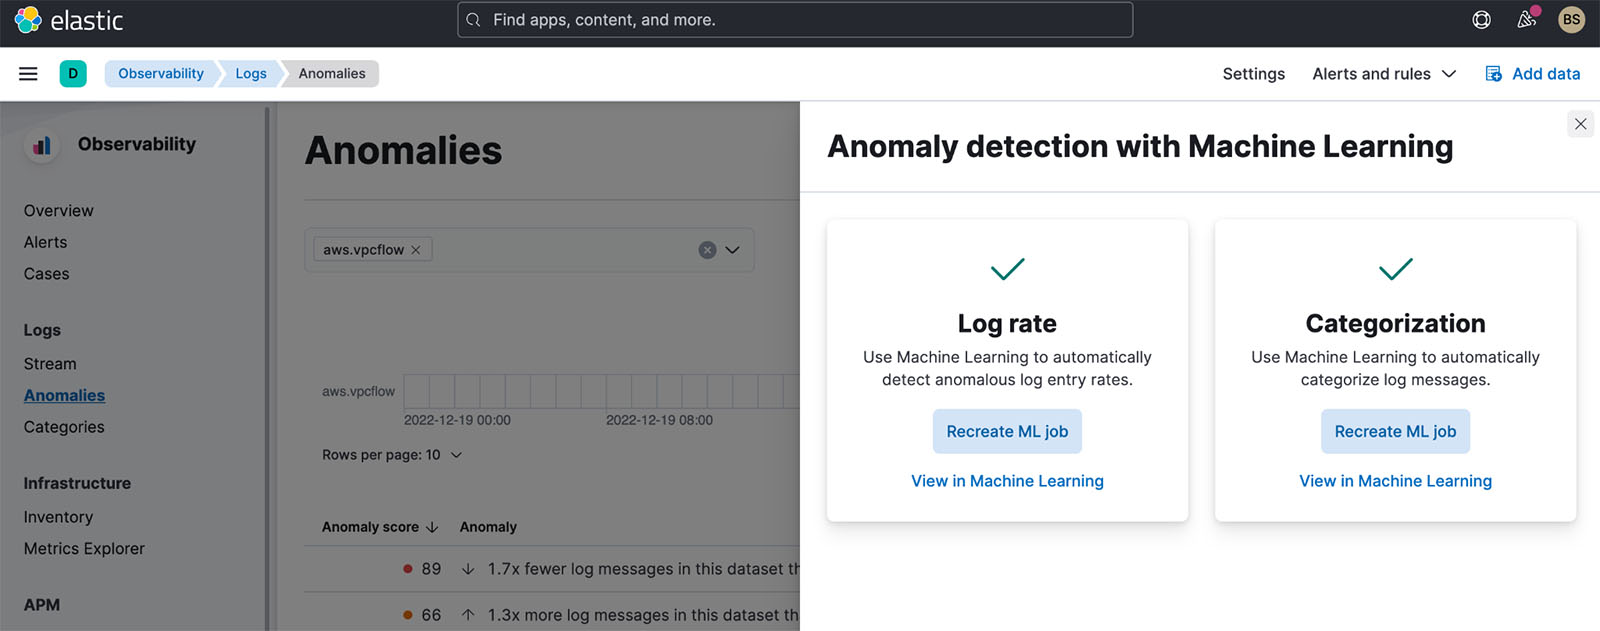
For our VPC flow log, we enabled both features. When we look at what was detected for anomalous log entry rates, we get the following results.

Elastic immediately detected a spike in logs when we turned on VPC flow logs for our application. The rate change is being detected because we’re also ingesting VPC flow logs from another application for a couple of days prior to adding the application in this post.
We can drill down into this anomaly with ML and analyze further.
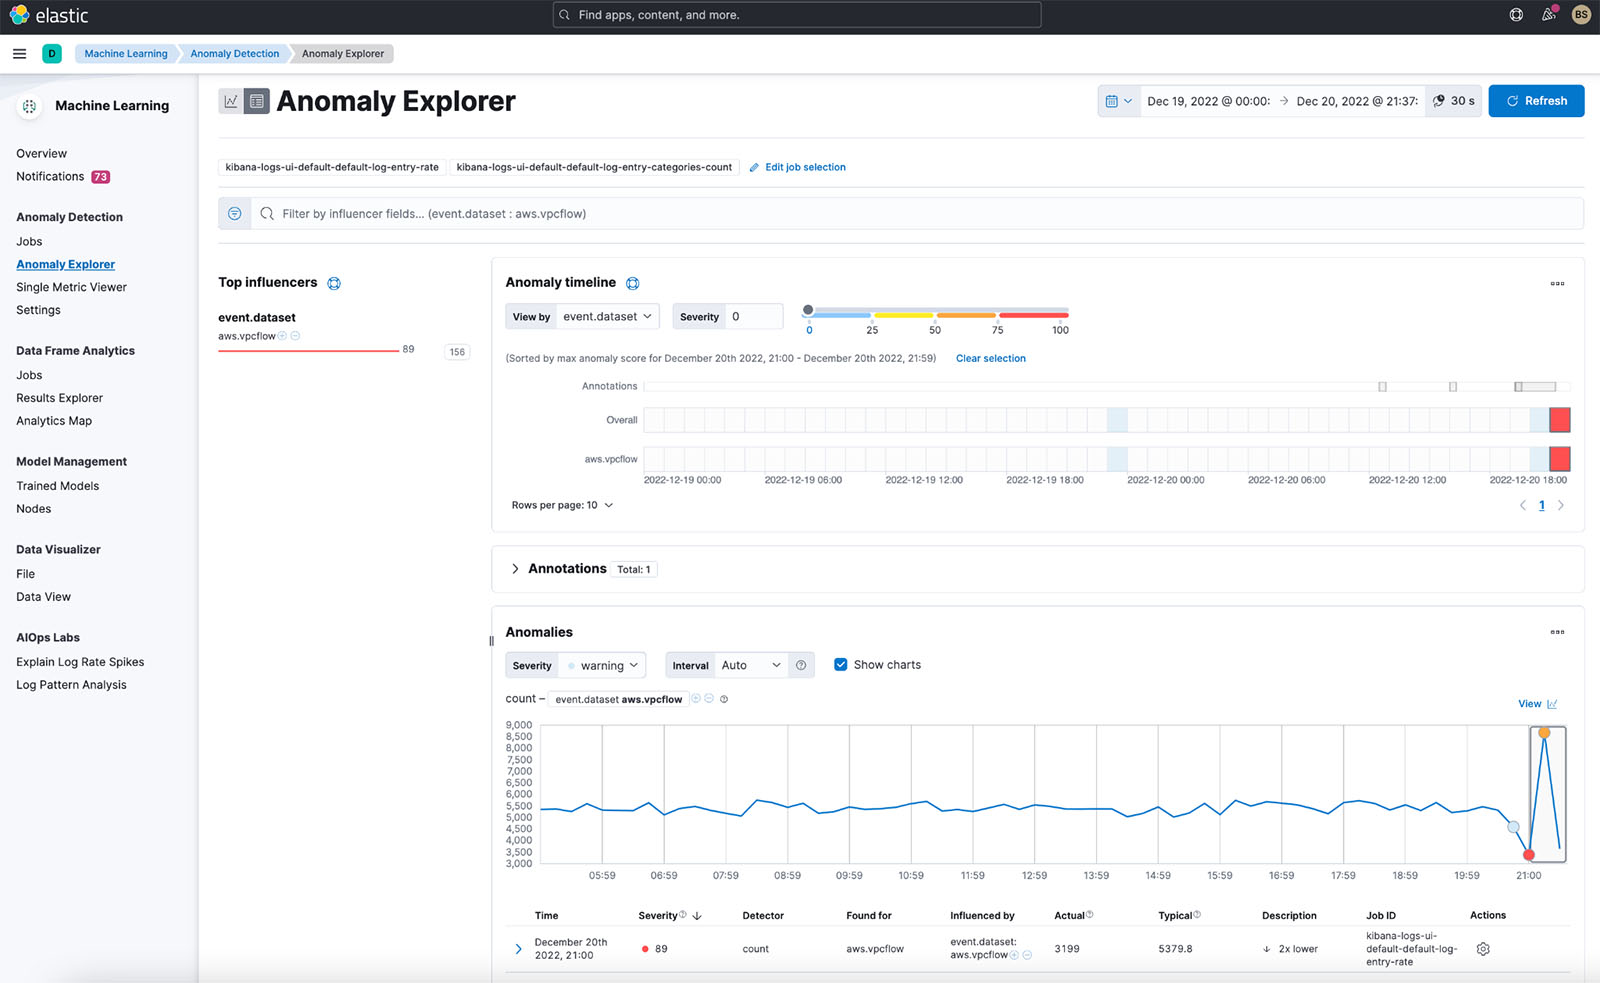
To learn more about the ML analysis you can utilize with your logs, refer to Machine learning.
Because we know that a spike exists, we can also use the Elastic AIOps Labs Explain Log Rate Spikes capability. Additionally, we’ve grouped them to see what is causing some of the spikes.

In the preceding screenshot, we can observe that a specific network interface is sending more VPC log flows than others. We can drill down into this further in Discover.
Use the VPC flow log dashboard
Finally, Elastic also provides an out-of-the-box dashboard to show the top IP addresses hitting your VPC, geographically where they are coming from, the time series of the flows, and a summary of VPC flow log rejects within the time frame.
You can enhance this baseline dashboard with the visualizations you find in Discover, as we discussed earlier.

Conclusion
This post demonstrated how to configure an integration with Kinesis Data Firehose and Elastic for efficient infrastructure monitoring of VPC flow logs in Elastic Kibana dashboards. Elastic offers flexible deployment options on AWS, supporting software as a service (SaaS), AWS Marketplace, and bring your own license (BYOL) deployments. Elastic also provides AWS Marketplace private offers. You have the option to deploy and run the Elastic Stack yourself within your AWS account, either free or with a paid subscription from Elastic. To get started, visit the Kinesis Data Firehose console and specify Elastic as the destination. To learn more, explore the Amazon Kinesis Data Firehose Developer Guide.
About the Authors
 Udayasimha Theepireddy is an Elastic Principal Solution Architect, where he works with customers to solve real world technology problems using Elastic and AWS services. He has a strong background in technology, business, and analytics.
 Antony Prasad Thevaraj is a Sr. Partner Solutions Architect in Data and Analytics at AWS. He has over 12 years of experience as a Big Data Engineer, and has worked on building complex ETL and ELT pipelines for various business units.
 Mostafa Mansour is a Principal Product Manager – Tech at Amazon Web Services where he works on Amazon Kinesis Data Firehose. He specializes in developing intuitive product experiences that solve complex challenges for customers at scale. When he’s not hard at work on Amazon Kinesis Data Firehose, you’ll likely find Mostafa on the squash court, where he loves to take on challengers and perfect his dropshots.