AWS Big Data Blog
Analyzing VPC Flow Logs using Amazon Athena, and Amazon QuickSight
February 2, 2022: Blog updated by Chaitanya Shah.
February 9, 2024: Amazon Kinesis Data Firehose has been renamed to Amazon Data Firehose. Read the AWS What’s New post to learn more.
Organizations of different size who migrate their applications in cloud or applications born in cloud makes use of various cloud services to innovate and provide better, cutting edge services to their customers. While these applications provide business functionality to customers it needs to transfer data over network for the components or services, your application is dependent on to process the data. The data that gets transferred by these applications goes over the network within cloud infrastructure andOr outbound to the internet. For organizations of all the sizes, type it is very important to focus on network security and web applications security. Monitoring network traffic provides visibility into potential security and operational issues which are crucial insights that enable developers, site reliability engineers or system operators and, admins to make sure your network is well protected and identify security issues.
AWS has VPC Flow Logs which enables you to track the IP traffic going to and from the network interfaces in your VPC for your workloads. With the increasing data that is ingested by VPC Flow Logs it is difficult to perform analysis on it without available analytics tools and solutions. You can deliver flow logs from VPC to Amazon CloudWatch or Amazon S3. Analyzing VPC Flow Logs can help you understand how your applications are communicating over your VPC network, to identify behavioral patterns, understand application processing flows, and investigate and diagnose issues.
This blog post shows how to build a VPC Flow Logs analysis for visualizations using Amazon QuickSight, AWS Lambda, Amazon S3 and Amazon Athena with following the best practices for compressing and partitioning data in Amazon S3, to reduce query latencies and drive down query costs.
Summary of the solution
The solution described here is divided into two parts:
- Send VPC Flow Logs to S3 for Analysis with Athena. This section describes how to publish flow log data to S3 in parquet format with Hive-compatible S3 prefixes partitioned by year, month, day and hour e.g. year/month/day/hour prefix. And how to create a table in Athena and view so that you can query this data.
- Visualize Your Logs in QuickSight. Here you’ll learn how to use QuickSight and its Athena connector to build flow log analysis dashboards that you can share with other users in your organization and how to use the Well Architected Lab for VPC Flow Logs analysis dashboard to quickly deploy it in your account. You will also learn how to store the flow logs from multiple accounts to central/dedicated network account and visualize them centrally using Amazon QuickSight.
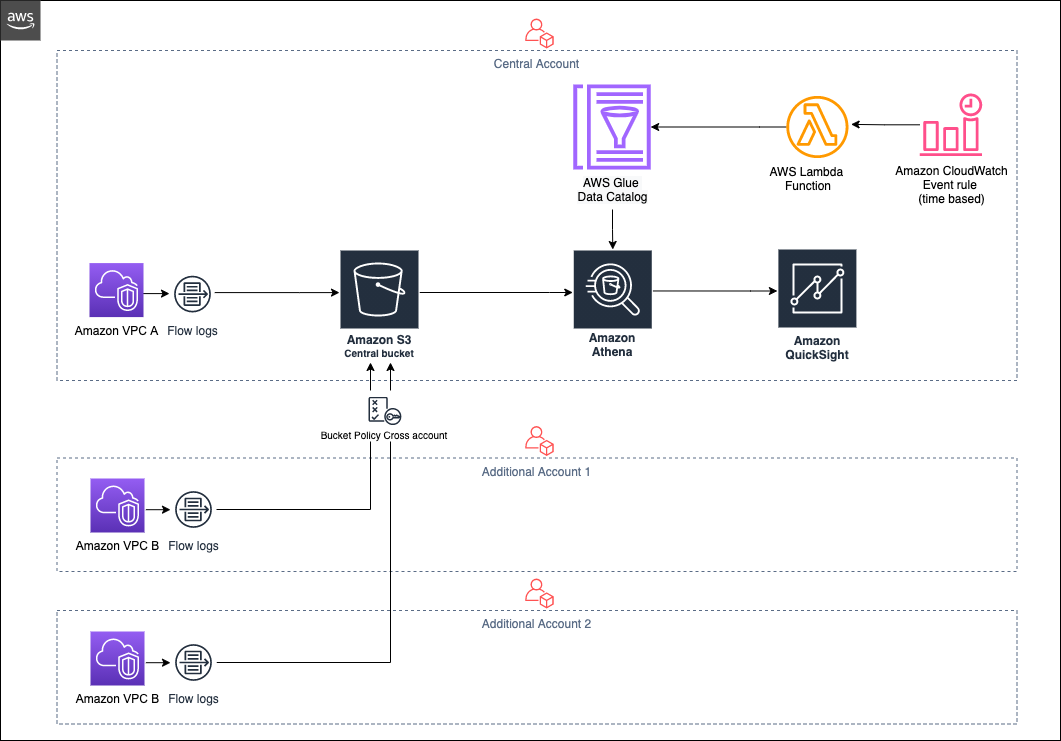
Architecture for Analyzing VPC Flow Logs for multiple accounts centrally
Below is a diagram showing how the various services work together to visualize logs analysis centrally in Amazon QuickSight.
Partitioning your data is one of three strategies for improving Athena query performance and reducing costs. The other two are compressing your data, and converting it into columnar formats such as Apache Parquet. You can configure VPC to deliver flow logs to Amazon S3 as described in this blog post
To visualize VPC flow logs and integrate with Athena you have the following options:
Option 1:
Create S3 bucket, Athena database, table, AWS Lambda function per account and visualize them in Amazon QuickSight.
Option 2:
Create S3 bucket, Athena database, table, AWS Lambda function and QuickSight visualizations in central account. Enable VPC flow logs from other AWS accounts to push log records to central S3 bucket to visualize them centrally in QuickSight dashboard.
Send VPC Flow Logs to S3 for Analysis with Athena
If you want to ingest VPC flow logs into S3 bucket per account (option 1), then you can follow instructions from Blog Post that delivers VPC flow logs in the Apache Parquet format, making it easier, faster, and more cost-efficient to analyze your VPC flow logs stored in Amazon S3. You can also deliver VPC flow logs to Amazon S3 with Hive-compatible S3 prefixes partitioned by the hour.
If you want to ingest VPC flow logs into S3 bucket centrally from multiple AWS accounts (option 2) then you can follow section Enable VPC Flow Logs for VPC Flow Logs Analysis using Amazon QuickSight from Well Architected Labs
Create Athena integration and Lambda Function to add partitions to external table
Once the flow log data starts arriving in S3, you can write ad hoc SQL queries against it using Athena.
For option 1 above you can use point-and-click Amazon Athena integration to create database and external Athena table along with few pre-defined queries created by this integration. This will also create A Lambda function that loads new partitions to the table on the specified schedule (daily, weekly, or monthly)
For option 2 you can follow section Create Athena resources, Lambda function and CloudWatch rule from Well Architected Labs. This will also create a Lambda function that loads new partitions to the table on daily schedule.
For users that prefer to build dashboards and interactively explore the data in a visual manner, QuickSight allows you to easily build rich visualizations on top of Athena.
Visualize Your Logs in QuickSight
QuickSight allows you to visualize your Athena tables with a few simple clicks. You can sign up for QuickSight using your AWS account and you get 4 authors free in trial for 30 days and 10 GB of SPICE allocation is included with every QuickSight author license.
Before connecting QuickSight to Athena, make sure to grant QuickSight access to Athena and the associated S3 buckets in your account as described here.
For option 1 you can then create a new data set in QuickSight based on the Athena table you created by point-and-click Amazon Athena integration.
Log into QuickSight and choose Datasets, New data set. Choose Athena as a new data source.
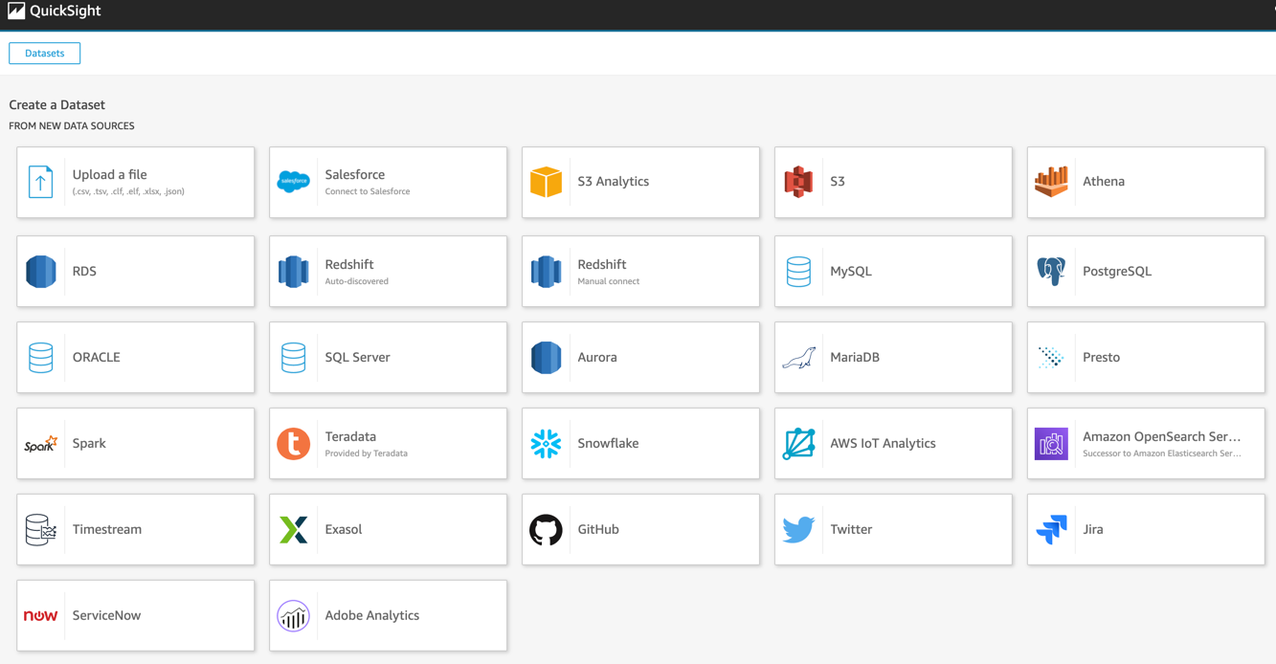
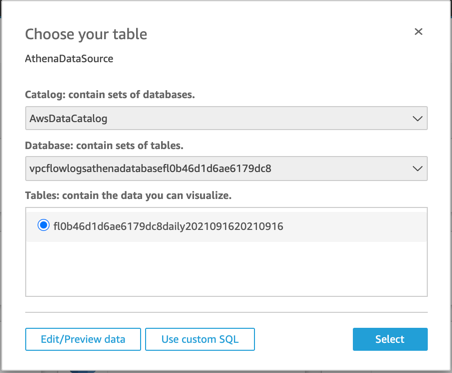
Name your data source “AthenaDataSource”. Select the default schema and the table created by either option 1 or option 2.
Choose Edit/Preview data. For start_time and end_time, set the data format as a date rather than a number. These two fields represent the start and end times of the capture window for the flow logs and come into the system as Unix seconds timestamps.
Now select Save and visualize.
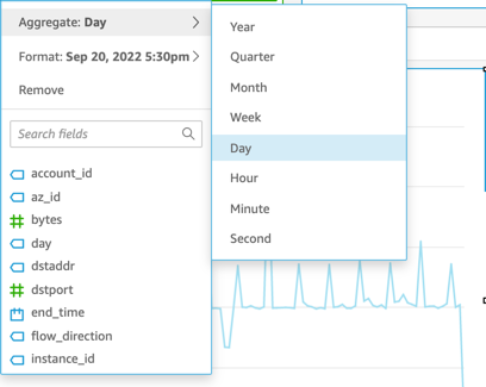
Let’s look at the start times for the different capture windows and the amount of bytes that were sent. We’ll do this by selecting start_time and bytes from the field list. Notice QuickSight will automatically display a time chart with the amount of traffic. You can easily change the date parameter to set different time granularities.
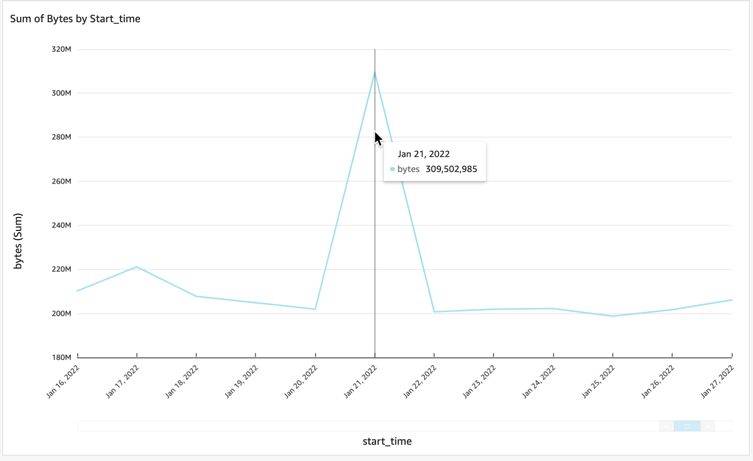
Here is an example showing a large spike of traffic for one day. This tells us that there was a lot of traffic on this day compared to the other days being plotted.
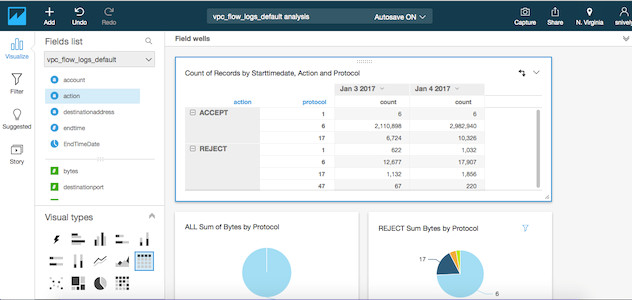
You can easily build a rich analysis of REJECT and ACCEPT traffic across ports, IP addresses, and other facets of your data. You can then publish this analysis as a dashboard that can be shared with other QuickSight users in your organization.
For option 2, to visualize VPC Flow logs centrally in Amazon QuickSight follow section Create VPC Flow Logs QuickSight Analysis Dashboard from Well Architected Labs.
Conclusion
In the past, to analyze logs you had to extensively prepare data for specific query use cases or provision and operate storage and compute resources. With Amazon Athena and Amazon QuickSight, you can now publish, store, analyze, and visualize log data more flexibly. Instead of focusing on the underlying infrastructure needed to perform the queries and visualize the data, you can focus on investigating the logs.
About the Authors
 Ben Snively is a Public Sector Specialist Solutions Architect. He works with government, non-profit and education customers on big data and analytical projects, helping them build solutions using AWS. In his spare time he adds IoT sensors throughout his house and runs analytics on it.
 Ian Robinson is a Specialist Solutions Architect for Data and Analytics. He works with customers throughout EMEA, helping them to use AWS to create value from the connections in their data. In his spare time he’s currently restoring a reproduction 1960s Dalek.
 Chaitanya Shah is a Sr. Technical Account Manager with the AWS based out of New York, NY. He has over 22 years of experience working with enterprise customers. He loves to code and actively contributes to the AWS solutions, labs to help customers solve complex problems and guide them on best practices on cloud migrations. He is also specialized in data and analytics domain.
Related
Analyze Security, Compliance, and Operational Activity Using AWS CloudTrail and Amazon Athena