AWS Big Data Blog
Build a distributed big data reconciliation engine using Amazon EMR and Amazon Athena
This is a guest post by Sara Miller, Head of Data Management and Data Lake, Direct Energy; and Zhouyi Liu, Senior AWS Developer, Direct Energy.
Enterprise companies like Direct Energy migrate on-premises data warehouses and services to AWS to achieve fully manageable digital transformation of their organization. Freedom from traditional data warehouse constraints frees up time and resources to focus on business innovation, and for Direct Energy, building data models that allow us to focus on customer satisfaction. These projects typically start by replicating data from source relational database systems (RDBS) into a single data repository, also known as a data lake. Before you can use this data to drive business insights, you should test it for quality and integrity. The quality of your data has a ripple effect on the insights you can extract and the trust people have in your insights.
Our post tackles data quality and integrity as we introduce a reconciliation tool that uses Amazon EMR and Amazon Athena to provide you with a cloud-native engine to validate vast amounts of data effectively at scale. The engine provides customized summary reports so you can interactively analyze the quality of your data. We also discuss the clarity that the engine has bought to the performance and quality of source ingestion and extract, transform, and load (ETL) processes.
About Direct Energy
Direct Energy is a North American retail energy and energy services provider and a subsidiary of the UK-based utility company, Centrica. Serving over four million residential and business customers, we strive to give you choice, simplicity, and innovation with simple solutions to track, understand, and control the electricity and natural gas you use.
Teams across Direct Energy came together to ensure a successful transition from on-premises SQL Server data warehouses to AWS data lakes, to include the following:
- Our Management Information Systems (MIS) team manages core AWS infrastructure, including AWS Identity and Access Management (IAM), Amazon EMR configurations, and more. The team also manages the ingestion of raw data directly from source data warehouses and billing systems housed on SQL Server, Oracle, and MySQL.
- Our Data Engineering team, embedded in business teams, picks up the raw source data after it lands in Amazon Simple Storage Service (Amazon S3), casts data types, merges data for select tables, and transforms the data to build out our business data warehouse, data marts, and datasets using PySpark on Amazon EMR. This includes the orchestration of dependencies across these steps.
- Completed data marts and datasets are made available to the business through Amazon Redshift and Microsoft Power BI for reporting and analytical modeling processes, such as churn propensity, customer lifetime value, price elasticity, and segmentation.
Due to the various layers and intricacies required to build out our finalized business data marts and datasets, testing is required at each step.
Why Direct Energy needed a reconciliation engine
The Data Engineering team at Direct Energy needed an automated way to check data quality at the row and field levels for data stored in Amazon S3 and those produced by AWS Glue and viewed through Athena against on-premises source systems.
Initially, our MIS team ran daily row counts against source and Athena and was held to a +/-99% SLA, accounting for potential timing issues. We quickly found this process had issues: this only checks that the row count matches between systems and doesn’t adequately profile data or measure comprehensive data quality. Furthermore, the target data on Amazon S3 should match exactly with the source system, but it’s less efficient to run row- and field-level checks on large volumes of data.
Beyond this, through the decommissioning of one of our major customer data warehouses, we rewrote over 350 SQL Server stored procedures in PySpark. Another layer of testing is required here to debug our code and to ensure our ETL processes are producing the same results that they previously produced from our on-premises server. This includes the testing of both staging and final tables.
Because we can’t do manual testing efficiently at this scale, we needed a solution that would enable automated testing of data quality at the row and field levels. We architected and developed a reconciliation engine called Pythagoras to randomly select a sample of records to check cell by cell. The tool runs new samples daily to ensure better coverage. This check validates whether individual values match between tables on Amazon S3 and in our source systems.
Pythagoras architecture
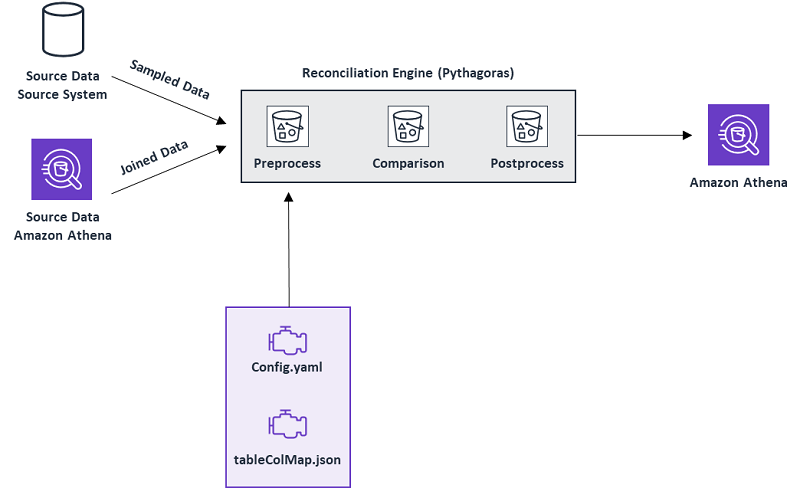
We use a config.yaml file to define the source databases, source tables, how to connect to source systems, reconciliation tasks, and other parameters required to specify the task. A sample ratio for the on-premises server tables is also defined here.
We use table_cols_mapping.json to define the column mapping between our on-premises server tables and the tables we expect to see when querying through Athena.
The reconciliation engine outputs a report, which is saved directly to Amazon S3 and can be viewed with Athena. Here, we can check results in SQL or PySpark or can export to Microsoft Excel.
The following diagram provides a walkthrough of the process. We use Apache Spark running on Amazon EMR to execute the reconciliation engine steps: preprocess, comparison, and postprocess.
Preprocess
The preprocessing component in the preceding architecture prepares data for reconciliation, and the output is used as an input in the comparison component. The preprocess step is responsible for several important functions:
- The parse file
config.yamldefines parameters such as connection strings for data sources, the log path, performance-tuning parameters, the location of reconciliation reports, and more. In addition, we add the reconciliation group and reconciliation task in the file to instruct Pythagoras to do the data integrity testing. This information tells the PySpark job where to fetch the data and the random sample ratio percentage to use in the reconciliation run. See the following code example: - We fetch data from the two data sources in this step.
- The parse file
tablecolmap.jsonmaps the columns to be reconciled from the two data sources. For example, in the following JSON code, we see the value of columnfruitAfrom data source B needs to be compared with the value of columnfruit1from data source A. The same logic applies for columnanimalBandanimal2. - If we have a record from data source A, how can we find the corresponding record in target B? The answer is by using a key column. This key should exist in both sources and it should be unique. The component looks up the user-defined key in the
joined_keys.pyfile to join the two datasets as a single data frame via the key and passes it to the comparison component. - Normalizing data types for both data sources also happens in this step if needed. For example, if the value of column
xfrom source A is1stored as an integer, and the value of columnxfrom source B is1stored as a string, these values are treated as different without any data type normalization; however, they are the same if we ignore the data type formatting.
Comparison
After fetching the output data frame from the preprocess pipeline, the comparison component is ready to perform the reconciliation. The following table shows an example schema of an input data frame.
| id | souceA_animal | sourceA_fruit | sourceA_car | animal | fruit | car |
1 |
cat |
orange |
jeep |
cat |
orange |
jeep |
2 |
dog |
apple |
toyota |
dog |
pear |
toyota |
Columns starting with prefix sourceA_ indicate the data is from data source A. Columns titled animal, fruit, and car come from data source B. In this instance, the separated tabular data is linked and joined on a key id; the key should be uniquely defined in both data sources.
The engine reconciles values from columns in the preceding input data frame. The following table summarizes the output.
| id | souceA_animal | sourceA_fruit | sourceA_car | animal | fruit | car | matched_animal | matched_fruit | matched_car | total_matched |
1 |
cat |
orange |
jeep |
cat |
orange |
jeep |
TRUE |
TRUE |
TRUE |
TRUE |
2 |
dog |
apple |
toyota |
dog |
pear |
toyota |
TRUE |
FALSE |
TRUE |
FALSE |
Columns with the prefix matched_ indicate the reconciled result of the corresponding cells. For instance, in the second record, column sourceA_fruit is apple and column fruit is pear, so the value of matched_fruit is FALSE.
Postprocess
Based on the detailed reconciled results, the engine generates various customized reports and saves those reports to a configured location on Amazon S3. The end-user can use SQL to query against Athena to quickly analyze the data, or can download the results to Microsoft Excel. In this section, we describe three of the reports we use daily.
The following table shows the reconciliation summary at the column level.
| table_name | col_name | num_matched_true | num_matched_false |
MyFavorite |
matched_animal |
2 | 0 |
MyFavorite |
matched_car |
2 | 0 |
MyFavorite |
matched_fruit |
1 | 1 |
MyFavorite |
total_matched |
1 | 1 |
This report is generated based on the information from the preceding output. Let’s assume the table is called MyFavorite. The engine counts the matched and unmatched cases over each column and provides an aggregated view of the number of records matching for each column.
In a production environment, the Data Engineering team needs to reconcile hundreds of tables in one batch. Pythagoras naturally supports wrapping these into one reconciliation task. In this case, we can generate another report to show the reconciliation summary per reconciliation task.
For example, in addition to the table MyFavorite, the reconciliation task has another table called MySkills, which needs to be reconciled. The following table shows its reconciliation summary at the column level.
| table_name | col_name | num_matched_true | num_matched_false |
MySkills |
matched_sport |
4 | 0 |
MySkills |
matched_instrument |
3 | 1 |
MyFavorite |
total_matched |
3 | 1 |
Base on the two preceding summaries, Pythagoras calculates high-level table statistics, as shown in the following table.
| table_name | data_quality | total_match_rate | issue_desc |
MyFavorite |
Red |
50% | columns: fruit |
MySkills |
Amber |
75% | columns: instrument |
In the config.yml file, the user defines the parameter total_match_rate_threshold. For this use case, let’s say we define it as 50%. If the total_match_rate is greater than 50% and less than 100%, we label data_quality as Amber; if it is less than or equal than 50%, we label it as Red. The column issue_desc shows the list of unmatched columns (all columns with any unmatched values).
These reports help us assess overall data quality for all tables in one reconciliation task and quickly locate problem tables and columns. We use Athena to query the Pythagoras results using SQL. For example, in the following SQL query, we can filter ingested tables with data quality flagged as Red by Pythagoras (in other words, the MyFavorite table is returned):
We also use Athena to query Pythagoras results for every step of our ETL process. We review a daily report that enables us to focus on which steps are having issues and the top columns that are experiencing a mismatch.
In the following output table, we would focus on steps 2, 3, and 9 first, because there are glaring issues and other steps may have dependencies on these, then come back to step 5 for some minor cleanup. Otherwise, anything above 99.9% is left alone, accounting for timing issues in our billing systems, for example.
| table_name | data_quality | total_match_rate | issue_desc |
step1 |
green |
0.9996608 |
columns: col1: 200, col2: 93, col3: 12, col4: 10, col5:10 |
step2 |
red |
0.82664197 |
columns: col5: 30, col3: 22, col4: 16, col1: 15, col2: 14 |
step3 |
red |
0.95370907 |
columns: col1: 50, col2: 43, col3: 12, col4: 10, col5:1 |
step4 |
green |
1 |
|
step5 |
amber |
0.9987953 |
columns: col1: 200, col2: 93, col3: 12, col4: 10, col5:14 |
step6 |
green |
0.99992985 |
columns: col1: 25 |
step7 |
green |
0.99950025 |
columns: col1: 200, col2: 93 |
step8 |
green |
0.99993417 |
columns: col1: 50 |
step9 |
red |
0.24940514 |
columns: col1: 19000, col2: 4293, col3: 1400, col4: 1000, col5:180 |
step10 |
green |
0.99930817 |
columns: col1: 573, col2: 420, col3: 120 |
… |
… |
… |
… |
We can also perform SQL queries in Athena to drill down further into each step to identify each column’s actual match rate for that particular sample. For example, the following table looks at step2:
| table_name | col_name | num_match_true | num_match_false |
step2 |
col5 |
277 |
30 |
step2 |
col3 |
285 |
22 |
step2 |
col4 |
291 |
16 |
step2 |
col1 |
292 |
15 |
step2 |
col2 |
293 |
14 |
For this use case, we want to look at col5 first because 30 records in the sample are unmatched, whereas 277 records are matched, then work our way down the list to clean up each column.
Conclusion
In this post, we discussed how Direct Energy uses a data reconciliation tool called Pythagoras to automate and test data quality checks at scale, using Amazon EMR for verify the data quality and Athena to analyze and report the results. Pythagoras brought significant clarity regarding the performance and quality of both Direct Energy source data ingestion and ETL processes, while eliminating the need for manual testing and enabling automated, randomized testing on a much greater scale.
Thus far, the ETL processes for two billing systems have been thoroughly vetted, resulting in 15% and 48% improvements in accuracy. We found that value mismatches are the most common data integrity issue in our data ingestion pipeline. Thanks to Pythagoras, we can quickly and precisely determine these mismatches in large datasets. Data engineering and platform teams then use the data Pythagoras provides to debug our ETL pipelines. After we adjust our pipelines, we run Pythagoras again to ensure the issue is fixed and stays fixed.
The implementation of this tool empowers Direct Energy to decommission widely used data platforms with precision and efficiency, and builds trust in our company’s data quality and integrity across the business.
About the Authors
 Sara Miller is the Head of Data Management and Data Lake at Direct Energy, a subsidiary of Centrica. She has been with the organization for more than five years. As a versatile leader proficient in data engineering, mathematics, and statistics, Sara has helped organizations transform their reporting and analytics capabilities and has been instrumental in establishing various data science and analytics teams. She currently manages the end-to-end ETL pipeline for the North America residential portfolio, to include the transition from on-premise data warehousing to Amazon Web Services.
 Zhouyi Liu is the Senior AWS Developer at Direct Energy, a subsidiary of Centrica. He focuses on the tech stack of Big Data, Machine Learning, AI. He currently works on the end-to-end ETL pipeline for the North America residential portfolio, to include the transition from on-premise data warehousing to Amazon Web Services. Outside of work, he also enjoys the roles of father, husband, and spending time with family.