AWS Big Data Blog
Data preparation using an Amazon RDS for MySQL database with AWS Glue DataBrew
With AWS Glue DataBrew, data analysts and data scientists can easily access and visually explore any amount of data across their organization directly from their Amazon Simple Storage Service (Amazon S3) data lake, Amazon Redshift data warehouse, or Amazon Aurora and Amazon Relational Database Service (Amazon RDS) databases. You can choose from over 250 built-in functions to merge, pivot, and transpose the data without writing code.
Now, with added support for JDBC-accessible databases, DataBrew also supports additional data stores, including PostgreSQL, MySQL, Oracle, and Microsoft SQL Server. In this post, we use DataBrew to clean data from an RDS database, store the cleaned data in an S3 data lake, and build a business intelligence (BI) report.
Use case overview
For our use case, we use three datasets:
- A school dataset that contains school details like school ID and school name
- A student dataset that contains student details like student ID, name, and age
- A student study details dataset that contains student study time, health, country, and more
The following diagram shows the relation of these tables.
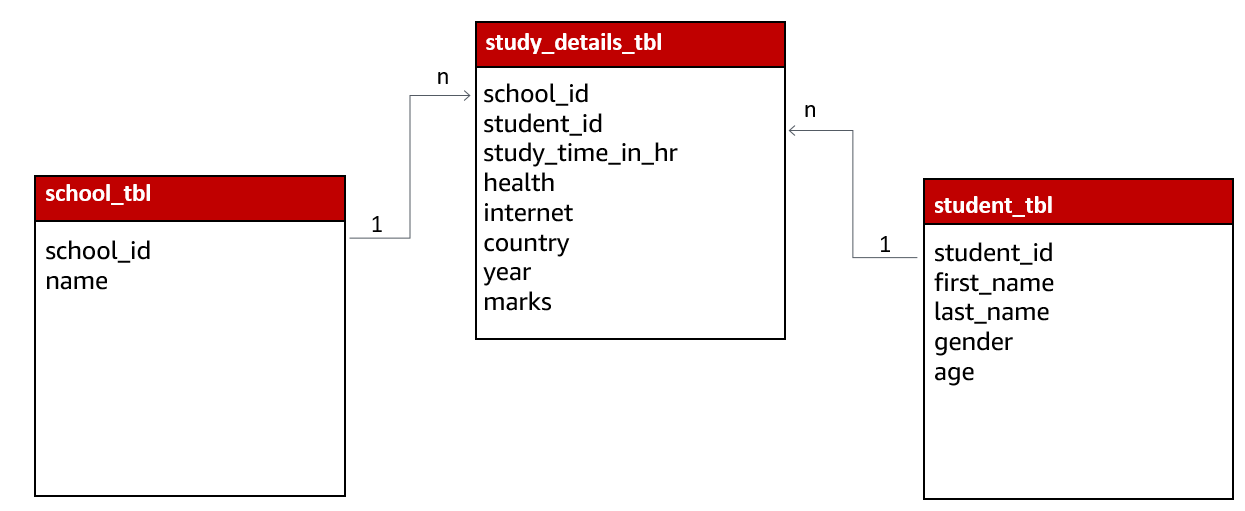
For our use case, this data is collected by a survey organization after an annual exam, and updates are made in Amazon RDS for MySQL using a Java script-based frontend application. We join the tables to create a single view and create aggregated data through a series of data preparation steps, and the business team uses the output data to create BI reports.
Solution overview
The following diagram illustrates our solution architecture. We use Amazon RDS to store data, DataBrew for data preparation, Amazon Athena for data analysis with standard SQL, and Amazon QuickSight for business reporting.
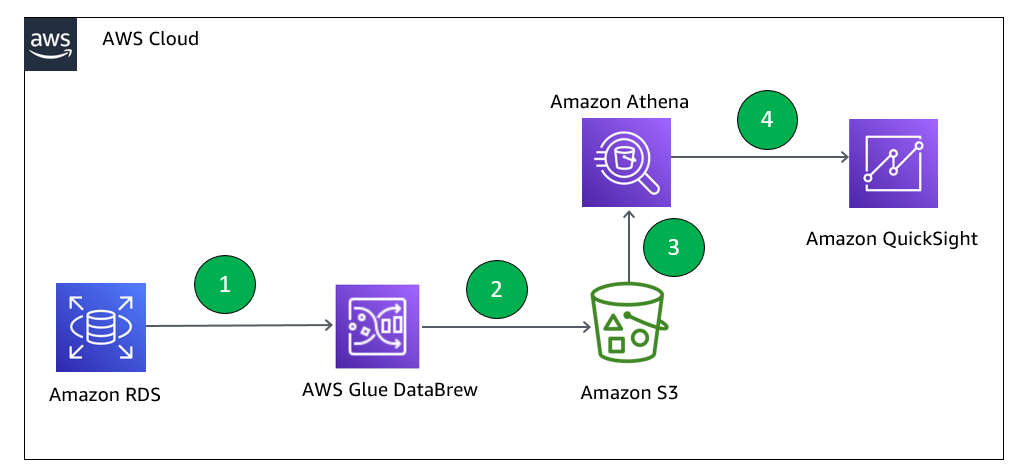
- Create a JDBC connection for RDS and a DataBrew project. DataBrew does the transformation to find the top performing students across all the schools considered for analysis.
- The DataBrew job writes the final output to our S3 output bucket.
- After the output data is written, we can create external tables on top of it with Athena create table statements and load partitions with MCSK REPAIR commands.
- Business users can use QuickSight for BI reporting, which fetches data through Athena. Data analysts can also use Athena to analyze the complete refreshed dataset.
Prerequisites
To complete this solution, you should have an AWS account.
Prelab setup
Before beginning this tutorial, make sure you have the required permissions to create the resources required as part of the solution.
For our use case, we use three mock datasets. You can download the DDL code and data files from GitHub.
- Create the RDS for MySQL instance to capture the student health data.
- Make sure you have set up the correct security group for Amazon RDS. For more information, see Setting Up a VPC to Connect to JDBC Data Stores.
- Create three tables:
student_tbl,study_details_tbl, andschool_tbl. You can use DDLsql to create the database objects. - Upload the
student.csv,study_details.csv, andschool.csvfiles in their respective tables. You can usestudent.sql,study_details.sql, andschool.sqlto insert the data in the tables.
Create an Amazon RDS connection
To create your Amazon RDS connection, complete the following steps:
- On the DataBrew console, choose Datasets.
- On the Connections tab, choose Create connection.

- For Connection name, enter a name (for example,
student_db-conn). - For Connection type, select JDBC.
- For Database type, choose MySQL.
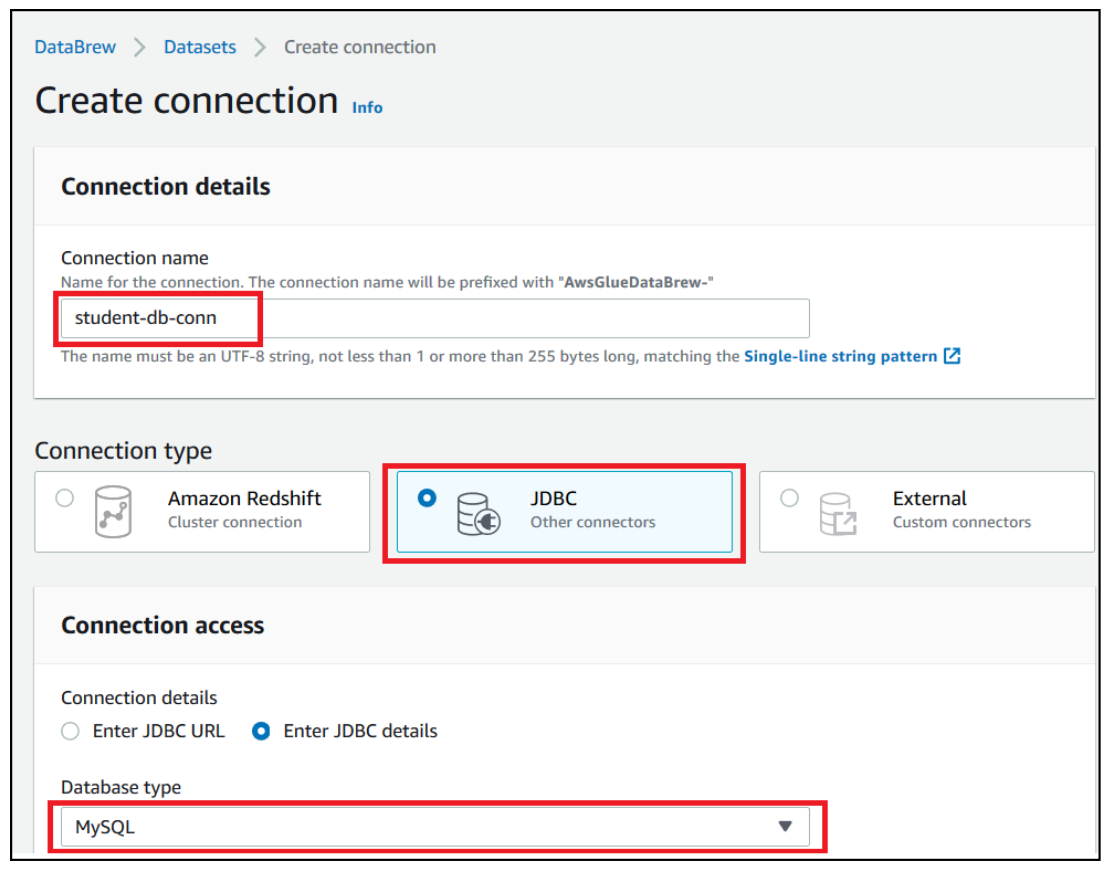
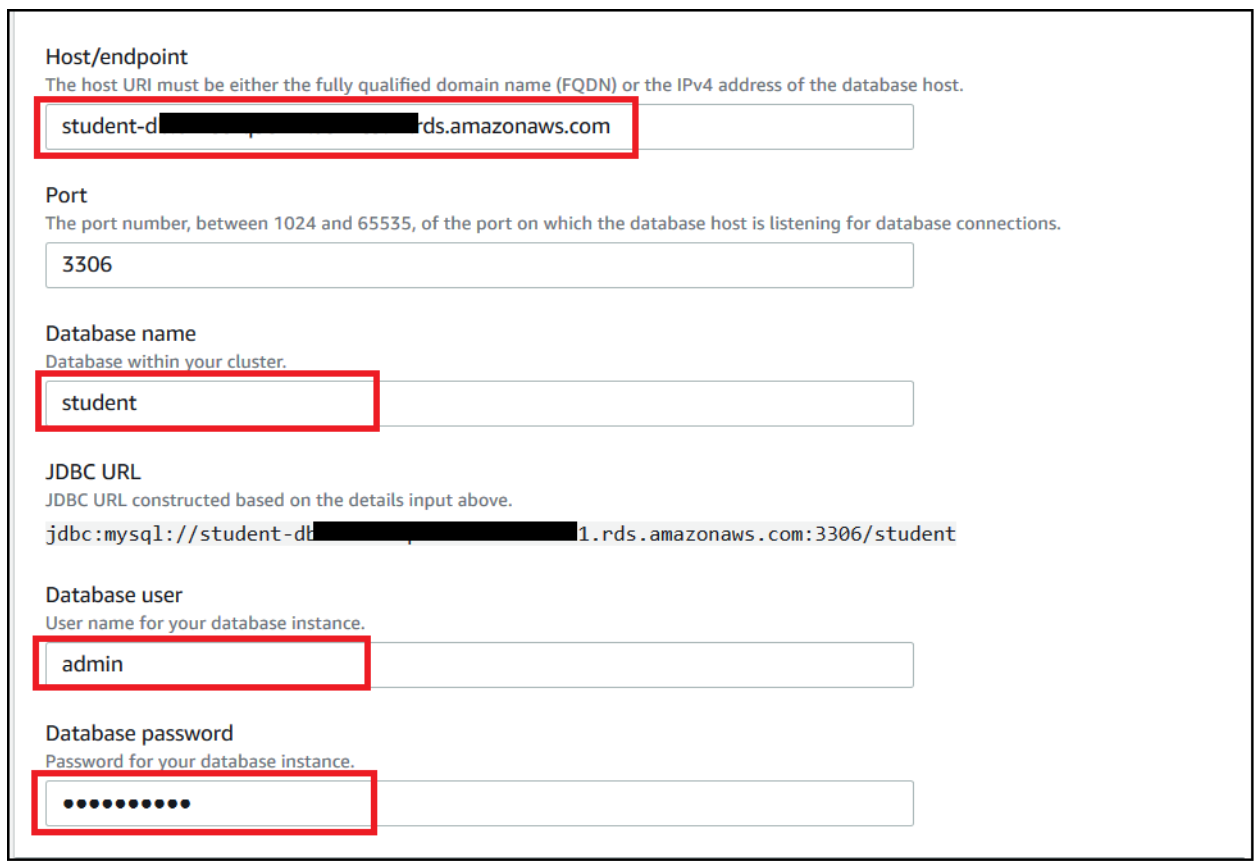
- Provide other parameters like RDS endpoint, port, database name, and database login credentials.
- In the Network options section, choose the VPC, subnet, and security group of your RDS instance.
- Choose Create connection.

Create your datasets
We have three tables in Amazon RDS: school_tbl, student_tbl, and study_details_tbl. To use these tables, we first need to create a dataset for each table.
To create the datasets, complete the following steps (we walk you through creating the school dataset):
- On the Datasets page of the DataBrew console, choose Connect new dataset.
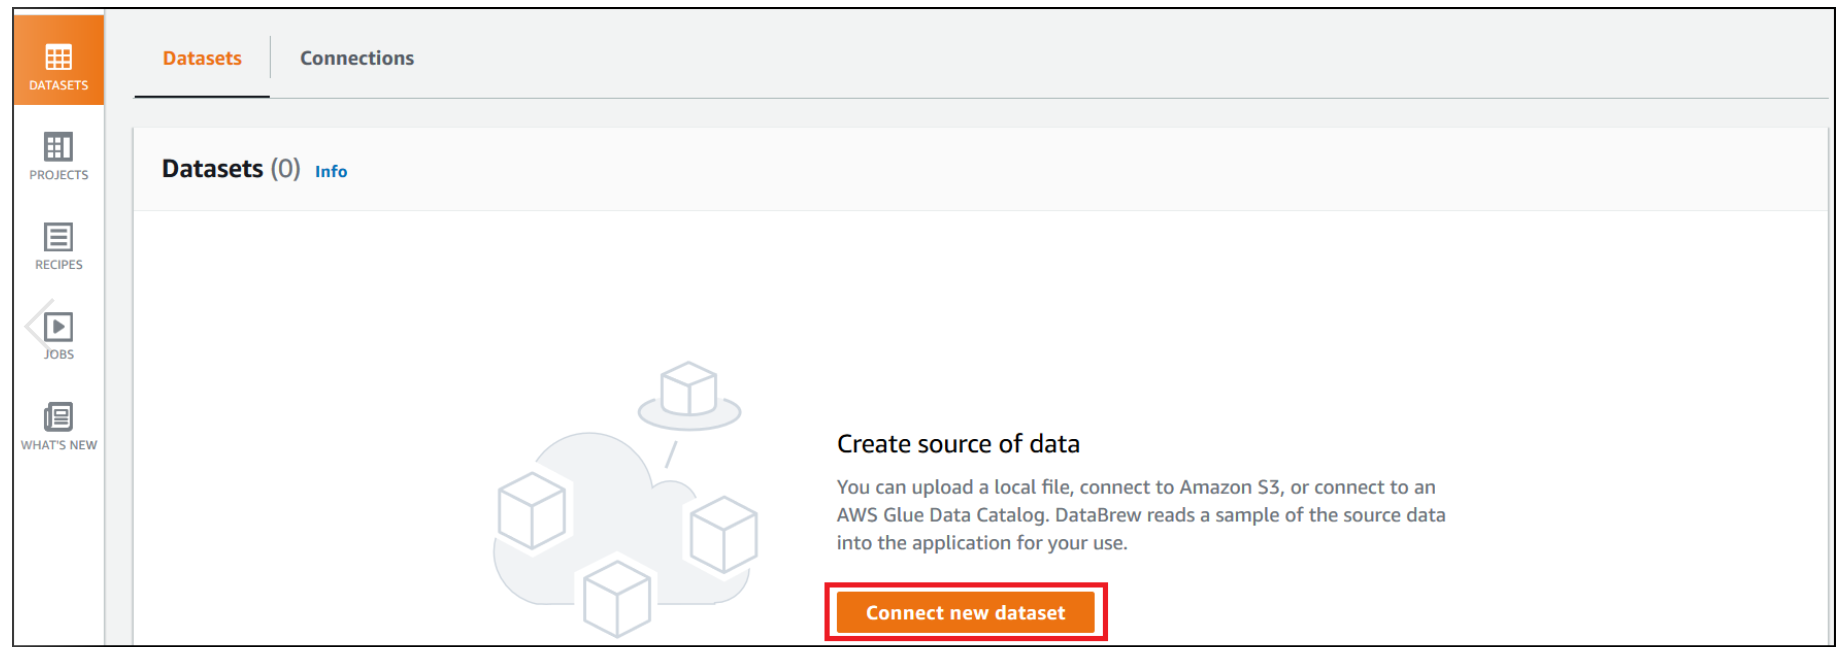
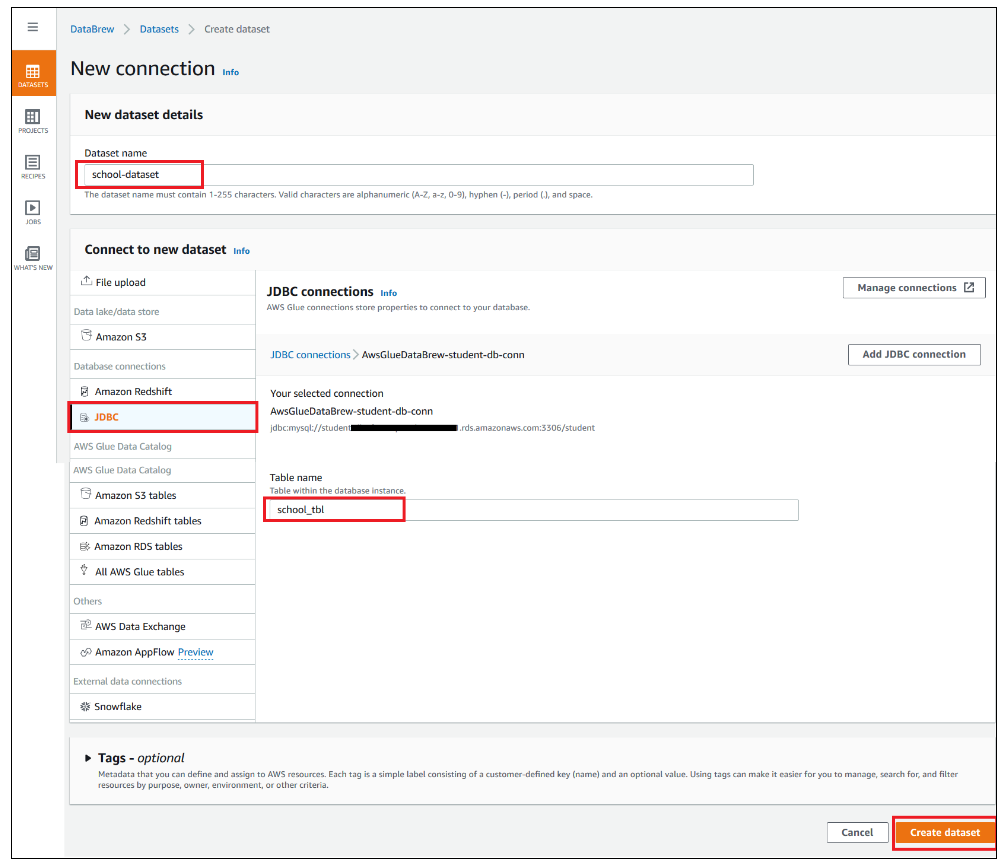
- For Dataset name, enter school-dataset.
- Choose the connection you created (
AwsGlueDatabrew-student-db-conn). - For Table name, enter
school_tbl. - Choose Create dataset.
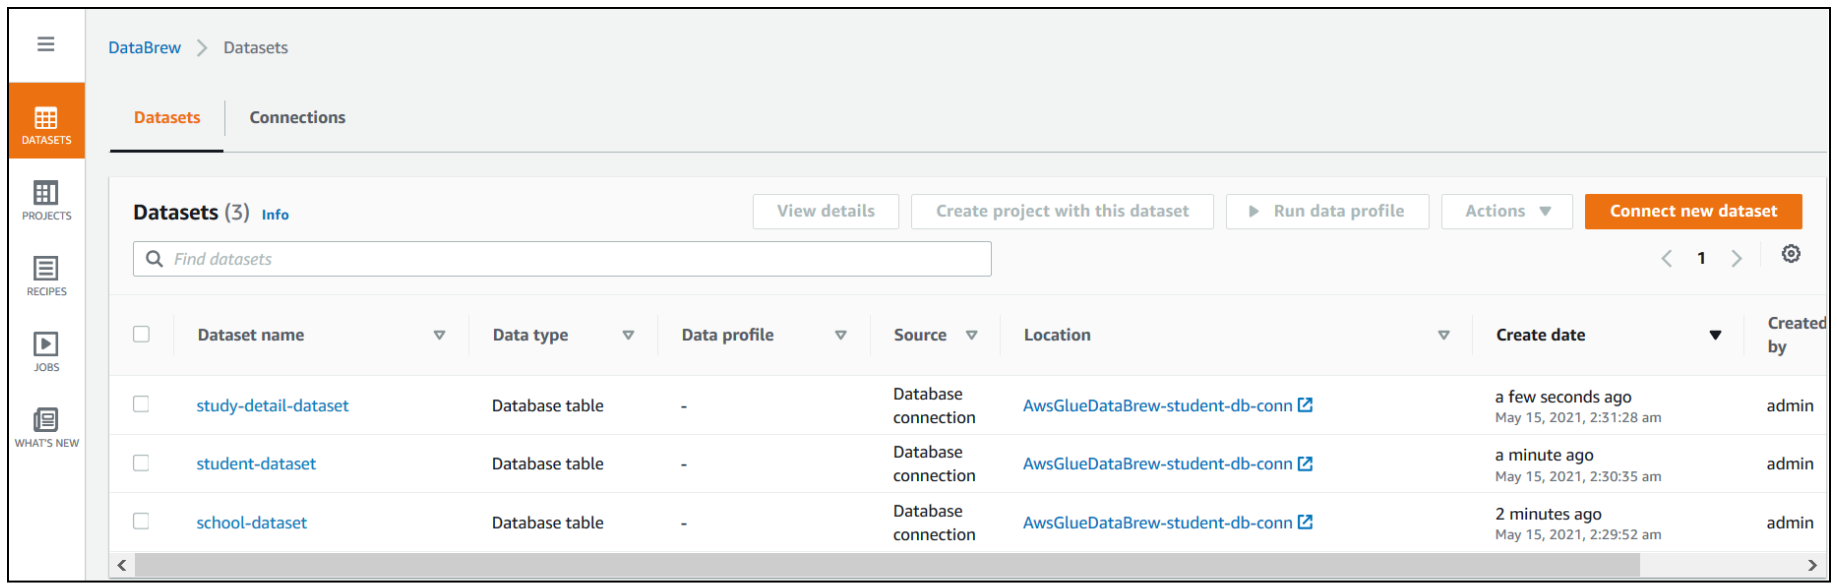
- Repeat these steps for the
student_tblandstudy_details_tbltables, and name the newdatasets student-datasetandstudy-detail-dataset, respectively.
All three datasets are available to use on the Datasets page.
Create a project using the datasets
To create your DataBrew project, complete the following steps:
- On the DataBrew console, choose Projects.
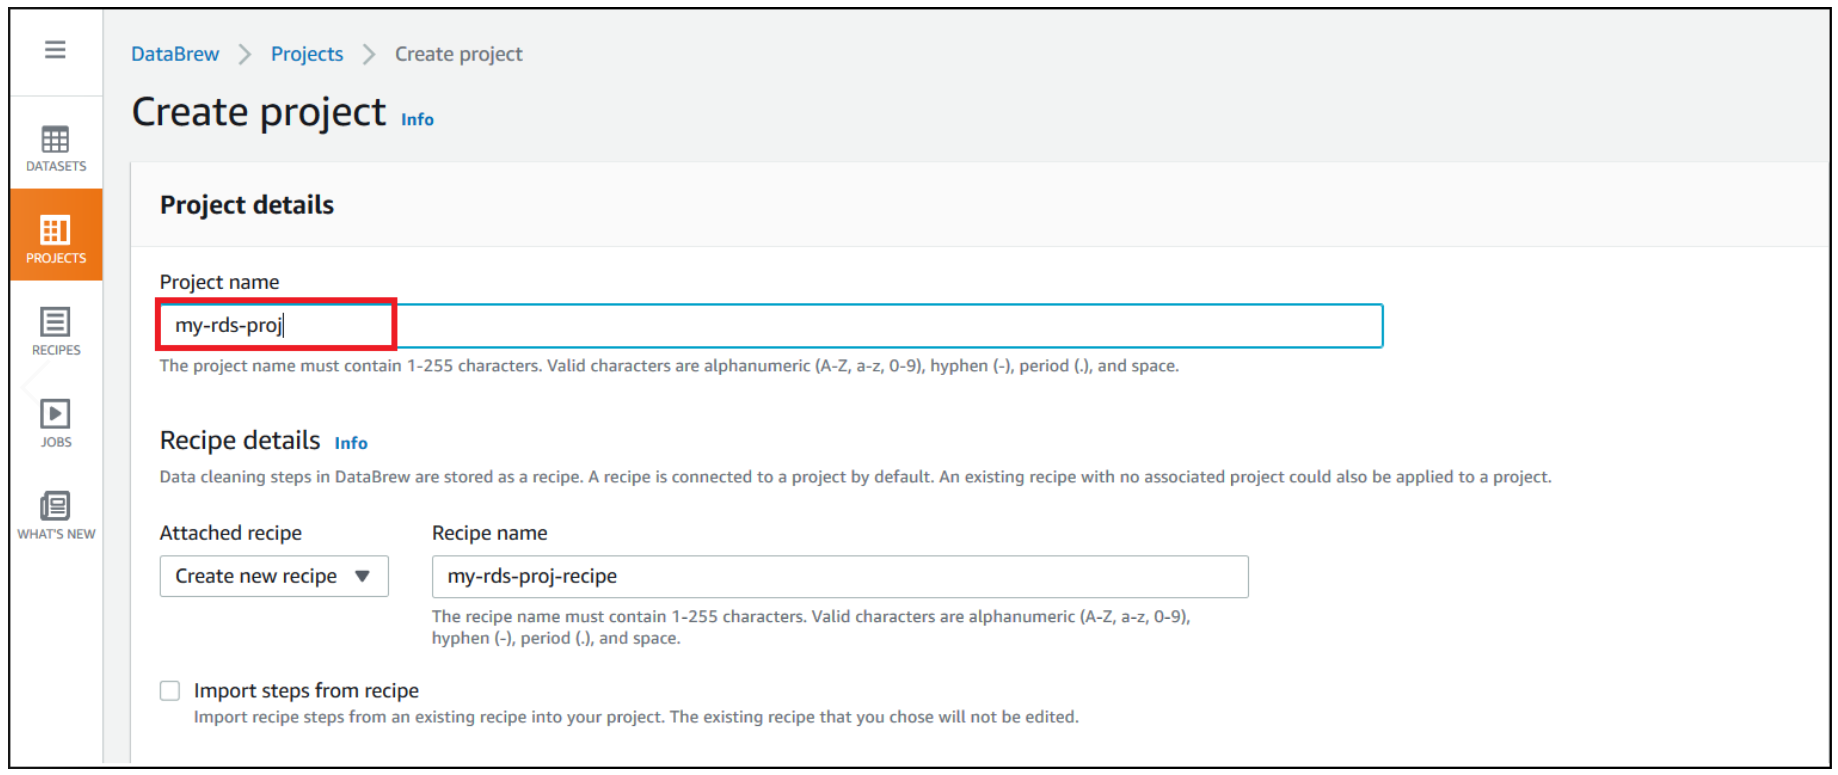
- Choose Create project.
- For Project Name, enter
my-rds-proj. - For Attached recipe, choose Create new recipe.
The recipe name is populated automatically.
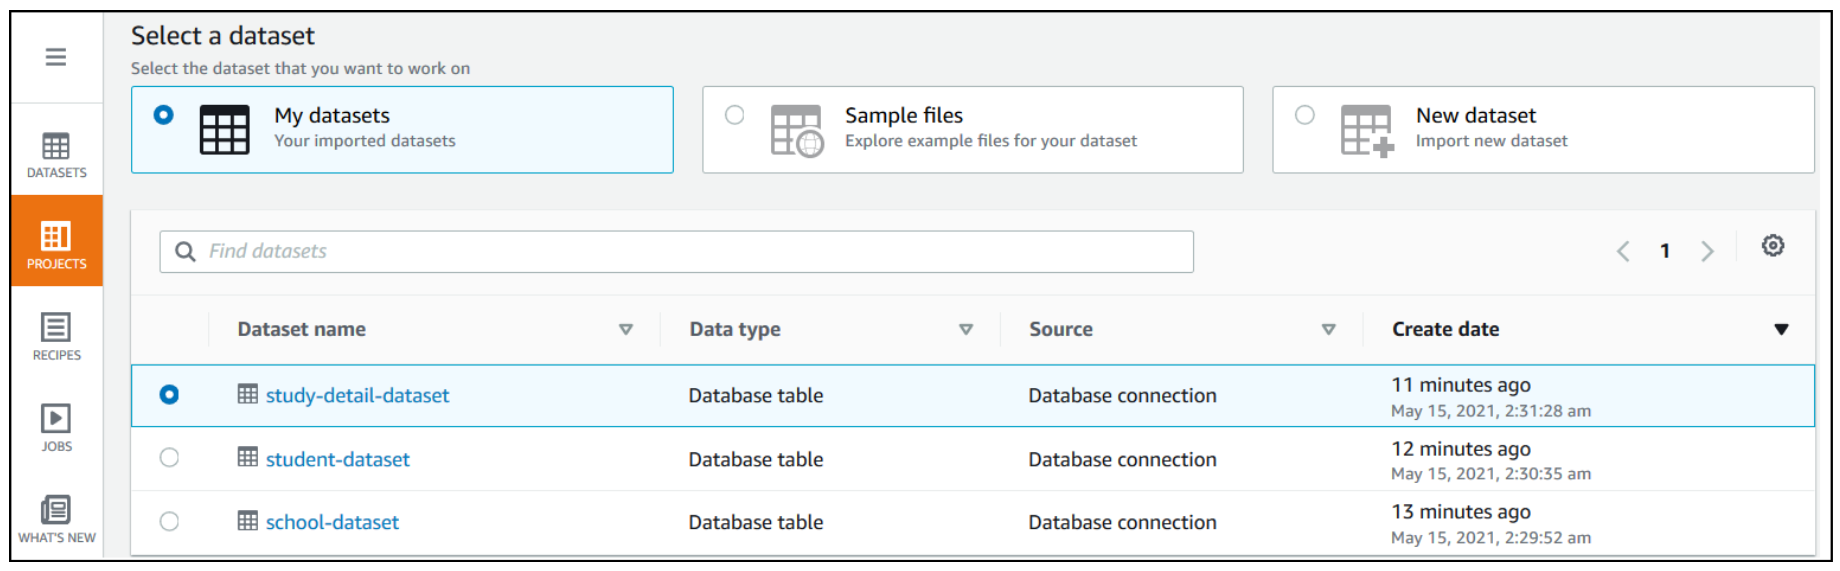
- For Select a dataset, select My datasets.
- For Dataset name, select
study-detail-dataset.
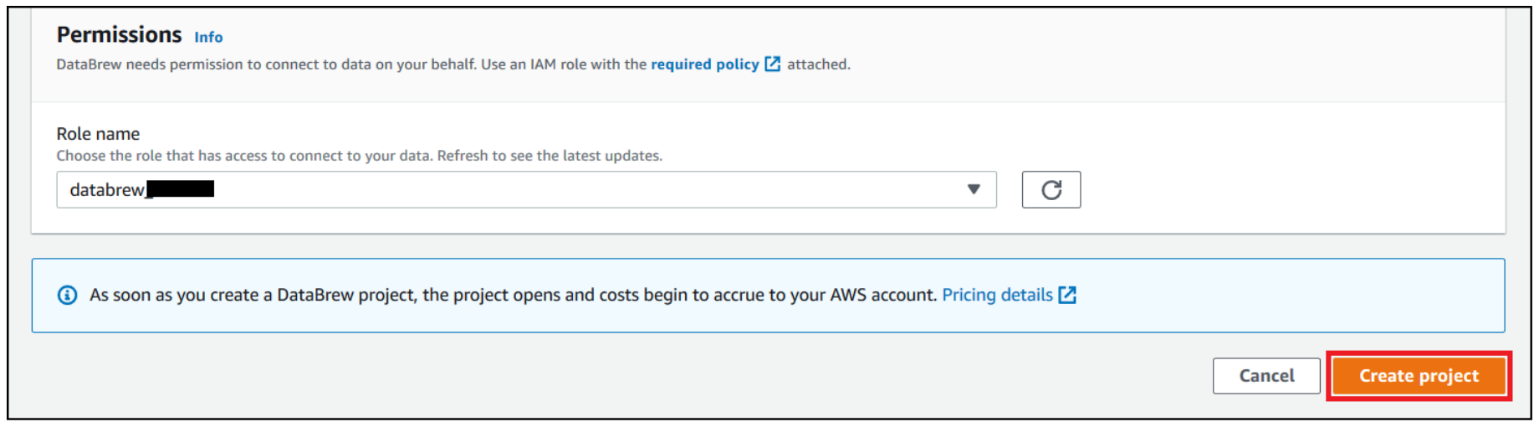
- For Role name, choose your AWS Identity and Access management (IAM) role to use with DataBrew.
- Choose Create project.
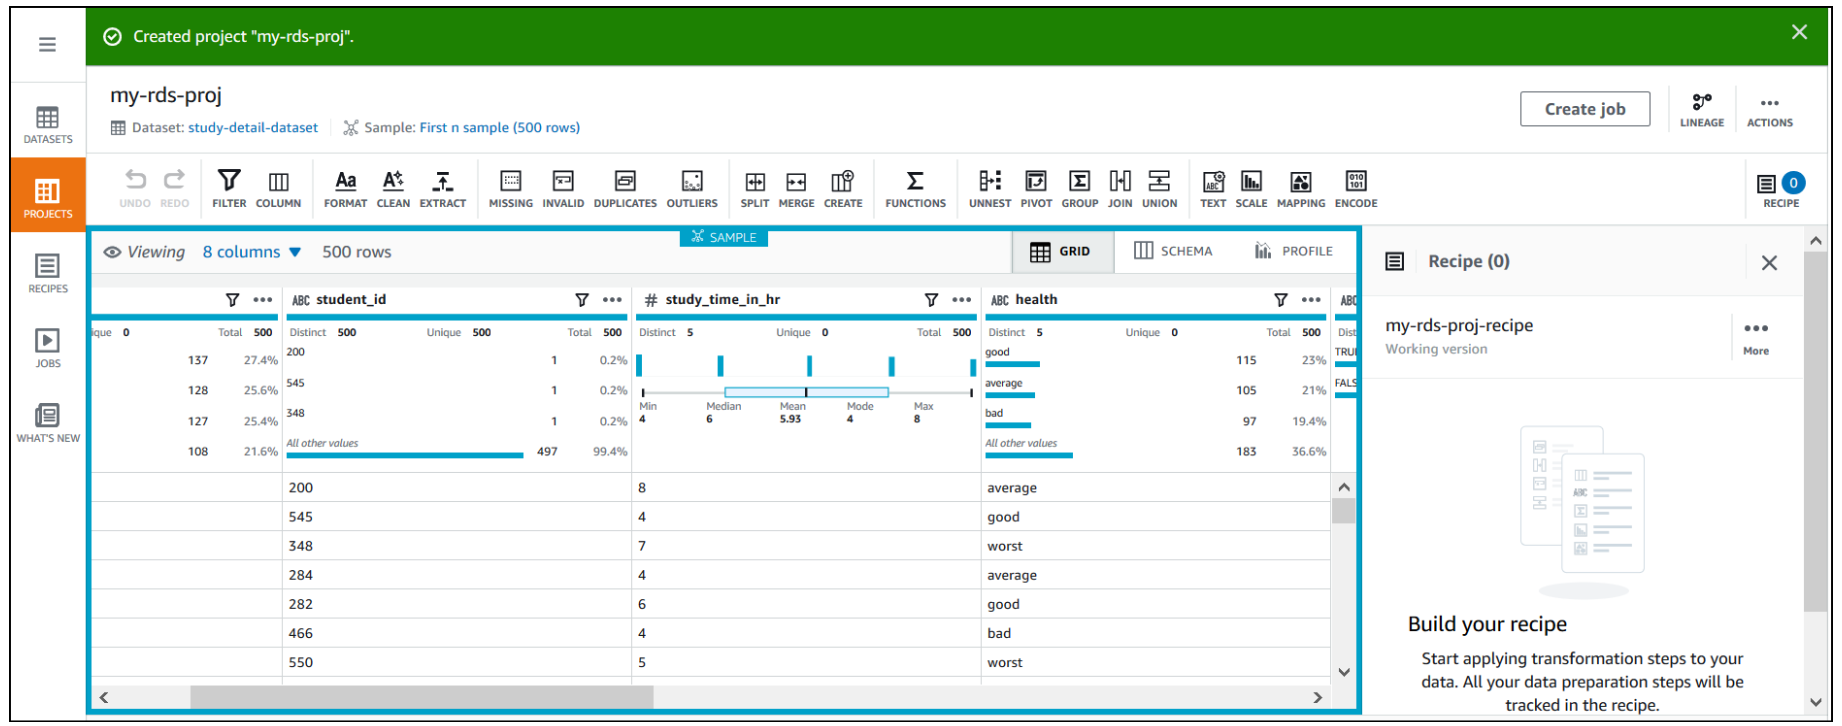
You can see a success message along with our RDS study_details_tbl table with 500 rows.
After the project is opened, a DataBrew interactive session is created. DataBrew retrieves sample data based on your sampling configuration selection.
Open an Amazon RDS project and build a transformation recipe
In a DataBrew interactive session, you can cleanse and normalize your data using over 250 built-in transforms. In this post, we use DataBrew to identify top performing students by performing a few transforms and finding students who got marks greater than or equal to 60 in the last annual exam.
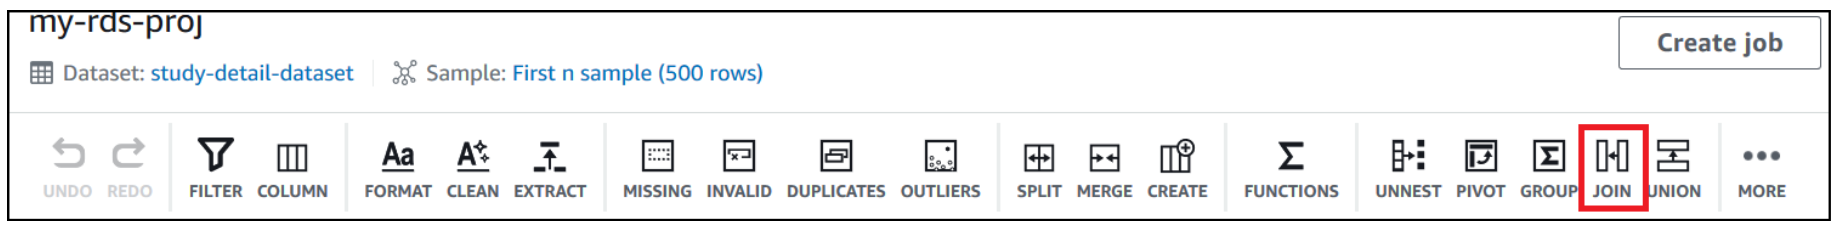
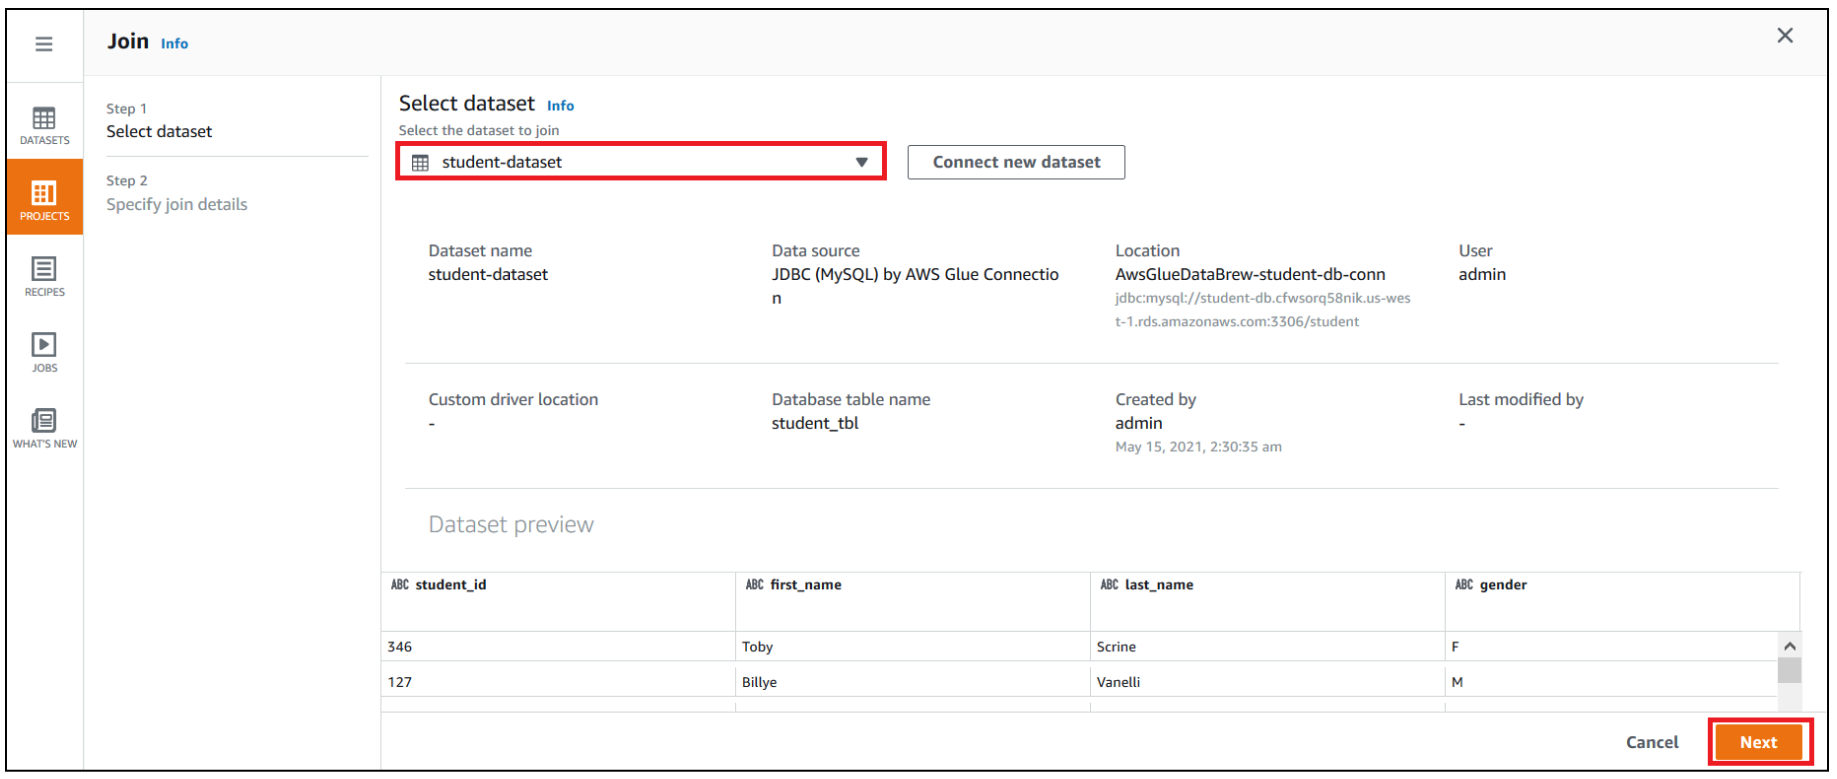
First, we use DataBrew to join all three RDS tables. To do this, we perform the following steps:
- Navigate to the project you created.
- Choose Join.
- For Select dataset, choose
student-dataset. - Choose Next.
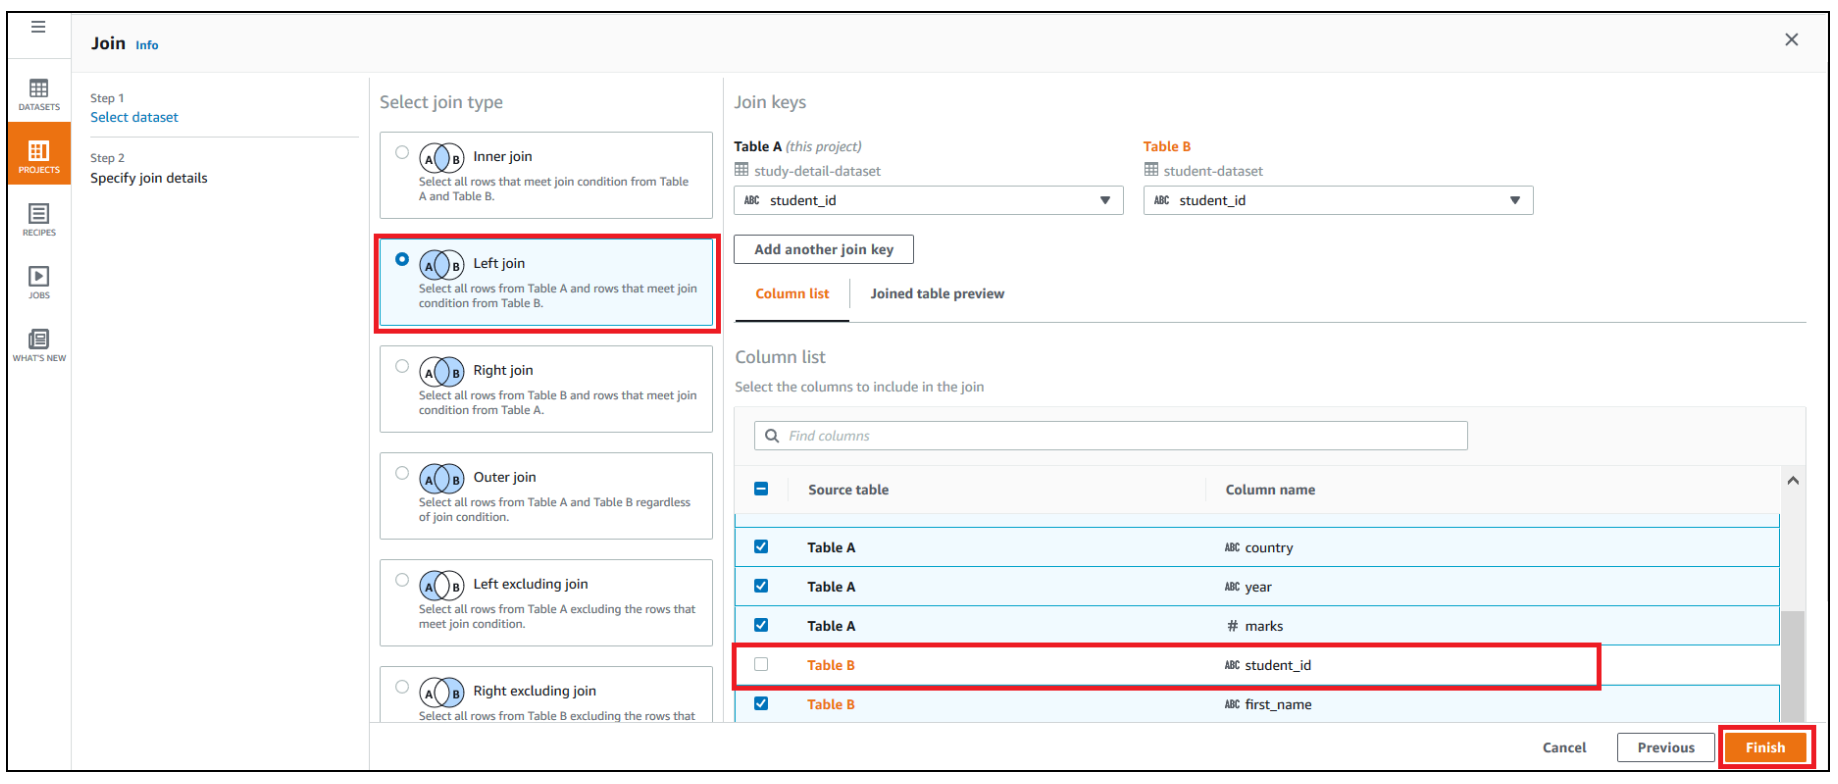
- For Select join type, select Left join.
- For Join keys, choose
student_idfor Table A and deselectstudent_idfor Table B. - Choose Finish.
Repeat the steps for school-dataset based on the school_id key.
- Choose MERGE to merge
first_nameandlast_name. - Enter a space as a separator.
- Choose Apply.

We now filter the rows based on marks value greater than or equal to 60 and add the condition as a recipe step.
- Choose FILTER.
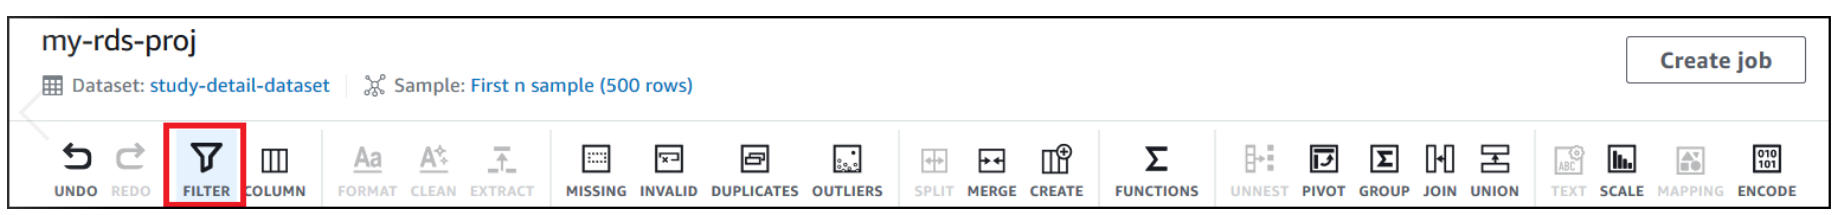
- Provide the source column and filter condition and choose Apply.
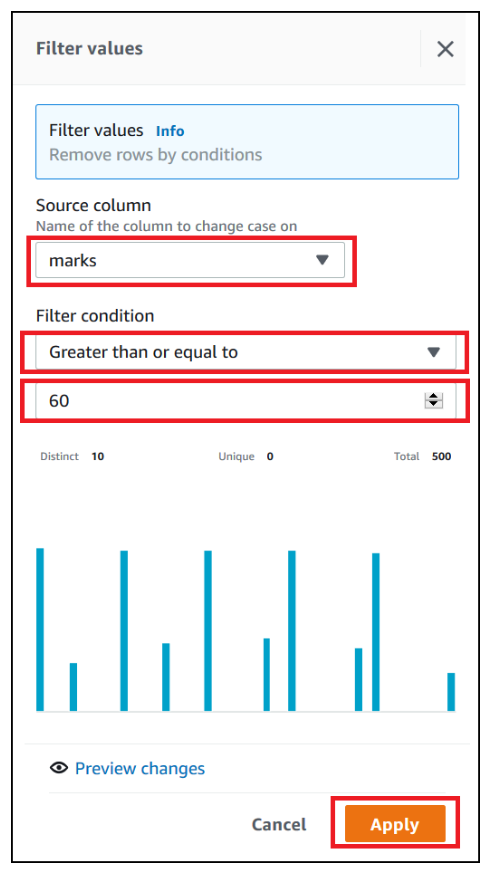
The final data shows the top performing students’ data who had marks greater than or equal to 60.
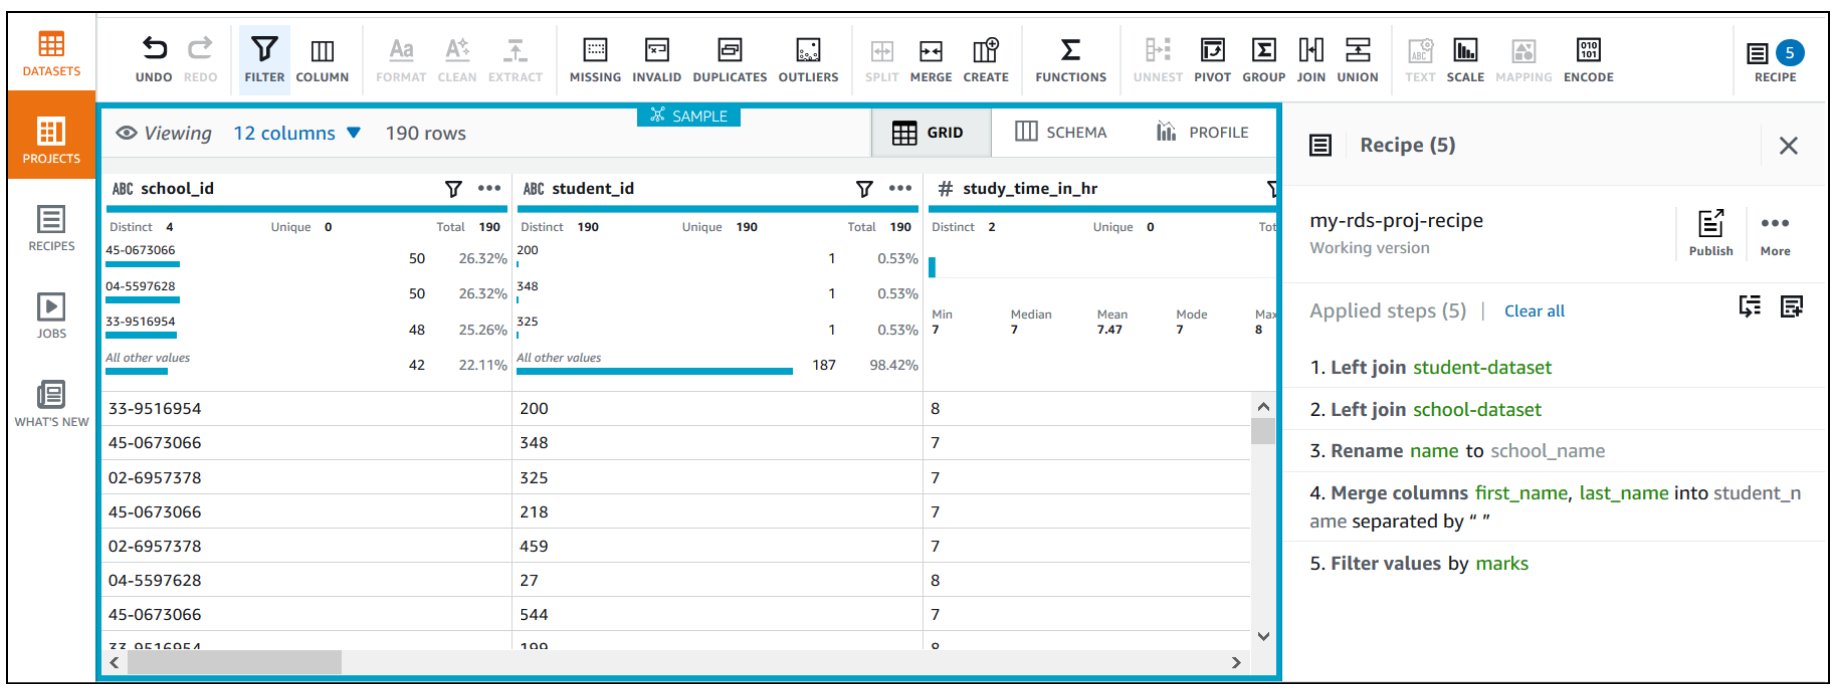
Run the DataBrew recipe job on the full data
Now that we have built the recipe, we can create and run a DataBrew recipe job.
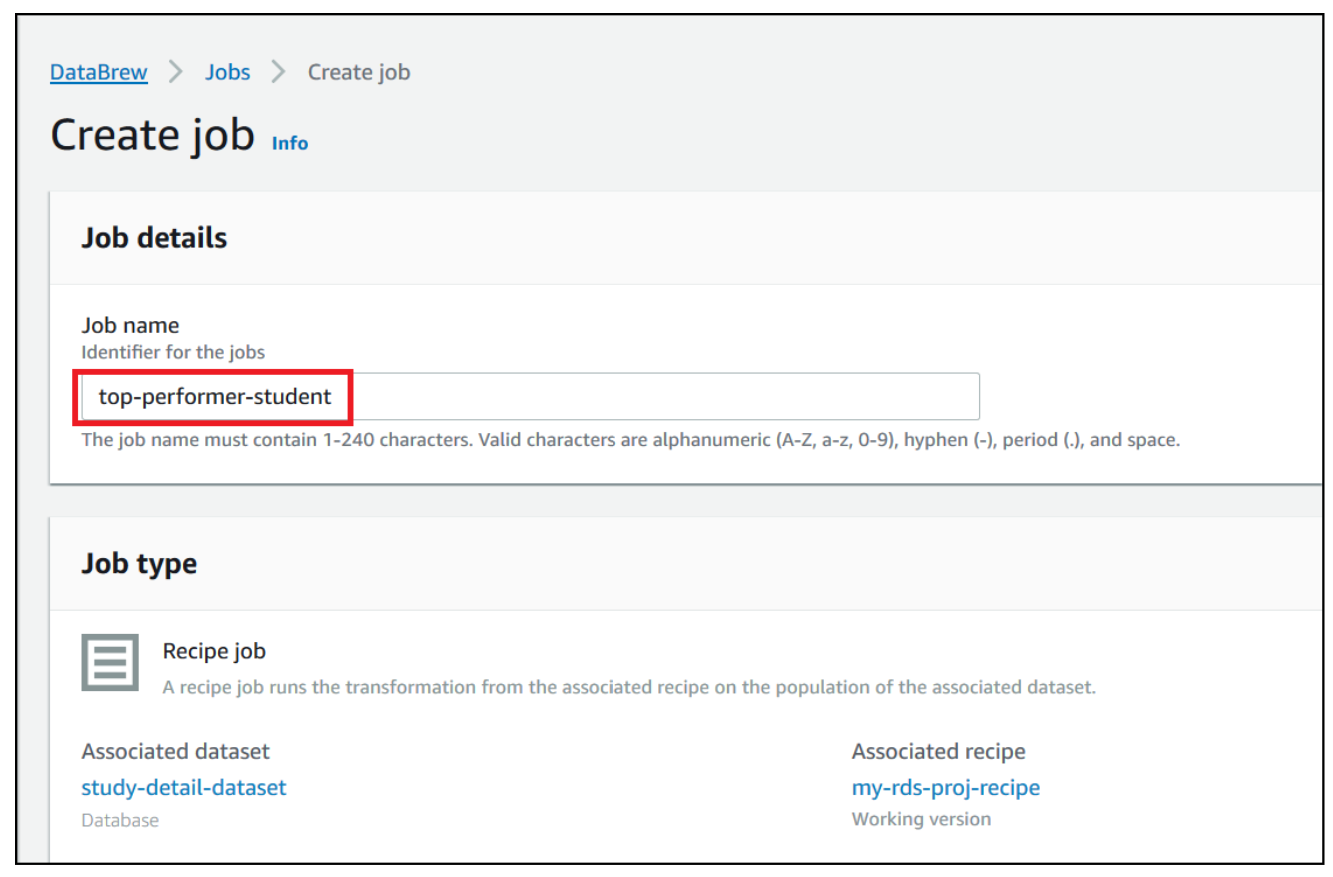
- On the project details page, choose Create job.
- For Job name¸ enter
top-performer-student.
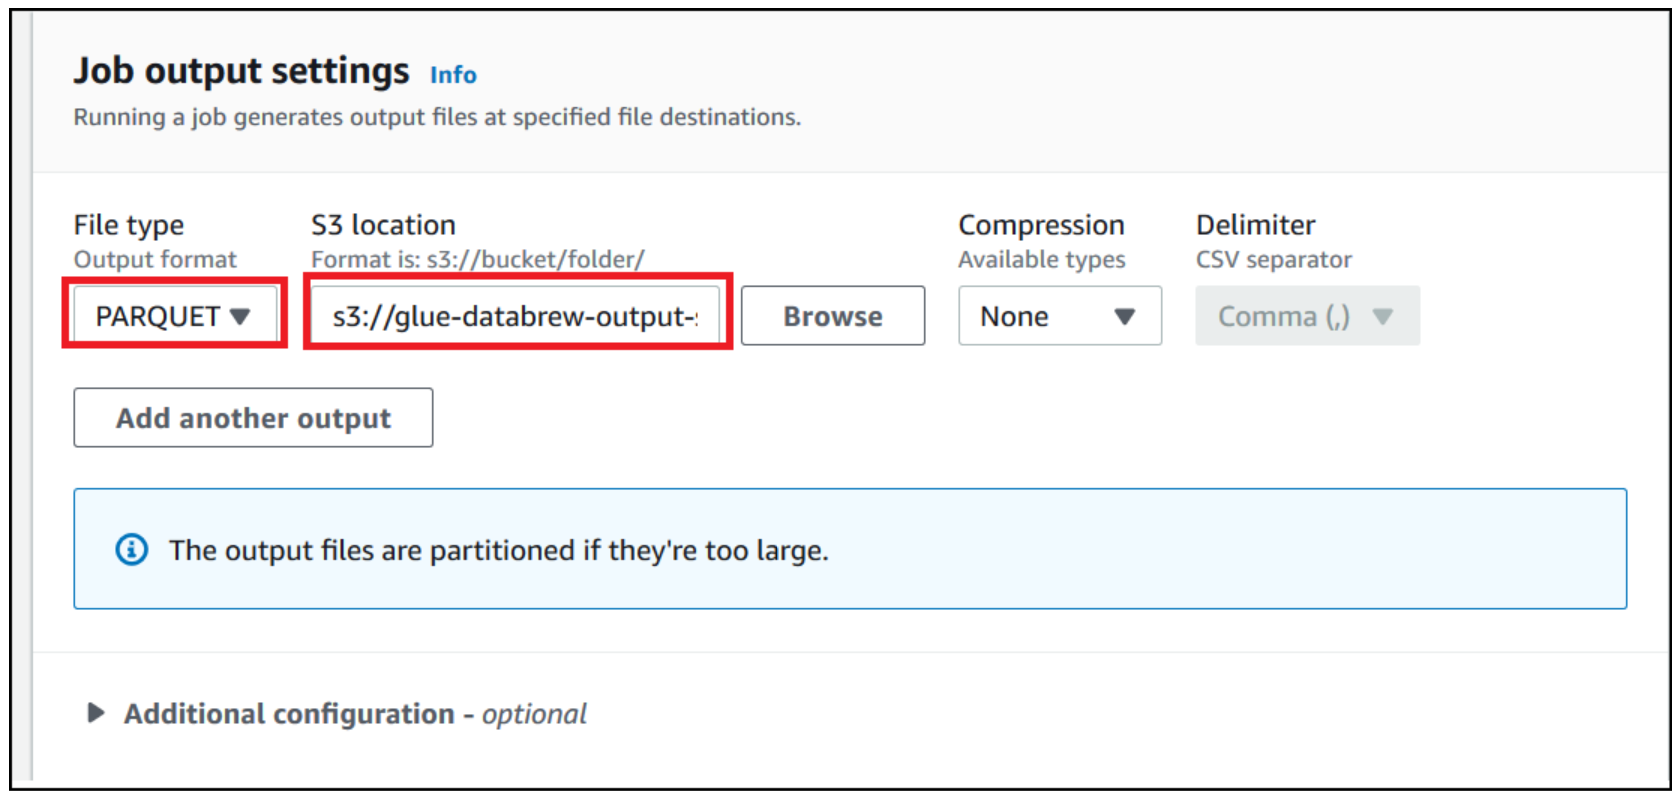
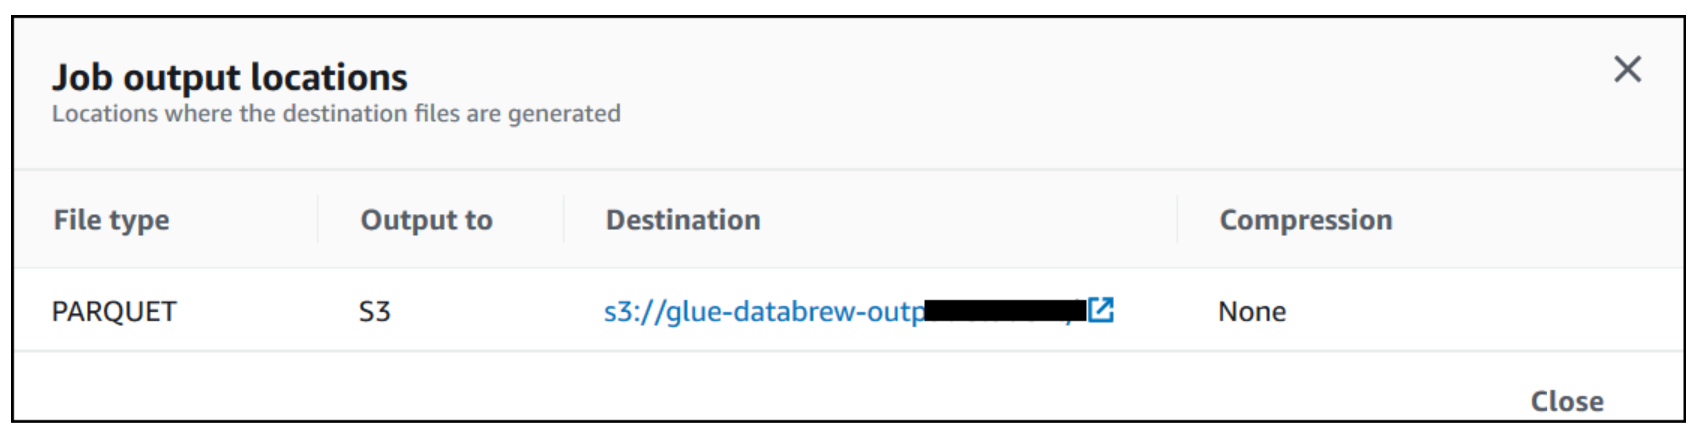
For this post, we use Parquet as the output format.
- For File type, choose PARQUET.
- For S3 location, enter the S3 path of the output folder.
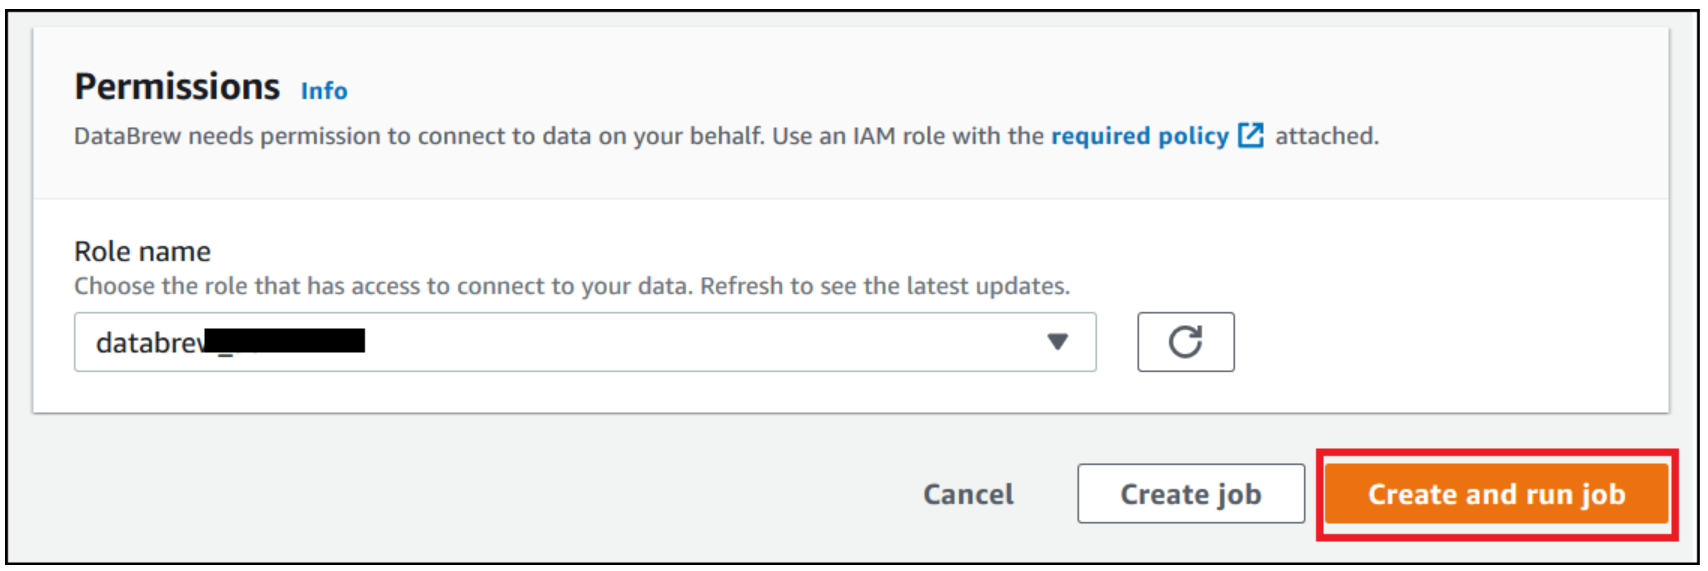
- For Role name, choose an existing role or create a new one.
- Choose Create and run job.
- Navigate to the Jobs page and wait for the
top-performer-studentjob to complete.
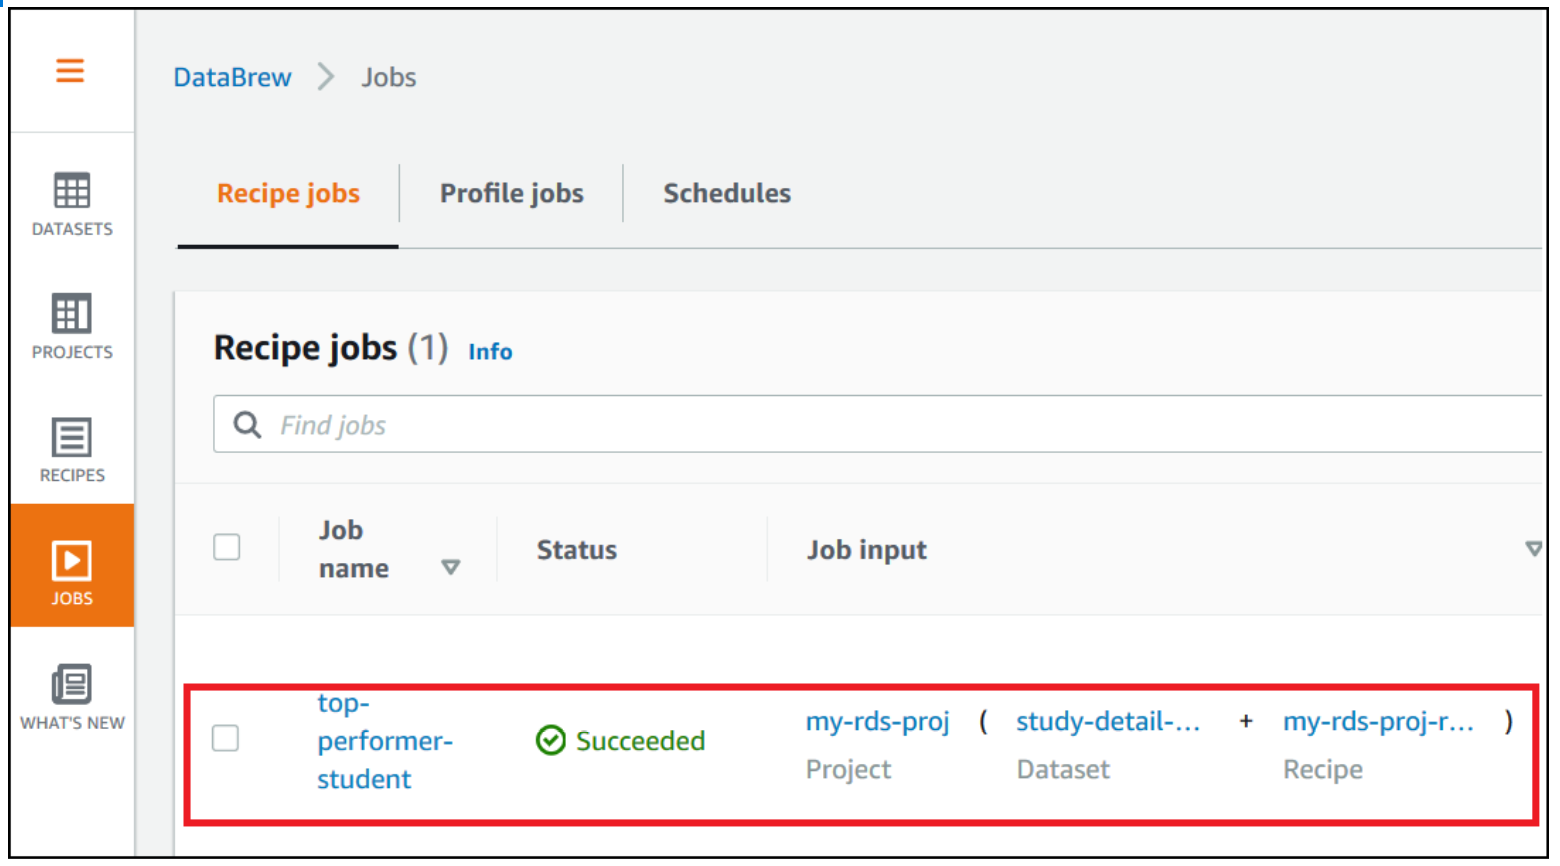
- Choose the Destination link to navigate to Amazon S3 to access the job output.
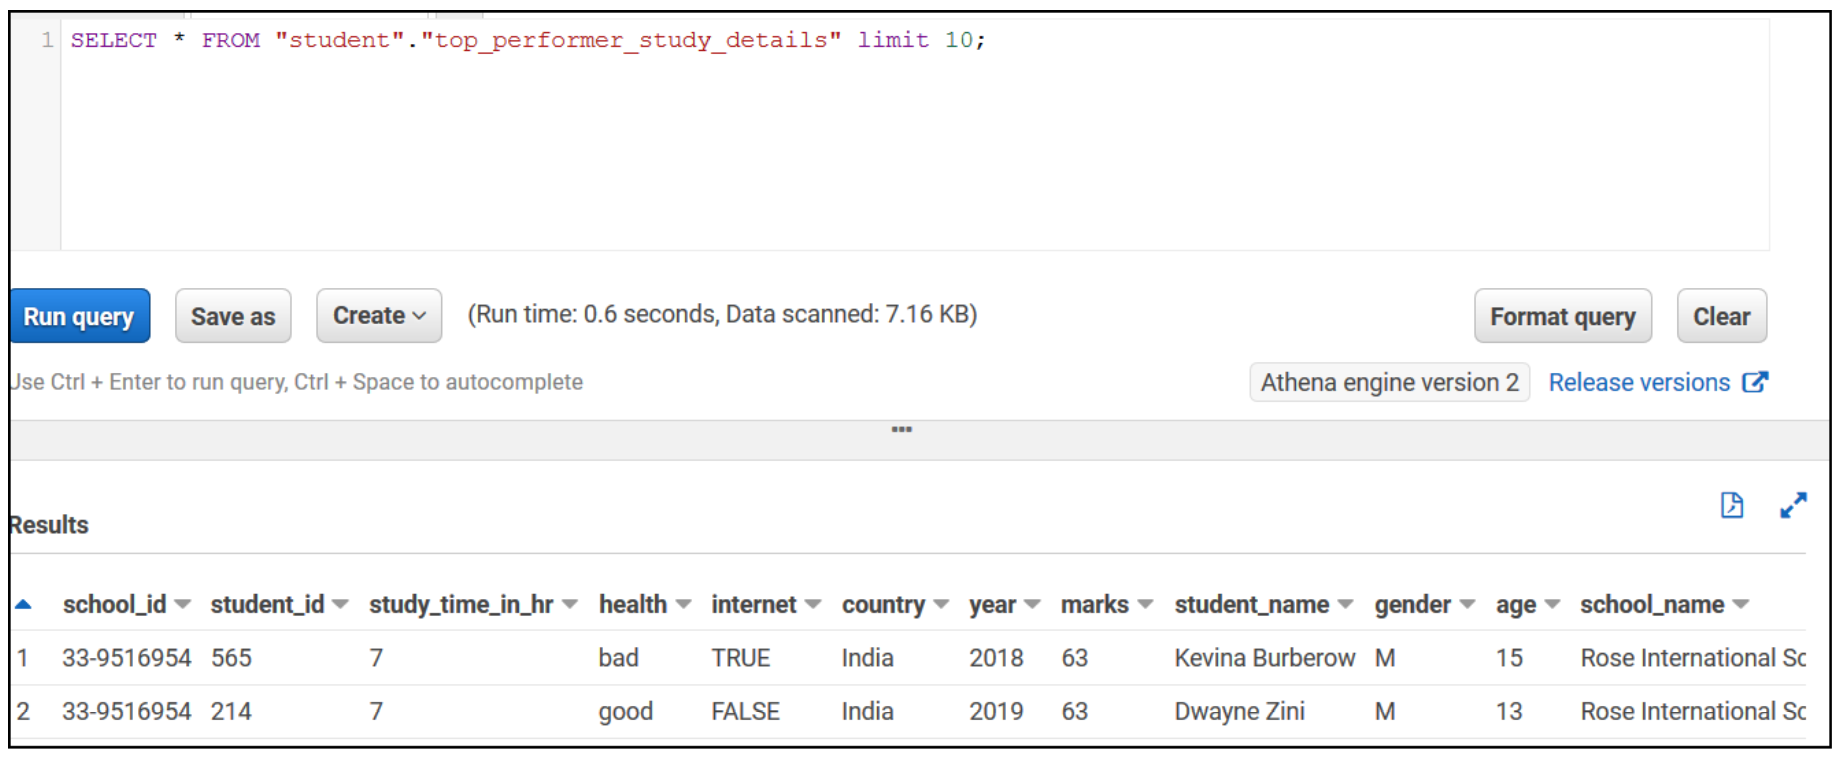
Run an Athena query
Let’s validate the aggregated table output in Athena by running a simple SELECT query. The following screenshot shows the output.
Create reports in QuickSight
Now let’s do our final step of the architecture, which is creating BI reports through QuickSight by connecting to the Athena aggregated table.
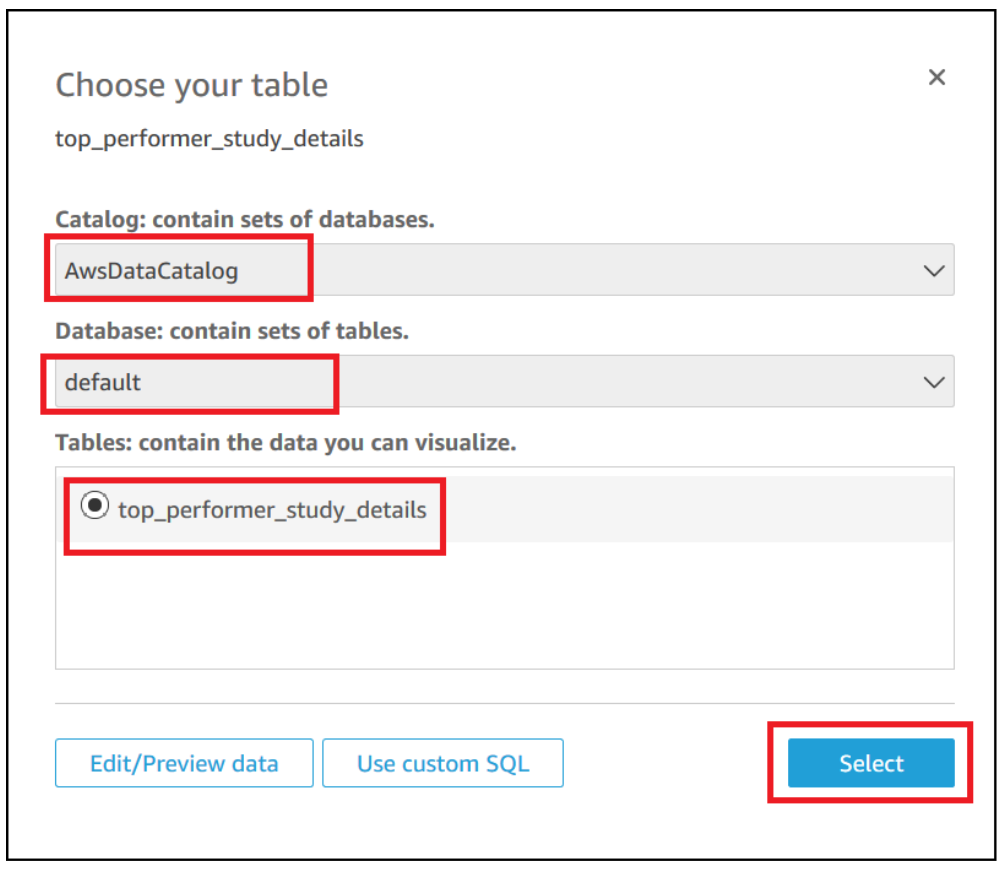
- On the QuickSight console, choose Athena as your data source.

- Choose the database and catalog you have in Athena.
- Select your table.
- Choose Select.
Now you can create a quick report to visualize your output, as shown in the following screenshot.
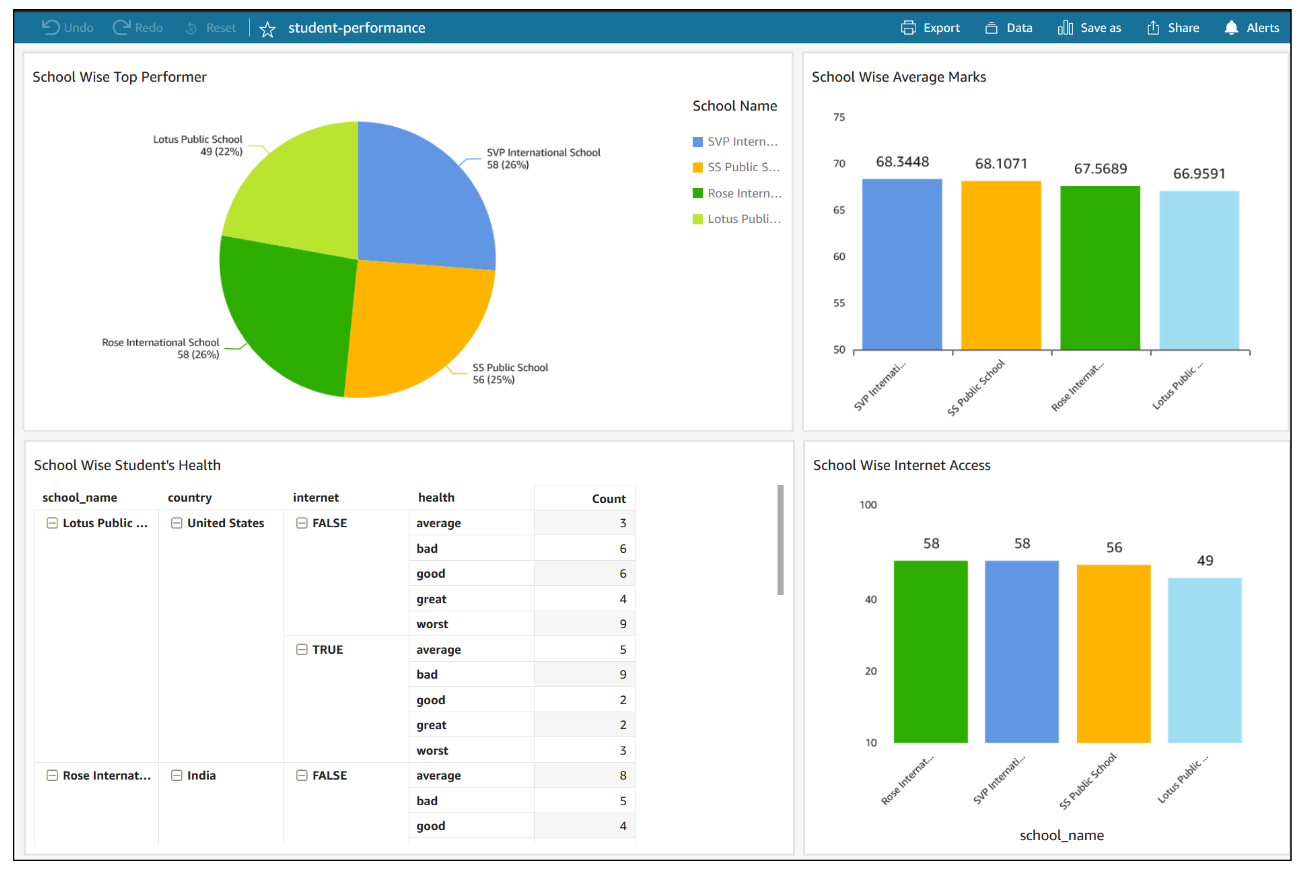
If QuickSight is using SPICE storage, you need to refresh the dataset in QuickSight after you receive notification about the completion of the data refresh. We recommend using SPICE storage to get better performance.
Clean up
Delete the following resources that might accrue cost over time:
- The RDS instance
- The recipe job top-performer-student
- The job output stored in your S3 bucket
- The IAM roles created as part of projects and jobs
- The DataBrew project
my-rds-projand its associated recipemy-rds-proj-recipe - The DataBrew datasets
Conclusion
In this post, we saw how to create a JDBC connection for an RDS database. We learned how to use this connection to create a DataBrew dataset for each table, and how to reuse this connection multiple times. We also saw how we can bring data from Amazon RDS into DataBrew and seamlessly apply transformations and run recipe jobs that refresh transformed data for BI reporting.
About the Author
 Dhiraj Thakur is a Solutions Architect with Amazon Web Services. He works with AWS customers and partners to provide guidance on enterprise cloud adoption, migration, and strategy. He is passionate about technology and enjoys building and experimenting in the analytics and AI/ML space.