AWS Contact Center
Monitor and trigger alerts using Amazon CloudWatch for Amazon Connect
In the medical field, cardiologists rely on heart monitoring devices to capture patient baselines and trends that enable them to predict and treat heart disease and defects. Similarly, in the contact center field, the ability to monitor and detect anomalies is essential in maintaining a healthy contact center environment. With Amazon Connect and Amazon CloudWatch you can monitor contact center health metrics real time and trigger alerts via Amazon Simple Notification Service (SNS) to send notifications via email, SMS, or AWS Chatbot for Slack, enabling teams to take action on anomalies detected.
Email, SMS, and Slack are common communication channels businesses use in day-to-day operations. This post includes instructions using AWS CloudFormation to build a CloudWatch dashboard, alarms, and notifications via Amazon SNS for email or SMS or an Amazon chatbot for Slack.
Overview of solution
The following architecture diagram depicts an Amazon Connect powered call center sending performance updates as metric messages to CloudWatch. CloudWatch receives these messages and is configured to display the metrics on a dashboard administrators can monitor. CloudWatch is also configured with alarms that can notify an administrator when triggered. Notifications are powered using Amazon SNS for email, SMS messages, or Amazon Chatbot for Slack.

Walkthrough
The high-level steps that we will walk through in this post are as follows:
- Optional, to include Slack as a notification channel start with;
- Create AWS Chatbot and connect to Slack
- Launch CloudFormation stack and select notification preference; email, SMS, or Slack
- Review and optionally adjust the CloudWatch dashboard
- Review and optionally adjust CloudWatch alarms
- Review alarm notifications
- Test and confirm notifications
- Optionally remove configuration by deleting the CloudFormation stack
Prerequisites
For this walkthrough, it is assumed you have the following:
- An AWS account
- An existing Amazon Connect instance
- Access to sign in as an Amazon Connect agent
- A phone number claimed in Amazon Connect to place a test call to your agent
- Privileges required to launch an AWS CloudFormation stack
- Basic understanding of Amazon Connect
- Basic understanding of Amazon CloudWatch and privileges required to create dashboards and notifications
- For Slack option, an existing Slack workspace and channel
- For SMS, follow instructions for Publishing to a mobile phone
- For email, a valid email address
Create AWS Chatbot Client and connect to Slack Workspace (For Slack option only)
To use Slack as a channel for CloudWatch alarm notifications, setup an AWS Chatbot client via the following steps:
-
- Login to the AWS Management Console and choose AWS Chatbot
- Choose Configure new client notice option to select either Chime or Slack
- Select Slack and choose Configure
- You will be asked to Sign in to your workspace, if you haven’t already

-
- Once signed in, choose allow when prompted to grant AWS Chatbot access to your Slack workspace
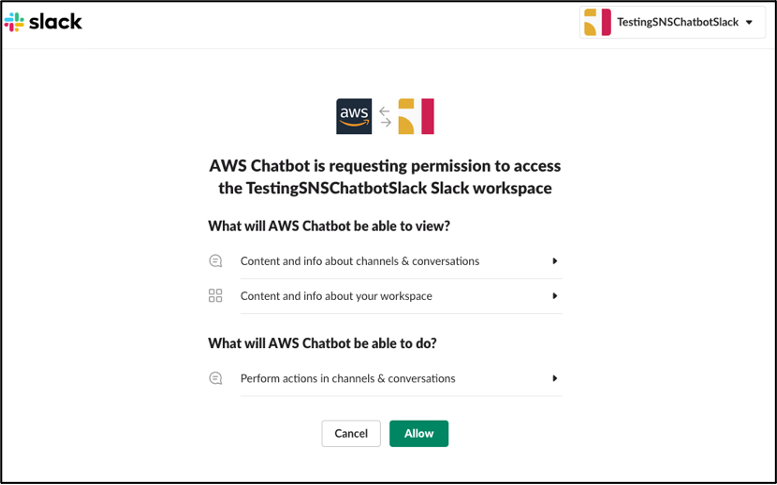
Note: the AWS CloudFormation stack will configure a slack channel for the Chatbot client
Launch AWS CloudFormation stack
This post assumes you have already deployed an Amazon Connect instance. To build and configure the other parts of the architecture, deploy using CloudFormation as described:
-
- Login to the AWS Management Console.
- Select the AWS region where you’re running your Amazon Connect instance.
- Select the following Launch Stack button to open the CloudFormation template in the AWS Management Console.

-
- In Stack Name enter a name, for example ‘AmazonConnectMetrics’.
- Enter all the values in the Parameters as follows:
-
- For DashboardName, enter a name, for example ‘AmazonConnectDashboard’.
- For ConnectInstanceId, enter the value for your Amazon Connect instance. This is found by navigating to the Amazon Connect instance alias, locating the Instance ARN and copying the value after the “/ “.

-
- Select Email or SMS for notifications in this example, we’ll use email.
- Enter a valid email address or for SMS, a phone number that has published with Amazon SNS.
- For email, note that Amazon SNS will send an initial confirmation email that must be accepted before you can receive alerts. In this example, the email address entered is directed to 1 user. Consult the Amazon SNS documentation for strategies supporting fanout or multiple user notification configurations.
- For SMS, enter phone number that has been published in SNS in the internationally recognized e164 format (+15555555555 in North America, for example)
- For Contact Flow Name, enter the exact name of the contact flow that you want to monitor for errors. This is found by navigating to the Amazon Connect console, select Contact Flows and Name column.
- For Queue, enter the exact queue name that you want to monitor for the capacity exceeded error. This is found by navigating to the Amazon Connect console, select Queues and Name column.
- Add Slack parameters (optional) and select Next.

-
- Leave the Options page unchanged and choose Next.
- Review the final page, check acknowledge that AWS CloudFormation might create IAM resources and choose Create stack

It will take a minute or two to finalize deployment. If successful, the status will change to CREATE_COMPLETE. If there are issues, double check the parameter values entered and try again.
On completion of stack creation, it will send a SNS topic subscription confirmation email to the email address you provided in the SNSEndpoint. Check your email inbox and confirm subscription so that you can receive Amazon Connect metrics alarm notification emails.
Review the dashboard and optionally adjust metrics
A new CloudWatch dashboard has been created to track all Amazon Connect metrics sent to CloudWatch
-
- Login to the AWS Management Console and search for Amazon CloudWatch
- From CloudWatch console, select Dashboards and the new dashboard named AmazonConnectDashboard

Most metrics from Amazon Connect are published to CloudWatch once every minute. By displaying these on a graph, this can help reveal overall trends and patterns. If the Amazon Connect instance being monitored is new, the metrics will be blank until calls are placed.
Configuration for the graphs has been included in the CloudFormation. However, these can be modified after deployment if desired. You can rename, edit, or delete widgets to customize your dashboard, if you prefer, see Using Amazon CloudWatch Dashboards
Make sure the statistic type makes sense for your purposes. For example, changing MissedCalls to Average won’t display how many missed calls occurred, just an average across the period and produce incorrect values in the graph.
Note the ToInstancePacketLossRate reports a value every 10 seconds between 0.0 and 1.0. Therefore, make sure you’re using correct units when looking for packet loss values (0.05 equals 5%). Even though it reports every 10 seconds, Amazon Connect still reports every minute so make sure to set the period to 60 seconds to see data.
All metric definitions can be found here CloudWatch Metrics for Your Amazon Connect Instance
Understanding alarms
Remain in the CloudWatch console and navigate to the configured alarms.
- On the left panel within the CloudWatch service, choose Alarms.
- Notice the new alarms named something similar to AmazonConnectMetrics-<AlarmName>.
Note, because it wasn’t defined in the CloudFormation Template, alarm names will be automatically named and include the CloudFormation resource type as part of the name.
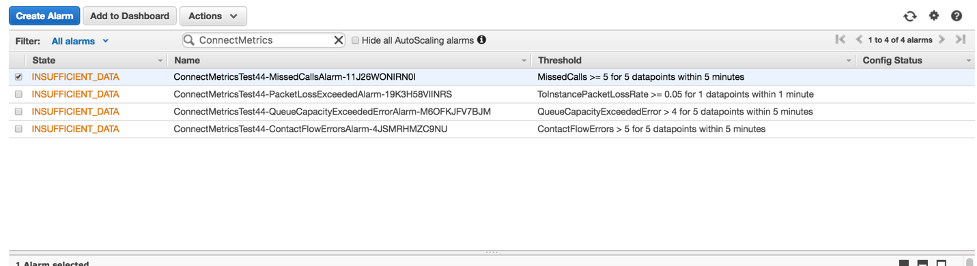
The state of these alarms is likely Insufficient data, this is normal. CloudWatch classifies new alarms with this status until sufficient data is received.
Review alarm configuration
To review the configuration of an alarm:
-
- Select the alarm with MissedCallsAlarm for part of its name
- Select Actions and then Edit
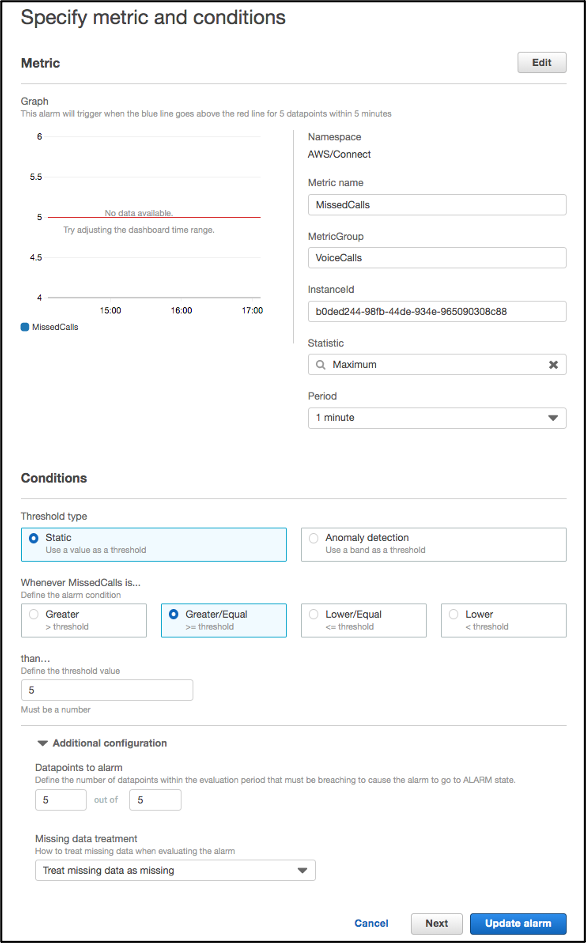
Notice the alarm is set to trigger whenever MissedCalls is greater or equal to 5 out of 5 datapoints. A datapoint is the time configured within the Period value. In this example, since a period is configured for 60 seconds, 5 periods equal 5 minutes. Therefore, the alarm is configured to trigger if there are 5 or more missed calls every minute within a span of 5 minutes. For more information on how to define these values properly, consult the CloudWatch reference for M and N configuration.
CloudWatch metrics can use dimensions as part of their schema. Amazon Connect metrics dimensions are listed in the Amazon Connect CloudWatch Metrics Dimensions section of the documentation. When creating alarms and dashboards, it is vital to include the proper dimension framework else data will not be shown.
Understanding alarm notifications
When the thresholds of an alarm are exceeded, it will change it to an ALARM state and remain this way until the values return to normal for one period.
CloudWatch alarms should be configured with a notification. In this example, an email, SMS, or Slack message will be sent to an individual when alarmed. The details of this message can be found within the Amazon SNS Service.

-
- Login to the AWS Management Console and search for Amazon SNS Service
- Choose Topics, notice a new topic named CustServIvrAlarmTopic. Every time an alarm is triggered, this topic will publish a notification to its subscribers.
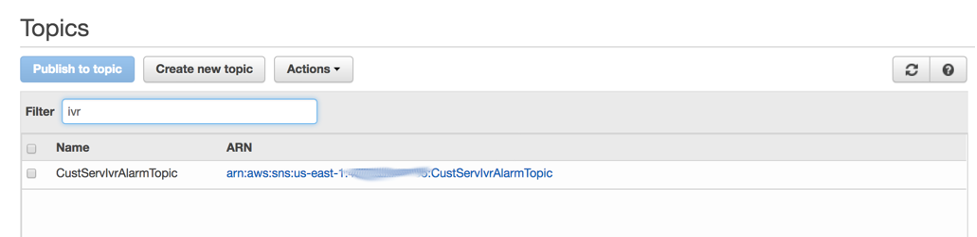
- Choose Subscriptions. Notice the email or SMS email indicated. Also notice the subscription ARN is tied to this number. When topics publish notifications, their Endpoint (the phone number or email addresses) will receive a message.
Note, If electing email for a topic endpoint, you must wait for a confirmation message and follow the instruction in that message before receiving alerts from Amazon SNS.

Test and confirm notifications
Now that you have reviewed your CloudWatch dashboard and alerts, let’s test your notifications. In this test, you will generate a missed call alarm by placing a call to your Amazon Connect instance and letting the call ring through to an available agent, putting the agent into a missed call state. The missed calls alarm will activate and you will receive alarm notifications via both email and slack.
Note, you will need access to sign in as an agent in your Amazon Connect instance. You will also need a phone number claimed and configured to route to your agent in Amazon Connect.
-
- Login to the AWS Management Console and search for Amazon Connect.
- Select your Amazon Connect instance URL and login as a user with agent access. Or, if you are setup for Single Sign On (SSO) with Amazon Connectsign in via your normal SSO portal process.
- From the agents Contact Control Panel, change your status to Available

-
- Now, from another phone, place a call to a number you have claimed in your Amazon Connect console that is configured to route to your agent. You will see and hear the call coming through.
- Do not accept or reject the call, let it ring through until you see missed call status as shown in the following image

- Check your Email and Slack, you will see Missed Call Alarms messages as show in the following examples:
-
- Email from AWS Notifications stating ‘NewConnectMissedCall-Alarm’ threshold crossed

-
- Slack from AWS for CloudWatch Alarm, NewConnectMissedCall Alarm

-
Cleaning up
Note, the Amazon Connect metrics included in this solution are sent automatically to CloudWatch for free. However, if preferred, you can delete the CloudFormation stack to remove the configuration from this post.
- Login to the AWS Management Console and choose CloudFormation
- Select the AmazonConnectMetrics stack and choose Delete
- Note, the deletion may take a few minute to complete
Conclusion
This example of building an Amazon Connect dashboard and alarming with CloudWatch is important to consider for production environments. By using Amazon Connect with CloudWatch metrics, it is easy to create dashboards to monitor the activity across singular or multiple Amazon Connect instances. With Amazon SNS or AWS Chatbot with Slack, you can create a notification strategy to respond to alarms that are created with Cloudwatch. Lastly, the entire architecture can be deployed with a single click by leveraging CloudFormation templates. With this visibility and awareness, a system administrator is well equipped to be proactive and ensure a healthy Amazon Connect environment in a production setting.