Containers
Athenahealth QMaaS: Optimizing throughput and costs with Amazon ECS & EC2 Spot
Karthik Kalkur, Senior Architect, Athenahealth, Jayaprakash Alawala, Specialist Solution Architect (Containers), AWS, and Sridhar Bharadwaj, Sr EC2 Spot Specialist, AWS
This guest blog post is contributed by Karthik Kalkur, a Senior Architect at athenahealth, in partnership with AWS Specialist Solution Architect for Containers, Jayaprakash Alawala, and AWS Sr. EC2 Spot Specialist, Sridhar Bharadwaj.
Athenahealth is a leading provider of network-enabled software and services for medical groups and health systems nationwide. Its electronic health records, revenue cycle management, and patient engagement tools allow anytime, anywhere access, driving better financial outcomes for its customers and enabling its provider customers to deliver better quality care.
Karthik walks us through the journey his team undertook while adopting Amazon Elastic Container Service (Amazon ECS) and Amazon EC2 Spot to optimize the AWS costs of using Amazon DynamoDB, Amazon Kinesis, and AWS Lambda, for their QMaaS (Quality Management as a Service) application. Their system helps track quality of care scores for medical practices followed by doctors when they interact with patients. The QMaaS system scores hundreds of millions of quality events each month, with peaks of nearly 6 billion events, as required for clinician effectiveness measurement and federal reimbursement programs.
In this blog post, we will explain the original QMaaS architecture, which was developed for speed and leveraged AWS Lambda for serverless computing. QMaaS was incurring an average monthly compute (including Lambda & EC2) spend of close to $170,000 per month since launch in 2019, with a peak monthly spend of $440,000. We will go on to show how the QMaaS team realized that selectively deploying only one of the key Lambda functions (out of several in use) into containers orchestrated by Amazon ECS (with capacity providers) on EC2 Spot Instances resulted in an improved throughput with a highly scalable and cost-optimized data pipeline for processing millions of quality events each day. The optimizations made by the QMaaS team in their SEDA (Staged Event-Driven Architecture) based data pipeline resulted in a cost reduction of 73% per month and an overall saving of $1.3M per year.
Overview of solution
As a part of Clinical Quality management, we analyze our client’s clinical data based on methodologies prescribed by US government quality programs, which is intended to measure effectiveness of care and performances of health care providers. There are federal authorities such as CMS (Centers for Medicare & Medicaid Services) and NCQA (National Committee for Quality Assurance), who publish the these methodologies, also known as quality measure specifications. For each provider, we calculate a number of performance metrics based on the data they input into our system.
QMaaS has a data pipeline in AWS, which takes millions of patient records as inputs and calculates performance metrics for more than a hundred thousand providers (doctors) daily. The whole engine was built and optimized for high throughput and speed, using Amazon managed services such as AWS Lambda, Amazon S3, and DynamoDB. It leverages a Staged Event-Driven Architecture (SEDA) and uses AWS event notification capabilities of S3 and DynamoDB extensively as a backbone to invoke the processing logic components wrapped in AWS Lambda functions. The architecture has to handle real-time as well as batch event processing, but in a cost-aware and efficient manner.
Original Solution Architecture for QMaaS Based on only AWS Lambda:
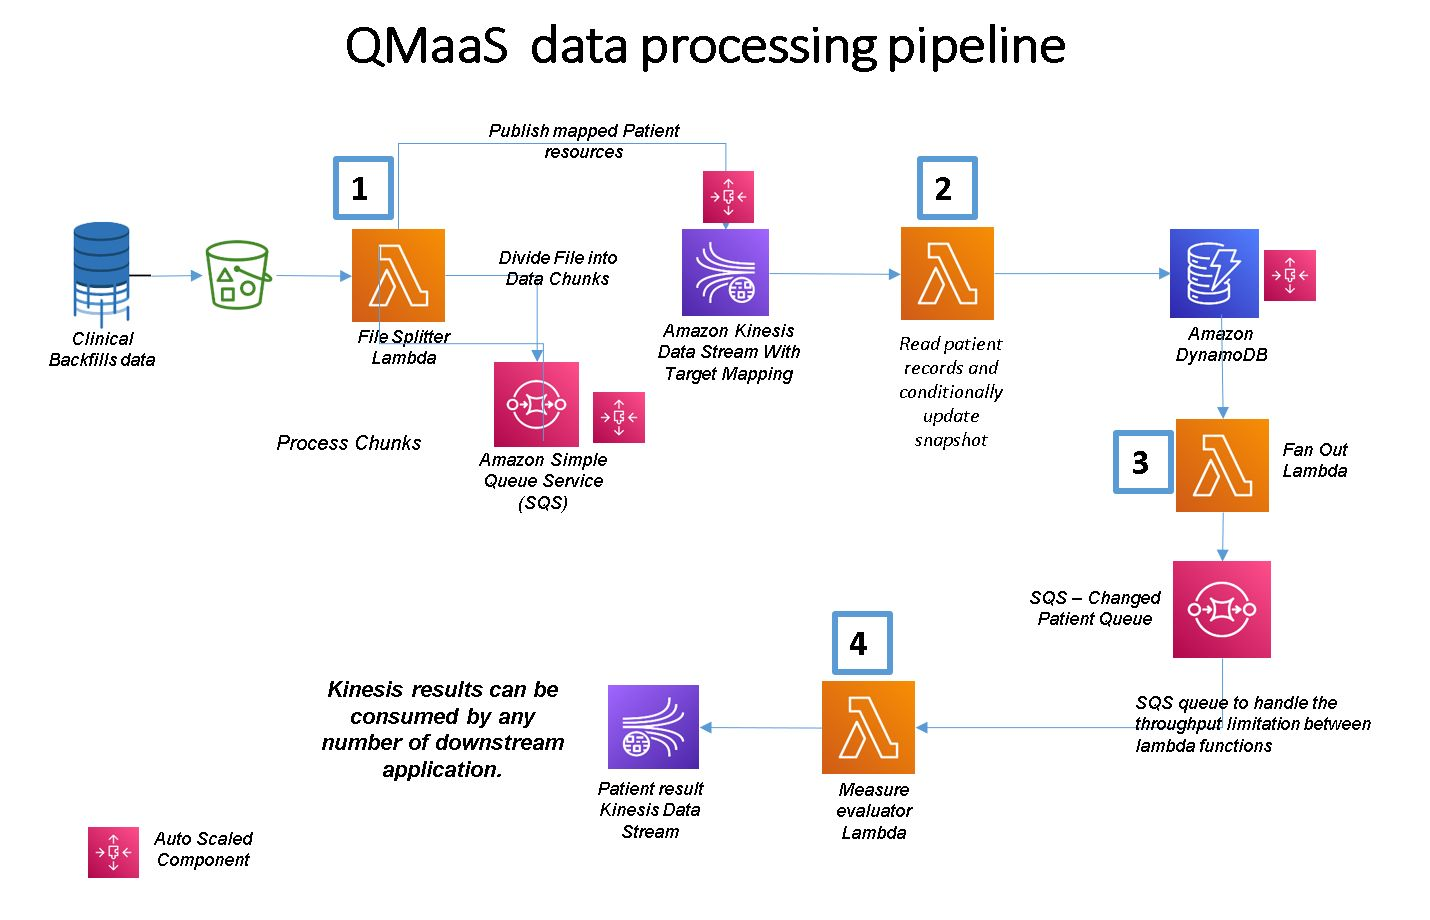
The data pipeline processes patient records delivered in the form of millions of files written into an S3 bucket from our upstream systems. Each file can contain thousands of lines of records, each line corresponding to a single patient. There are four stages of processing in the data pipeline implemented as AWS Lambda functions:
- The first Lambda function is invoked using the S3 notifications feature when each file is written into an S3 bucket. The Lambda function splits the file contents, processes them, and puts each patient record into an Amazon Kinesis data stream.
- The second Lambda reads each patient record from Kinesis and pushes it into a patient repository based in DynamoDB.
- The third Lambda function, triggered once the patient record is written into the DynamoDB data store, invokes a component, which puts the patient ID from the record stored in DynamoDB into an SQS Queue.
- The fourth AWS Lambda function, which we call the Performance Metric Lambda function, acts as a listener to the SQS queue and invokes a component, which has the business logic to use the patient ID in SQS and add a patient record in DynamoDB. This component also calculates multiple performance metrics for each patient and publishes these metrics (called measures) into a Kinesis data stream.
- The measure results available in Kinesis Data Streams can be copied to a data lake or any other data repository to support dashboards or analytical use cases.
Some of the salient features of the QMaaS architecture are:
- The processing at different stages of the data pipeline in QMaaS happens through a set of core components (implementing the business logic), which are invoked by AWS Lambda functions. These Lambda functions are separated from the components and used only for scaling infrastructure services as needed.
- Different components are stitched in the pipeline using events triggered by various underlying AWS infrastructure services such as S3, DynamoDB, Kinesis Data Streams, and Lambda functions, which can scale up and down based on the incoming load of patient records to be processed.
- SQS queues and Kinesis Data Streams are used as temporary message stores (stages in a SEDA) between any two components. An SQS queue will act as a buffer storage for the events if any component has a throughput issue and cannot cope with the incoming events created by the previous component.
This makes the pipeline highly elastic and scalable and can manage 10 times the normal load without any performance degradation. The pipeline processes 50 million patient records in one run and calculates 30 million measures within five hours. The pipeline can easily scale up to take input up to 500 million patient records and calculates all of 300 million metrics within 24 hours.
The above architecture was able to meet all the nonfunctional requirements such as horizontal scale and throughput but was incurring huge costs of an average of $170,000 per month. Various Amazon managed services involved in the pipeline supported Auto Scaling but added to the cost linearly and significantly when there was an increase in the incoming data. After we optimized the Auto Scaling parameters for DynamoDB and Kinesis, we found that the fourth (Performance Metric) Lambda was costing us 90 percent of the total Lambda cost and contributing to 40 percent of the AWS bill. This compelled us to do a deeper analysis of the costs of the Lambda and relook at the architecture of the data pipeline without changing business logic.
Why Did We Redeploy Performance Metric Calculation from Lambda to Containers?
Lambda’s cost structure is directly linked to the number of invocations and the duration of each invocation. Our monthly cost analysis revealed that beyond a certain usage threshold, Lambda was becoming more expensive than the cost of running the same code component in a Docker container deployed in EC2 instances, whose cost structure is based on an hourly usage, irrespective of the number of invocations of the components deployed inside it. For example, Performance Metrics Lambda function was getting invoked six billion times in a month, costing us around $58,000 per month on average.
By replacing just this single Lambda function (while retaining others) with a Docker container task, we were able to bring down the cost of compute to $16,000 per month. While we decided to redeploy the business logic from AWS Lambda to Docker containers to reduce costs, we were also able to maintain scalability and throughput. The following sections talk about our transition of the performance measure functions from AWS Lambda to Docker containers, resulting in a hybrid serverless and containers architecture.
New Solution Architecture for QMaaS Based on Amazon ECS:
We had the following goals to accomplish when we re-architected this solution.
- Optimize throughput and scalability of the record processing pipeline by rightsizing the EC2 instances and containers deployed in it in order to meet scenarios of real-time and batch processing workloads.
- Optimize for cost, interruptions, and availability while using Spot Instances.
- Complete processing of all messages under the existing SLA of 24 hours.

We used the following components for managing the underlying compute infrastructure for running the containers in the Amazon ECS cluster.
- EC2 Auto Scaling group with on-demand instances for base compute capacity. This base on-demand capacity is five percent of the overall capacity and is necessary to ensure that there is a minimal capacity always available to process messages, even if there is no Spot capacity available at all.
- EC2 Auto Scaling group with Spot Instances for scaling the workloads. The scaling policy attempts to meet 95 percent of the desired capacity using Spot Instances.
- SQS depth metric used for scaling the ECS service or application.
- Amazon ECS capacity providers for automatic scaling of the capacity (that is, EC2 instances) in the ECS cluster. Amazon ECS capacity provides abstract compute capacity to run containers which can be EC2 Auto Scaling groups or AWS Fargate, and provide better control and flexibility of the task placement and distribution compared to earlier EC2 launch type.
- We decided to use EC2 Spot Instances for deploying containers rather than use Fargate Spot since we wanted to have better control over Spot capacity provisioning and recovery in case of Spot Instances not being available. This was particularly important for us in situations when we had to process the occasional large spike in our workload within the required SLA.
For optimizing costs, we leveraged EC2 Spot Instances for almost 95% of the compute instances capacity needs. EC2 Spot Instances are the unused on-demand EC2 capacity available at steep discounts of up to 90 percent. However, they can be interrupted by EC2 service with a notification of two minutes.
Our architecture had to be stateless or fault-tolerant to handle this situation. In our application, even if the Docker container running in an EC2 instance is decommissioned while processing a message, the message in flight will continue to remain in the SQS queue because of the visibility timeout feature of SQS. To prevent other consumers from processing the message again, Amazon SQS sets a visibility timeout, a period of time during which Amazon SQS prevents other consumers from receiving and processing the message. The default timeout is 30 seconds. After the visibility timeout, the unprocessed messages (after a Spot interruption) are made visible to surviving containers.
Also, our service components are stateless and idempotent (provide the same result even if invoked multiple times to process the same data). Amazon ECS integrates very well with EC2 Spot Instances by automatically draining the Spot Instances upon interruption notification. So we do not have to do anything specific to handle interruptions of EC2 Spot Instances and recover stateless application services after a Spot Instance termination. Amazon ECS reschedules the interrupted containers onto the replacement Spot Instances and any other instances available in the cluster. The Docker containers thereafter automatically pick up the last messages that remained unprocessed from the SQS queue.
The other challenge we faced in the adoption of EC2 Spot Instances was the availability of our preferred types and capacity of Spot Instances to be attached to our ECS cluster as per our workload’s needs at any given time. To reduce this risk of nonavailability of Spot Instances, when we requested the necessary capacity, we followed a number of best practices as described below to ensure that we always managed to get the desired capacity of EC2 Spot Instances for our computing needs in our ECS cluster.
1. EC2 Auto Scaling Groups (see 10-minute tutorial):
We created two Auto Scaling groups, one for On-Demand Instances and another for Spot Instances capacity leveraging the following Spot best practices.
2. Spot Instance Diversification—with Multiple Instance Types and AZs:
One of the best practices of using Spot Instances is to diversify the EC2 instances (or specify instance overrides) across different instance families, sizes, generations, and Availability Zones in order to access multiple spare capacity pools. We configured an Auto Scaling group for Spot Instances with multiple EC2 Spot Instance pools with three Availability Zones for diversification. For On-Demand, we created another Auto Scaling group with three Availability Zones.
Since the workload is compute intensive, we used different instance types in the compute optimized instance family.
3. Spot Allocation Strategy—Set to Capacity Optimized:
EC2 Spot allocation strategy defines how Spot Instances are deployed in the Auto Scaling group while fulfilling the capacity. We used the capacity-optimized allocation strategy, which provisions instances from the Spot Instance pool with the most optimal spare capacity for the desired number of instances being launched. Being instance flexible and providing as many instance types and Availability Zones as possible increases the effectiveness of the capacity-optimized allocation strategy, reducing the likelihood of interruptions which also lowers the overall cost of our workload. Our Auto Scaling groups are not configured to use any scaling plans. Instead, we leveraged the cluster Auto Scaling feature of Amazon ECS, which manages the scale-out and scale-in of the EC2 Auto Scaling groups based on the number of pending tasks in the cluster.
4. ECS Spot Interruption Handling with Automatic Draining of Spot Instances:
We created an EC2 launch template with the user-data section configuring the ECS agent to enable the automatic draining of the Spot Instances. With this feature enabled, if the container instance receives a Spot interruption notice, then the agent sets the instance status to DRAINING, which gracefully shuts down and replaces all tasks running on the instance that are part of a service.
echo "ECS_ENABLE_SPOT_INSTANCE_DRAINING=true" >> /etc/ecs/ecs.config
5. Application Scaling and ECS Cluster Scaling Using Capacity Providers:
We configured the application or ECS service scaling based on the number of messages in the SQS queue. The ECS service scaling uses a step scaling plan as follows.
Set to 0 tasks when <= SQS Queue Depth < 1
Set to 4 tasks when 1 <= SQS Queue Depth < 10000
Set to 100 tasks when 10000 <= SQS Queue Depth < 80000
Set to 1000 tasks when 80000 <= SQS Queue Depth
For scaling the instances in the ECS cluster, we leveraged the ECS cluster scaling feature. We created one capacity provider per Auto Scaling group and attached the capacity providers to the ECS cluster. We enabled both managed scaling and managed termination protection features in each ECS capacity provider configuration. With managed scaling enabled, Amazon ECS manages the scale-in and scale-out actions of the Auto Scaling group through the use of AWS Auto Scaling policies. The capacity provider attaches a target tracking policy to the respective Auto Scaling group for managing the scaling actions. When managed termination protection is enabled, Amazon ECS prevents Amazon EC2 instances that contain tasks and that are in an Auto Scaling group from being terminated during a scale-in action.
We also defined a custom capacity provider strategy for our ECS service. In our case, we have assigned base capacity to the on-demand capacity provider and the remaining capacity to the Spot capacity provider using base and weight options in the capacity provider strategy.
Conclusion
Migrating the performance metrics computation from Lambda to a cluster of Docker containers, orchestrated by Amazon ECS and backed by Amazon EC2 Spot Instance, helped us achieve all the original goals of this re-architecting in terms of cost optimization and improving the throughput.
Learning—What Worked Well?
- The overall cost of the performance metrics computation has come down to $16,000 per month from $58,000, which is a reduction of about 73 percent of the AWS Lambda cost without degradation in throughput.
- We managed to improve the elasticity of our workload and control the cost whenever there is a sudden spike in the incoming patient records. For example, a 10 times increase in the patient records will result in only a .3 times increase in cost for the overall pipeline. This is due to the fact that the processing cost is now linked to the vCPU:mem resources available at lower costs of EC2 Spot Instances and not linked to the number of times the Lambda function is invoked or requested as well as the duration of Lambda function processing.
- As an offshoot of using Docker containers for performance metrics, we also reduced the need for a larger provisioned capacity of read capacity units (RCUs) and write capacity units (WCUs) for concurrent invocations on DynamoDB from the Docker container tasks compared to the Lambda architecture. This is because container tasks could scale more gradually (with lesser concurrency) for processing spikes in messages as compared to the need for faster scaling of the Lambda function.
Next Steps—What Can Be Improved?
- The cost optimization process took more time than we expected because we sequentially tested rightsizing of instances needed to achieve the desired throughput of our application and only then started experimenting with Spot Instances. Proof of concept on Spot Instances needs to be done in parallel to performance testing to understand how the variables of Spot Instance diversification could impact the Auto Scaling group configurations for the ECS cluster and to meet our Spot availability objectives.
- Building reports for tracking savings due to Spot compared with using On-Demand Instances and tracking Spot interruptions for each service will help us further optimize the costs and ensure a good experience for our end users.

Karthik Kalkur, Senior Architect, Athenahealth
Karthik has more than 22 years of experience in architecture, design, end-to-nd development of software applications in various industries such as Aviation, Investment Banking, Health and Retail, having built multiple software products throughout his career. Currently working as an Senior Architect in athenahealth’s Product Engineering organization, Karthik is part of a team that is modernizing monolithic applications and building internet-scale applications using Microservices on public clouds.