AWS Database Blog
Diagram-as-code using generative AI to build a data model for Amazon Neptune
To be successful with a graph database—such as Amazon Neptune, a managed graph database service—you need a graph data model that captures the data you need and can answer your questions efficiently. Building that model is an iterative process. The earliest stage of the process, in which you are merely getting initial elements on paper or whiteboard, is often the hardest. Modeling is demanding, but graph modeling in particular is unfamiliar to many data architects. Getting past that initial hurdle is essential to the success of your project.
In this post, we show you how, in stage one of the process, you can use generative AI and diagram-as-code tools to discover that initial model as simply and quickly as possible while meeting specific exit criteria:
- The model is researched. You looked at the corpus to learn how others in this problem domain have built similar models. Generative AI helps meet this requirement because it draws on the same corpus you would consider if you were to research on your own.
- The model captures the essential objects and relationships you require.
- The model answers your questions. You can test-drive it to confirm.
- The model avoids implementation lock in. In particular, it can be mapped to either of the two dominant graph representations: labeled property graph (LPG) and Resource Description Framework (RDF).
- Delivering the model does not require elaborate tooling or superior graph database skill. Besides generative AI, diagram-as-code tools allow you to show the model as a picture without the need for sophisticated modeling tools.
The outcome is a design the team can rally around.
We also give tips how to grow the initial model through the remainder of the process.
Overview of solution
To demonstrate the early stage, we use the following example: In the role of data architect for a firm that contracts construction companies, you are given the requirement to build a database of construction companies, their relationships, and whether a company appears on a legal exclusion list.
We show not only the data model for this, but also how to arrive at that model. To get started, you need only a browser. As the following diagram shows, you use a generative AI chat playground in Amazon Bedrock plus a diagram-as-code drawing tool called PlantUML using the PlantText editor.
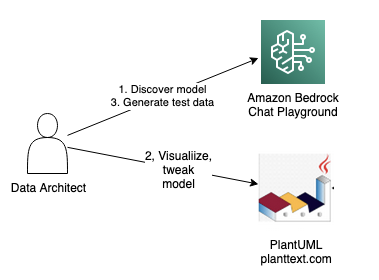
There are three steps:
- Chat with a large language model (LLM) in Bedrock’s playground to discover an initial model. Bedrock is a managed service offering foundation models from leading AI companies like AI21 Labs, Anthropic, Cohere, Meta, Stability AI, and Amazon with a single API to build generative AI applications.
- Enter that model into PlantText to see it rendered visually. You might decide to ask follow-up questions in the playground. You might also adjust the model manually in PlantText.
- When you are happy with the model, ask for test data in the playground.
You can go further by loading the sample data into a Neptune database and running queries to test-drive the model. For this, you need a Neptune cluster and a Neptune Workbench notebook.
The following diagram illustrates the solution workflow.
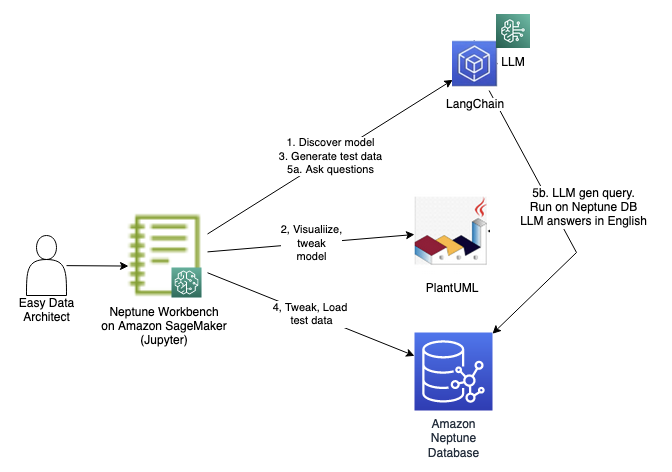
You run through the steps shown in the diagram using a notebook. The first three steps are the same as what we just discussed, except they are run programmatically as cells. We have included them in the notebook in case you would like to run the entire flow solely from the notebook. The steps are as follows:
- Chat with an LLM to discover an initial model.
- Enter that model into PlantUML to see it rendered visually. You can ask follow-up questions and make any adjustments.
- Ask the LLM for test data.
- Modify the test data and then load it into the Neptune database.
- Query the test data using natural language queries. This is accomplished using the LLM augmented by Neptune using the LangChain library. We discuss how this works in greater depth later in this post.
Refer to the notebook in our GitHub repository for setup instructions.
This solution incurs a cost. In particular, it requires a Neptune cluster, a Neptune notebook instance, and the use of a Bedrock LLM. Refer to the pricing pages for Neptune and Bedrock for more detail.
Discover a model
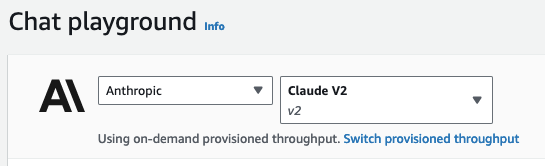
Start discovering a data model using generative AI. In your browser, navigate to Bedrock and select the Chat playground from the menu. For model category, select Anthropic. For model, select Claude V2.
Enter your initial question under the heading Add instructions. Ask the question:
Describe a data model for a company exclusion list.
Here is an excerpt of the response we received. Yours may differ. We added emphasis to highlight noteworthy terms:
A knowledge graph representing a company exclusion list could potentially model entities like companies, sectors, regions, and reasons for exclusion. It might link together companies with attributes like industry, location, business practices, and controversy level. The graph could illustrate why certain companies are excluded by connecting them to concepts like human rights violations, environmental damage, or corruption. Relationships like “company X is excluded for reason Y” could be modeled.
Visualize the model
The response makes a helpful recommendation, but it’s more helpful to see a picture. Continue in the playground. In the same chat, ask a follow-up question by entering under Add instructions:
Show as a PlantUML class diagram.
The response includes the following code snippet.
We asked to see a Unified Modeling Language (UML) class diagram because it is an effective visualization of a data model. UML is a complex modeling language, but emerging tools like PlantUML make it straightforward to use. PlantUML is a diagram-as-code tool. You provide a few lines of text as input and PlantUML provides an image as output. The LLM can’t render a UML diagram as an image, but it can render PlantUML-compliant text.
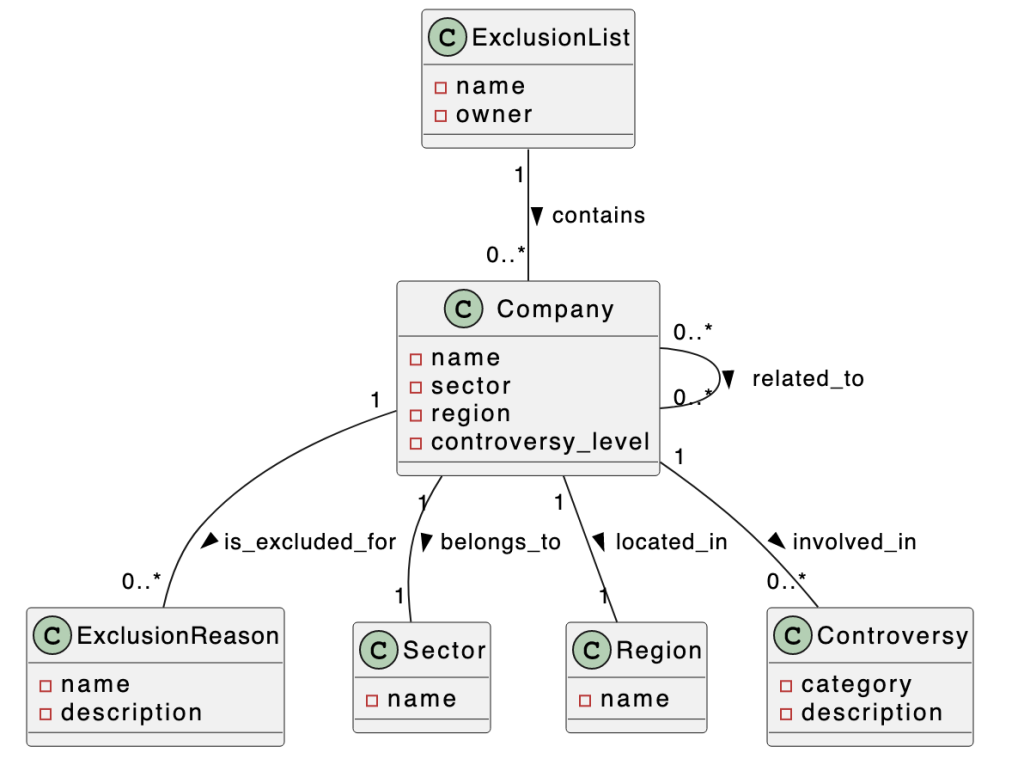
Enter the code block from your response into PlantText or in the notebook run the cell under the heading Show PlantUML diagram. For our example, PlantUML rendered the following diagram.
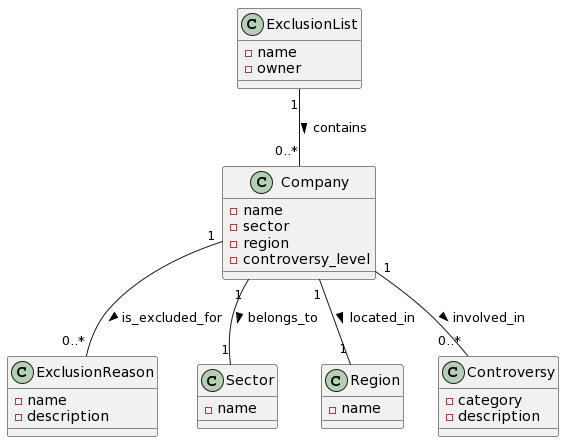
The main class is Company. It can belong to an ExclusionList. It is associated with Sector, Region, and Controversy. This is a great start, but we would like to make a few enhancements. For one, we would like the diagram to show how companies are related to each other.
Ask and visualize model enhancements
In the playground, as part of the same chat, enter the following under Add instructions:
Include how companies are related to each other.
The LLM suggests additions to the model. It modifies the PlantUML code block to add a related_to association between companies.
Company "0..*" -- "0..*" Company : related_to >
Paste that into PlantText to see a visualization.
The diagram shows the related_to relationship connecting Company to itself.
Adjust the model
You can adjust the model manually either in PlantText or under the notebook heading Let’s tweak a bit. In PlantText, enter the following modified model:
The next figure shows the rendered image.
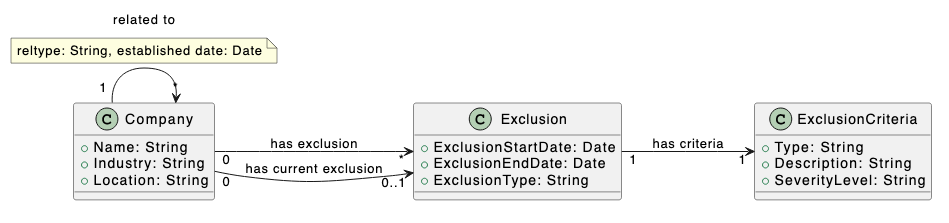
Here is a summary of the changes:
Companyremains, but you removedSectorandRegionclasses and replaced withIndustryandLocationattributes ofCompany.- You enhanced company relationship by adding
reltypeandestablished dateattributes of therelated_toassociation. - You restructured the representation of exclusions, removing
ExclusionList,ExclusionReason, andControversy. You added anExclusionclass. Over time, a company can have zero or more exclusions, represented by thehas exclusionassociation. Thehas current exclusionassociation indicates that the company currently has an exclusion. An exclusion can have a start date and end date.ExclusionCriteriaenumerates the types of exclusions and their severity. EveryExclusionis linked to oneExclusionCriteria.
UML is a powerful modeling language, but we uses its features sparingly. All of our relationships are associations. UML also offers dependencies, aggregations, and compositions, but we wanted to keep it simple. The related to association has attributes. We indicate these in a note. A more advanced approach would be to use an association class.
Generate test data
Ask the LLM to create sample data for the updated model. Back in the playground, in the same chat, ask these two questions under Add instructions:
- Generate OpenCypher queries to create sample data based on [paste PlantUML code here]
- Generate RDF sample based on [paste PlantUML code here]
Significantly, you generate from these prompts both LPG (using CREATE commands in OpenCypher, one of main query languages for LPG) and RDF data. Neptune supports both representations, and your model is flexible enough to permit mock data generation in each. We focus on the OpenCypher/LPG data in this post.
We saved the responses in the notebook. The data is promising, but you may decide to make a few minor adjustments to set up specific test cases.
Load test data into a Neptune database
The remaining steps use the Neptune database. We demonstrate using the OpenCypher test data. In the notebook, run the cell under the heading Load data from OC into Neptune. This runs OpenCypher CREATE statements to load an updated version of the generated test data. The data contains five companies: A, B, C, D, and E. A is related to B and C. C is related to D. A has a current exclusion and a past exclusion. B has a current exclusion. C has a past exclusion.
Here is an excerpt of the OpenCypher code, showing the creation of companies A and B. The full code can be found in the notebook.
Ask questions
One of the goals of this stage was to test-drive the model. Now that you have test data loaded into the Neptune database, you can run queries against the model. Generative AI enables you to do this without having to write the OpenCypher queries by hand. You can ask a natural language question and see the OpenCypher query it generates. It even responds back in natural language.
The notebook uses LangChain, a Python library that provides an interface to LLM models. LangChain supports the Retrieval Augmented Generation (RAG) pattern, which allows the LLM to get help from a database to answer a question. The LLM in this case gets help from the Neptune database:
- The Neptune database provides the graph schema: node labels, properties, and edge labels. The LLM generates an OpenCypher query, but it uses this schema to know the labels and properties to use.
- The query is run in the Neptune database.
Run the cells under the heading Ask questions. There are six questions. Let’s investigate the first under subheading Q2 – Which companies have current exclusions.
The code cell is the following:
The LLM, having the Neptune schema at hand, generates the following query:
It looks for node c labeled Company with a hasExclusion edge to node e labeled Exclusion. The ExclusionType property of node e must be Financial.
The query is run against the Neptune database and returns the result as JSON:
The LLM provides a natural language response.
Based on the provided information, there are 3 companies listed: Company C, Company D, and Company E. None of them have any information indicating they currently have an exclusion. So it seems that none of the companies listed have a current exclusion
Check this result against the test data and verify that it is correct.
The next stage
The initial stage is a success. In the next stage, you evolve the model. Part of this involves adding more classes, attributes, and relationships to address requirements. There are additional considerations that we now discuss.
Mapping initial model to LPG or RDF
The initial model avoids locking in to LPG or RDF. In fact, it is flexible enough to generate mock data in both representations. Neptune supports both, and the two forms can coexist in the same Neptune cluster. Further along in the process you must decide on the physical structure of your data as LPG or RDF.
It helped that generative AI could generate mock data, but you also need a mapping to populate instances into your graph on your own. For LPG, these instances are nodes and edges. In this section, we focus on LPG. Refer to Mapping initial model to RDF for details on mapping to RDF.
Here are rules of thumb to guide the mapping.
A class specifies the structure of a node, its label, and its properties.

To represent a company named Octank in the banking industry and located in New York, we create a node with label Company and properties Name (value Octank), Industry (value Banking), Location (value New York).
An association specifies an edge, its label, and the nodes it connects.

Assuming the exclusion applies to Octank, create an edge with label hasExclusion whose source node is the Octank node described above. The target node is another node labeled Exclusion.
Attributes of the association are represented as edge properties. Assuming the following model, how would you represent that Octank has a partnership relationship with the company Havey Enterprises established on Jan 1, 2000?

If you have nodes labeled Company representing Octank and Havey Enterprises, create an edge connecting the former to the latter. Label the edge relatedTo and assign edge properties reltype (value Partnership) and establishedDate (value 2000-01-01).
Reshape for performance
You might need to reshape the model to improve query performance. Considerations such as edge direction, generic compared to specific edges, node or edge, and representation of edge properties (if RDF) may necessitate model changes. We recommend the Skills Builder course Data Modeling for Amazon Neptune for a deeper understanding of these issues.
Being a good knowledge graph citizen
Your mandate for this use case is not just to build company exclusions, but to build a knowledge graph. The essential nature of a knowledge graph is to combine multiple types of entities from several sources. There will be much more than company exclusions in the graph. With this in mind, consider the following:
- Ensure your exclusion model integrates well with other data. It should use common conventions for IDs and naming, and it should use well-known properties and predicates. Can other entities link to the data in your model?
- Think big. Treat the exclusion model as a data product. A consumer of a data mesh marketplace should easily understand your product and put it to use. But more importantly, think of your knowledge graph as a central place to bring data products together. Not only are you producing a data product, you’re building a mesh-scale meeting place for numerous products.
These considerations are often overlooked in the initial stage.
Mapping initial model to RDF
We have focused on LPG. For completeness, here are rules of thumb for mapping the initial model to RDF.
A class specifies the structure of a resource, its type, and its datatype properties. Suppose we have the class shown.
To represent in RDF a company named Octank in the banking industry and located in New York, build a set of triples describing a resource known as https://myorg.com/company/octank. We can shorten the resource name to :octank by specifying that “:” is a prefix for https://myorg.com/company/. Each line has three terms: subject, predicate, object.
An association represents a predicate, or object property, that connects resources. Let’s represent the has exclusion association shown in the following figure.
In RDF, assuming the exclusion is a resource known as :octank_exclusion_1, specify the relationship using a triple:
:octank :hasExclusion octank_exclusion_1 .
Attributes of the association are represented as statements about the relationship. Assuming the following model, how would you represent that the company Octank has a partnership relationship with company Havey Enterprises established on Jan 1, 2000?
There are several ways to express this in RDF, and one of your tasks is to evaluate them to select the most suitable. One way is to define the relationship as its own resource :octank_havey_rel.
Clean up
If you setup a Neptune cluster and notebook instance to follow along, delete those resources if you wish to avoid further costs.
Conclusion
In this post, we showed how, in stage one of your graph initiative, to discover a graph data model using generative AI and diagram-as-code tools. This allows you to quickly build a starting point model and test-drive it to ensure it meets your requirements.
Generative AI accelerates discovery. The alternative is to research on your own, but the LLM uses the same corpus and provides compelling answers instantly.
Diagram-as-code tools, notably PlantUML, quickly generate useful data model diagrams that the team can rally around. Even better, in our test the LLM generated valid PlantUML code from its previous text model!
We showed how to test-drive the model. You generated test data using generative AI, loaded that data into a Neptune database, and used the LLM augmented by Neptune to run common queries. The results showed that the model supports these queries. It also demonstrated how to write these queries. Significantly, you didn’t need significant OpenCypher expertise to succeed in this stage. The LLM generated the queries.
Wrapping up, we looked ahead to the next stage. You need to assess whether to represent instances as LPG, RDF or both. Despite its simplicity and informality, the initial model maps to both LPG and RDF representations. For performance reasons, you might need to reshape the initial model. You can rise to the challenge of knowledge graphs by designing exclusions to fit with other data in the graph. Think big! Not only are you offering a data product, your knowledge graph is the meeting place of many data products.
About the Author
 Mike Havey is a Senior Solutions Architect for AWS with over 25 years of experience building enterprise applications. Mike is the author of two books and numerous articles. Visit his Amazon author page.