AWS Database Blog
Graphing investment dependency with Amazon Neptune
Storing and querying investment dependencies as a graph in Amazon Neptune reveals new relationships. EDGAR (Electronic Data Gathering, Analysis, and Retrieval) is an online public database from the U.S. Securities and Exchange Commission (SEC). EDGAR handles automated collection, validation, indexing, acceptance, and submission forwarding by entities that are required by law to file forms with the SEC. These include institutional investment managers such as Registered Investment Advisors, banks, insurance companies, hedge funds, and other groups with investment discretion over such accounts.
These filings contain many data nuggets, such as:
- Data on publicly traded companies and firms that have sold debt to the public.
- Executive pay, including the following:
- The company’s annual proxy statement.
- The company’s annual report on Form 10-K.
- Registration statements filed by the company to register Securities for sale to the public.
- Position-level disclosure from all institutional investment managers with more than $100 million in assets under management with long U.S. holdings. All US-listed equity Securities in the manager’s portfolio are included and detailed according to the number of shares, the ticker, and the issuer name.
These data nuggets are held as individual facts about events that these firms filed. However, EDGAR does not tie all the events together to reveal any relationships or patterns.
This post shows how to process and merge EDGAR filings into Amazon Neptune to pull out relationships and provide a repeatable model for other events.
Database options
When dealing with data, today’s technologists have many choices. The following table shows some common data categories and use cases.
| Relational | Key-Value | Document | In-memory | Graph | Time-Series | |
| Referential Integrity | High throughput | Store documents and quickly access querying on any attributes | Query by key with microsecond latency | Quickly and easily create and navigate relationships between data | Collect, store, and process data sequenced by time | |
| ACID Transactions | Low-latency
reads and write |
|||||
| Schema-on-write | Endless scale | |||||
| Common Use Cases | Lift and shift,
ERP, CRM, Finance |
Real-time bidding, shopping cart, social product catalog, customer preferences | Content Management,
personalization, mobile |
Leader boards, real-time analytics,
caching |
Fraud detection,
social networking, recommendation engine |
IoT applications
event tracking |
This post uses two databases, Amazon DynamoDB and Amazon Neptune, to handle database workloads. DynamoDB handles the coordination of the loading process. DynamoDB is a key-value and document database that delivers single-digit millisecond performance. It’s a fully managed, multiregional, multi-master, durable database with built-in security, backup and restore, and in-memory caching. These characteristics meet the requirement of fast access for insert/select operations and allow you to use its streaming capabilities to trigger AWS Lambda functions.
Amazon Neptune is a high-performance graph database that is fast, reliable, and fully managed to handle highly connected datasets. It is purpose-built to optimize for storing billions of relationships and querying graphs with millisecond latency. Amazon Neptune supports the popular graph models Property Graph and W3C’s Resource Description Framework (RDF), and their respective query languages Apache TinkerPop Gremlin and SPARQL.
SPARQL Protocol and RDF Query Language are an RDF query language—semantic query languages for databases—that can retrieve and manipulate data stored in RDF.
Gremlin is the graph traversal language of Apache TinkerPop. It is a functional data-flow language that enables you to succinctly express complex traversals on (or queries of) your application’s property graph. Every Gremlin traversal is composed of a sequence of (potentially nested) steps. A step performs an atomic operation on the data stream.
You can parse this information for key elements that translate into nodes (data entities), edges (relationships), and properties to represent details.
The following diagram shows a two-node Neptune model.
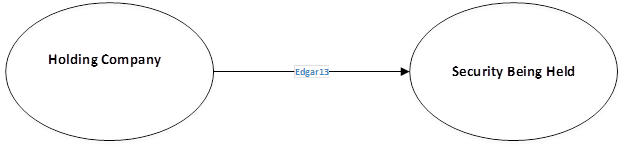
One node is for the holding company; the other is the Security itself. The relation is the EDGAR form with attributes about the holding.
The SEC EDGAR repository has position-level disclosure from company officers who have increased, decreased, or were granted an equity stake in their company. This information expands the model into the following three-node model.

There is a node for the holding company of the Security, the Security itself and for beneficial holding. This base model reflects activity on a large scale for individual Securities, shared purchases, and insider activities.
You can add social media, new, and industry events to expand the model further. The following diagram shows a five-node model.
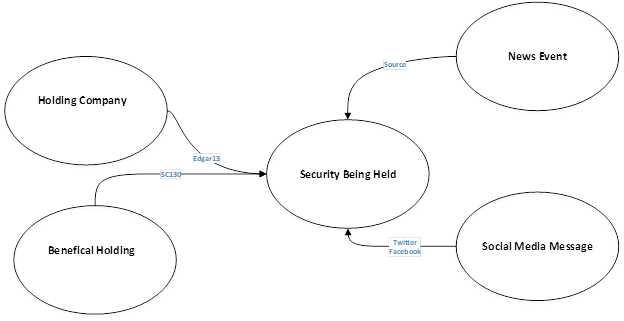
There are nodes for: the holder of the Security, the Security, beneficial holding, social media, and news events. The relation between nods are from the EDGAR form or a News source or a Social Media originator.
The graph paradigm shows what’s possible by using connections within the data elements and the information derived from cross-connections. With this information, you can view large Securities positions and common underlying Securities between multiple entities who hold the largest position in a given Security.
Using EDGAR data
You can implement a process to pull public data from the SEC EDGAR for holding. This post focuses on just the holdings of individual firms. The system uses AWS Lambda, Amazon SQS, Amazon DynamoDB, and Amazon Neptune. A step function triggers the entire process. The following diagram illustrates this process.
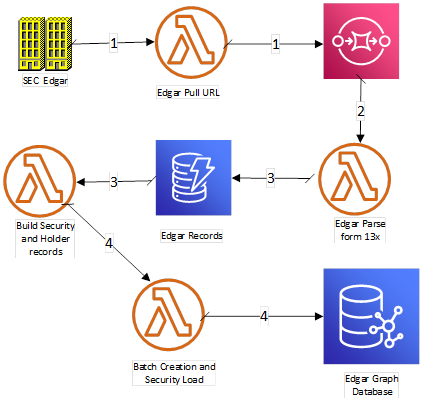
The AWS Lambda function attaches to the EDGAR site. In Step 1, the service retrieves the master index for the desired quarter and year of interest. The master index is parsed, which contains the URLs for all documents related to holdings, which are then inserted into an SQS queue.
In Step 2, records enter the Amazon SQS queue, which triggers a Lambda function that scales out to meet the volume. This Lambda function parses each EDGAR document and extracts data for the holding company and Securities being held. AWS Lambda inserts these individual records into a DynamoDB table (for this post, the table is Edgarrecord).
In Step 3, the Amazon DynamoDB Streams for the table Edgarrecord, and triggers an AWS Lambda function to process each record and creates a new record formatted for each Neptune edge and node.
In the step function, there is an AWS Lambda function that confirms that all the processing on the SQS queue and the DynamoDB stream is complete. In Step 4, this confirmation triggers a final Lambda function, which processes all the records in the DynamoDB tables and loads the Neptune database.
The result is a graph database that’s records the connection of Securities and the firms that have large positions according to the SEC. The following diagram is a view of the graph database that you can create.
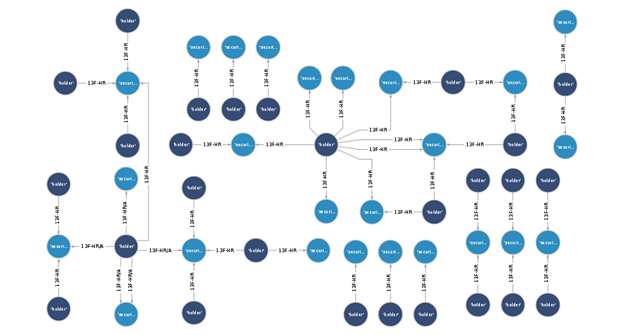
When the data is fully loaded, you can run Gremlin queries to examine the database. For more information about these queries, see the GitHub repo. The notebook contains sample data that does not reflect any current or previous SEC EDGAR relations.
To determine the number of vertexes the load created, enter the following code:
To determine the number of edges created, enter the following code:
To determine the number of edges on the vertexes, enter the following code:
Conclusion
The SEC EDGAR database contains a wealth of financial information. You can use a graph model in Neptune to record the relations and map commonalities to provide insights into dependencies between the SEC EDGAR firms.
The model created from public data is just a building block. You can expand it to show issue connections, market events to Securities, and economic events to Securities. We have a sample dataset with a notebook located in the Amazon Neptune GitHub repo.
About the Author

Lawrence Verdi is a Senior Partner Solutions Architect with Amazon Web Services.