AWS Database Blog
How Zendesk tripled performance by moving a legacy system onto Amazon Aurora and Amazon Redshift
This is a guest post by James Byrne, Engineering Leader at Zendesk, focusing on data pipeline development and operations for the Zendesk Explore analytics product, and Giedrius Praspaliauskas, AWS Solutions Architect.
Zendesk is a CRM company that builds support, sales, and customer engagement software designed to foster better customer relationships. From large enterprises to startups, we believe that powerful, innovative customer experiences should be within reach for every company, no matter the size, industry, or ambition. Zendesk serves more than 150,000 customers across a multitude of industries in over 30 languages. Zendesk is headquartered in San Francisco and operates 17 offices worldwide.
Zendesk Explore provides analytics for businesses to measure and improve the entire customer experience. With Zendesk Explore, businesses get instant access to the customer analytics that matter and a deeper understanding of their customers and business that comes with it.
This post discusses how we moved our legacy system onto Amazon Aurora and Amazon Redshift. We detail the process and architecture that allowed us to build a new data store and triple performance.
Deciding to migrate
In 2015, Zendesk acquired Business Intelligence startup, BIME Analytics. The BIME product served as the building blocks for our current reporting product, Zendesk Explore. Zendesk Explore processes and analyzes multiple data types from various Zendesk products, such as Zendesk Support, Talk, Chat, and Guide. It extracts data from each product and denormalizes, transforms, and loads it into a datastore. A visualization layer sits on top of this datastore, which provides Zendesk customers with a user interface to access the data for analysis. Users can create their own data visualizations and dashboards by simply pointing and clicking.
When the Zendesk team set out to build the foundations for Explore, we began by looking at the tools available to implement data extract, transform, and load (ETL) and analytics in AWS. We focused on Amazon Aurora PostgreSQL to handle the amount of data we had, and Amazon Redshift for larger-scale datasets and fast analytical queries. We could connect to the products and APIs that we needed to extract data from, and denormalize data for better performance.
Within a year, we could build a full ETL pipeline using Aurora PostgreSQL for our customers up to a certain size. After extensive load, stress, and performance testing, we hit our sweet spot at around 60 million customer tickets per single Aurora cluster (running at 80% of CPU). We knew that a small percentage of our biggest customers’ datasets would not be a good fit for Aurora PostgreSQL, because we run data transformations in parallel to complex queries, and a tool optimized for ETL and complex analytics would be a better fit for that pattern at the largest scale.
We use Amazon Redshift as a backend data storage and querying solution for those customers. This approach allowed us to handle the load in the most cost-effective manner, even in multi-tenant implementation, in which multiple customers of various sizes share an underlying Amazon Redshift or Aurora cluster.
Approach
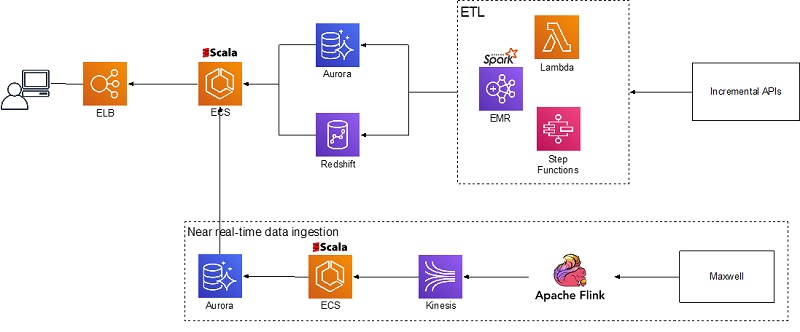
The following diagram shows, at the high level, how the Zendesk Explore team implemented data ingestion, transformation, load, and analytics. The following services perform various functions:
- Amazon EMR, AWS Step Functions, and AWS Lambda ingest and transform static data from Zendesk Incremental APIs
- Apache Flink, Amazon Kinesis, and Amazon ECS ingest near-real-time data from database binlogs
- Aurora and Amazon Redshift serve as data storage
- Amazon ECS hosts a custom query engine that users access through Elastic Load Balancing
Data ingestion
Zendesk Explore ingests data from two main sources: public APIs for static data (older than 1 hour) and near-real-time log stream (10 seconds–1 hour). We have a scheduled process to query Incremental Export API endpoints, which pulls data modified since the last run. The Explore ETL process, which runs on Amazon EMR, consumes the data.
Log stream originates as a database binlog that is streamed to Amazon Kinesis using Maxwell and processed or aggregated on the way using Apache Flink. The data is aggregated into bins, which the Explore ETL process picks up every 10 seconds, and stored in the Aurora cluster.
ETL
Zendesk Explore runs ETL for thousands of customers on a per-customer basis (for each customer, some ETL logic is executed). We can transform hundreds of millions of rows into thousands of records with only a few columns. For example, if a customer has 10 million records (tickets updates), we join them during transformation with other tables, aggregate the data, and present this aggregation in just a thousand records.
Our legacy ETL process used Scala and SQL queries that ran data transformation on the PostgreSQL cluster. As part of refactoring, we moved legacy implementation of the data loading and transformations to Spark on Amazon EMR to offload that processing to the tool that is more suitable for ETL. This way, we could dedicate Aurora and Amazon Redshift completely to data storage and querying. This allowed us to host multiple tenants on the clusters without degrading performance by running data transformations in parallel. This approach helped us co-locate up to 600 tenants on a single Aurora cluster, compared to the initial limit of 100–200.
We use Step Functions and Lambda to translate the data transformation process into a large graph. This triggers data transformation steps that execute as Apache Spark applications that run on Amazon EMR. This process repeats every hour for every customer to process data retrieved using Incremental APIs.
Data storage
Explore uses Aurora PostgreSQL and Amazon Redshift for data storage. We base the decision of which storage solution to use on the customer dataset size, usage patterns, and resulting performance. Aurora PostgreSQL hosts small and medium customers (up to 3–6 million tickets). Amazon Redshift hosts large customers. We use query performance tracing and look at the performance (customer wait time) of the core queries using internal administration tools. As customers’ datasets grow, they may move from one data storage to another.
Both Aurora PostgreSQL and Amazon Redshift use a multi-tenant approach with up to hundreds of customers co-located on a single cluster. This approach allows cost-effective storage of customer data without affecting query performance. Also, co-locating multiple customers on a single large Amazon Redshift cluster allows better parallel query performance needed for the dashboards, in which multiple parallel queries are running for a single web page.
Analytics
Zendesk Explore provides dashboards for both static and near-real-time data. You can use prebuilt dashboards, visualizations, and queries, or use the query builder to build visualizations with metrics you choose using data across multiple tables. To optimize these queries, Zendesk Explore uses an intermediate custom application layer that can rewrite queries, route queries to the different tables based on the predicates used, and also has an application cache. This query engine is written in Scala and runs on an ECS cluster.
Summary
This post walked you through Zendesk’s implementation of a multi-tenant analytics solution. It showed how you can use multiple databases and analytics solutions to serve datasets of varying sizes and temperature cost-efficiently and flexibly. You can evolve this approach further by using the latest developments AWS announced at re:Invent 2019—the Amazon Redshift Federated Query feature, Advanced Query Accelerator (AQUA) for Amazon Redshift, and Amazon Redshift RA3 instances with managed storage.
If you have questions or suggestions, please leave your thoughts in the comments.