AWS Database Blog
Making better decisions about Amazon RDS with Amazon CloudWatch metrics
October 2023: This post was reviewed and updated for accuracy.
If you are using Amazon Relational Database Service (RDS), you may wonder about how to determine the best time to modify instance configurations. This may include determining configurations such as instance class, storage size, or storage type. Amazon RDS supports various database engines, including MySQL, PostgreSQL, SQL Server, Oracle, and Amazon Aurora. Amazon CloudWatch can monitor all these engines. These CloudWatch metrics not only guide you to select the optimal instance class, but also help you choose appropriate storage sizes and types. This post discusses how to use CloudWatch metrics to determine Amazon RDS modifications for optimal database performance.
CPU and memory consumption
In Amazon RDS, you can monitor CPU by using CloudWatch metrics CPUUtilization, CPUCreditUsage, and CPUCreditBalance. All Amazon RDS instance types support CPUUtilization. CPUCreditUsage and CPUCreditBalance are only applicable to burstable general-purpose performance instances.
CPUCreditUsage is defined as the number of CPU credits spent by the instance for CPU utilization. CPU credits govern the ability to burst above baseline level for burstable performance instances. A CPU credit provides the performance of a full CPU core running at 100% utilization for one minute. CPUUtilization shows the percent utilization of CPU at the instance. Random spikes in CPU consumption may not hamper database performance, but sustained high CPU can hinder upcoming database requests. Depending on the overall database workload, high CPU (70%–90%) at your Amazon RDS instance can degrade the overall performance. If a bad or unexpected query, or unusually high workload, causes a high value of CPUUtilization, you might move to a larger instance class. Amazon RDS Performance Insights help to detect bad SQL queries that consume a high amount of CPU. For more information, see Using Performance Insights to Analyze Performance of Amazon Aurora PostgreSQL on YouTube.
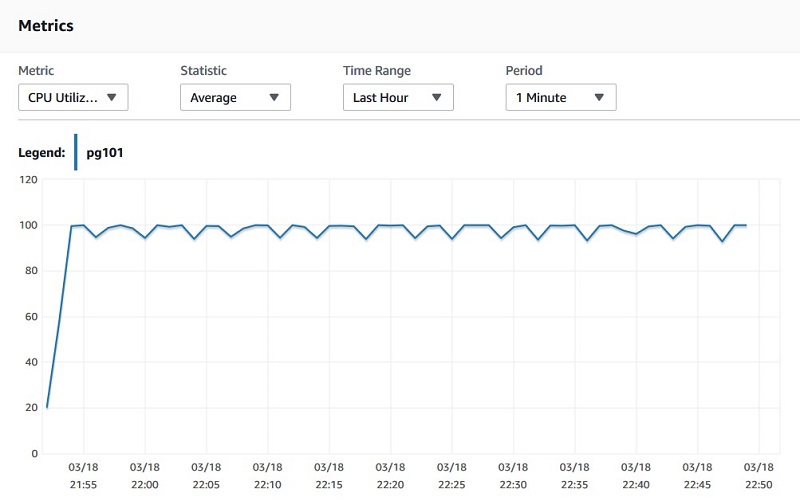
The following CloudWatch graph shows a pattern of high CPU consumption. The CPU is consistently high for a long duration. This sawtooth pattern is a good indication that you should upgrade the Amazon RDS instance to a higher instance class.
Memory is another important metric that determines the performance of the Amazon RDS and helps to make decisions regarding Amazon RDS configurations. Amazon RDS supports the following memory-related metrics:
- FreeableMemory – The amount of physical memory the system isn’t using and the total amount of buffer or page cache memory that is free and available. If you have configured the database workload optimally and one or more bad queries are not causing low
FreeableMemory, a pattern of lowFreeableMemorysuggests you should scale up the Amazon RDS instance class to a higher memory allocation. When making decisions based onFreeableMemory, it’s important to look at enhanced monitoring metrics, especiallyFreeandCached. For more information, see Enhanced Monitoring. - SwapUsage – The amount of swap space used on the DB instance. In Linux-hosted databases, a high value of
SwapUsagetypically suggests that the instance is memory-deficient.
Disk space consumption
Amazon RDS Oracle, MySQL, MariaDB, and PostgreSQL engines support 64 TiB of storage space. Amazon Aurora storage automatically grows in 10 GB increments up to 128 TiB. Amazon RDS engines also support storage auto scaling. This option automatically increases the storage by 10 GiB or 10% of currently allocated storage, whichever is higher. For RDS instances, the CloudWatch metric FreeStorageSpace measures the amount of available storage space of an instance.
If the amount of data increases, you see a decline on the FreeStorageSpace graph. If FreeStorageSpace is around 10%–15%, it’s a good time to scale storage. A sudden spike in storage consumption suggests that you should look at the database workload. Heavy write activity, detailed logging, or large numbers of transactional logs are significant contributors to lower free storage.
The following graph shows an Amazon RDS PostgreSQL instance’s FreeStorageSpace metric. It shows that free storage dropped approximately 90% in 20 minutes.

While troubleshooting this issue, the parameter log_min_duration_statement was set to 0. This means each SQL statement was being logged and filling transactional log files. These troubleshooting steps, and CloudWatch graphs help you to decide when to tune the database engine or scale out instance storage.
Database connections
The DatabaseConnections metric determines the number of database connections in use. For an optimal workload, the number of current connections should not exceed approximately 80% of your maximum connections. The max_connections parameter determines the maximum number of connections permitted in Amazon RDS. You can modify this in the parameter group. For more information, see Working with DB Parameter Groups.
The default value of this parameter depends on the total RAM of the instance. For example, for Amazon RDS MySQL instances, the default value is derived by the formula {DBInstanceClassMemory/12582880}.
You should move to an Amazon RDS instance class with higher RAM if the number of database connections is consistently around 80% max_connections. This ensures that Amazon RDS can have a higher number of database connections. For example, an Amazon RDS PostgreSQL instance is hosted on an db.t2.small instance, and the formula LEAST({DBInstanceClassMemory/9531392},5000) sets max_connections to 198 by default.
You can find the value of this instance through the Amazon RDS console and AWS Command Line Interface (CLI) or by connecting to the instance. See the following code:
The following CloudWatch graph shows that database connections have exceeded the max_connections value multiple times between 12:40 and 12:48.

When the number of DB connections exceeds max_connections, you receive the following error message:
In this situation, you should determine the reason behind the high number of database connections. If there are no errors in the workload, you should consider scaling up to an Amazon RDS instance class with more memory.
I/O operations per second (IOPS) metrics
Storage type and size govern IOPS allocation in Amazon RDS SQL Server, Oracle, MySQL, MariaDB, and PostgreSQL instances. With General Purpose SSD gp2 storage, baseline IOPS are calculated as three times the amount of storage in GiB. For optimal instance performance, the sum of ReadIOPS and WriteIOPS should be less than the allocated IOPS. For General Purpose SSD gp3 storage volumes, storage performance can be customized independent of storage capacity. Storage performance is the combination IOPS and storage throughput. On gp3 storage volumes, RDS provides a baseline storage performance of 3000 IOPS and 125 MiB/s. For every RDS DB engine except RDS for SQL Server, when the storage size for gp3 volumes reaches a certain threshold, the baseline storage performance increases to 12,000 IOPS and 500 MiB/s.
Beyond burst capacity, increased usage of IOPS may lead to performance degradation, which manifests in increased ReadLatency, WriteLatency, and DiskQueueDepth. If the total IOPS workload is consistently 80%–90% of the baseline IOPS, consider modifying the instance and choosing a higher IOPS capacity. You can achieve this through a few different methods: increasing General Purpose SSD storage, changing the storage type to Provisioned IOPS, or using Aurora.
Increasing General Purpose SSD storage
You can increase your General Purpose SSD storage so that the instance gets three times the amount of storage in GiB. Though you can create MySQL, MariaDB, Oracle, and PostgreSQL Amazon RDS DB instances with up to 64-TiB of storage, the max baseline performance you can achieve is 16,000 IOPS per volume. This means that for 64-TiB storage volume, with 4 provisioned volumes, the instance has a maximum 64,000 IOPS baseline performance. Database workloads performance is also capped by RDS instance resources. For optimal performance, instance should have enough resources to support storage IOPS. If you see that ReadIOPS are contributing more toward total IOPS consumption, you should move to a higher instance class with more RAM. If the database working set is almost all in memory, the ReadIOPS should be small and stable.
In the following example, an Amazon RDS PostgreSQL instance is configured with 100 GiB GP2 storage. This storage provides 300 IOPS capacity with burst capability for an extended period. As the following graphs show, at 03/27 12:48, WriteIOPS was at 480 and ReadIOPS was 240. The total sum of these (720) was far beyond the baseline capacity of 300. This caused high WriteLatecny and high DiskQueueDepth.
The following graph shows the WriteIOPS value as 480 at 12:48.

The following graph shows the ReadIOPS value as 240 at 12:48.

The following graph shows a high WriteLatency of 78 ms at 12:48.

The following graph shows a high DiskQueueDepth of 38 at 12:48.

Provisioned IOPS
If the instance requires more than 64,000 baseline IOPS or low I/O latency and consistent I/O throughput, consider changing your storage type to Provisioned IOPS. For MariaDB, MySQL, Oracle, and PostgreSQL, you can choose PIOPS in the 1,000–256,000 range.
Amazon Aurora
Consider using Amazon Aurora if the database IOPS performance isn’t limited to a certain number. Limits may be governed by size or type of storage volume. Aurora doesn’t have the same type of IOPS limit; you don’t have to manage, provision, or expand IOPS capacity. Instance size primarily determines the transactional and compute performance of an Aurora workload. The maximum number of IOPS depends on the read/write throughput limit of the Aurora instance. You are not throttled due to the IOPS, but due to the instance’s throughput limit. For more information, please see Choosing the DB Instance Class.
Aurora is a MySQL and PostgreSQL compatible relational database solution with a distributed, fault-tolerant, and self-healing storage system. The Aurora storage automatically scales up to 128 TiB.
Throughput limits
An Amazon RDS instance has two types of throughput limits: Instance level and EBS volume level limits.
You can monitor instance level throughput with the metrics WriteThroughput and ReadThroughput. WriteThroughput is the average number of bytes written to disk per second. ReadThroughput is the average number of bytes read from disk per second. For example, a db.m4.16xlarge instance class supports 1,250-MB/s maximum throughput. The EBS volume throughput limit is 250 MiB/S for gp2 storage per volume based on 16 KiB I/O size, and 1,000 MiB/s for Provisioned IOPS storage type. For gp3 storage volumes, storage performance can be customized of storage capacity. Storage performance is the combination of IOPS and storage throughput. The throughput of io1 volumes varies based on the amount of IOPS provisioned per volume and on the size of the IO operations. It can go maximum up to 4,000 MiB/s for MariaDB, MySQL, and PostgreSQL. If you experience degraded performance due to a throughput bottleneck, you should validate both of these limits and modify the instance as needed.
Amazon RDS Performance Insights
Performance Insights monitors your database instance workload so you can monitor and troubleshoot database performance. With the help of database load and wait event data, you get a complete picture of the state of the instance. You can use this data for modifications in the instance or workload for overall better database performance.
The following CloudWatch graph shows a high CommitLatency in an Aurora PostgreSQL instance. The CommitLatency is 68 ms at 15:33.

The following graph shows a high IO:XactSync between 15:33 and 15:45.

Looking at Performance Insights, you see that at the time of high CommitLatency, the wait event IO:XactSync was high too. This wait event associates with the CommitLatency and is the time spent waiting for the commit of the transaction to be durable. It happens when a session is waiting for writes to stable storage. This wait most often arises when there is a high rate of commit activity on the system. During this latency, Aurora is waiting for Aurora storage to acknowledge persistence. In this case, the storage persistence might be competing for CPU with CPU-intensive database workloads. To alleviate this scenario, you can reduce those workloads or scale up to a DB instance with more vCPUs.
Summary
This post discussed CloudWatch metrics related to Amazon RDS and Performance Insights, and how you can use those to make decisions about your database. These metrics help you decide on compute and storage scaling, database engine performance tuning, and workload modifications.
The post also reviewed various storage classes that Amazon RDS offers and how Amazon Aurora works differently compared to Amazon RDS instances with EBS volumes. This knowledge can help you to troubleshoot, evaluate, and decide on Amazon RDS modifications.
For more information, see How to use CloudWatch metrics to decide between General Purpose or Provisioned IOPS for your RDS database and Using Amazon RDS Performance Insights.
About the Author

Vivek Singh is a Principal Database Specialist Technical Account Manager with AWS focusing on RDS/Aurora PostgreSQL engines. He works with enterprise customers providing technical assistance on PostgreSQL operational performance and sharing database best practices. He has over 17 years of experience in open-source database solutions, and enjoys working with customers to help design, deploy, and optimize relational database workloads on AWS.