AWS Database Blog
New – Amazon Aurora Optimized Reads for Aurora PostgreSQL with up to 8x query latency improvement for I/O-intensive applications
Amazon Aurora is a MySQL- and PostgreSQL-compatible relational database built for the cloud. Aurora combines the performance and availability of traditional enterprise databases with the simplicity and cost-effectiveness of open-source databases. We are excited to announce the launch of the Optimized Reads feature for Aurora PostgreSQL. Aurora Optimized Reads delivers up to 8x improved query latency and up to 30% cost savings compared to instances without it, for applications with large datasets that exceed the memory capacity of a database instance. This new price-performance feature is available on AWS Graviton-based db.r6gd and Intel-based db.r6id instances that support non-volatile memory express (NVMe) storage.
Aurora Optimized Reads supports two capabilities:
- Tiered cache – This allows you to extend your DB instance caching capacity by utilizing the local NVMe storage. It automatically caches database pages about to be evicted from the in-memory database buffer pool, offering up to eight times better latency for queries that were previously fetching data from Aurora storage.
- Temporary objects – These are hosted on local NVMe storage instead of Amazon Elastic Block Store (Amazon EBS) based storage. This enables better latency and throughput for queries that sort, join, or merge large volumes of data that don’t fit within the memory configured for those operations.
In this post, we discuss the Optimized Reads feature, typical use cases, and feature availability by engine and storage configuration. We dive deep into the tiered cache capability and how it can improve the query performance of latency-sensitive workloads and monitoring options. We also provide an overview of the temporary objects capability.
Query performance challenges with data growth
Customers across industries rely on Aurora to run their most demanding applications, from simple queries to processing massive datasets. Speed is vital for gaining insights and making timely decisions. However, as data volumes grow, fitting frequently accessed data (your working dataset) into memory becomes challenging. When needed data isn’t in memory, Aurora fetches it from storage, increasing DB instance CPU and network utilization, causing higher latencies for queries, and incurring I/O costs. With the new Aurora I/O-Optimized configuration option, you can get predictable pricing for I/O-intensive applications. However, to mitigate the impact of network I/O latency involved in reading data pages from Aurora storage, customers often configure larger instances, like db.r6i.32xlarge, with memory matching their working datasets, to meet their business SLAs. Overprovisioning instances for your workload solely for memory may not be cost-effective, especially when the CPUs are underutilized.
Benefits of Aurora Optimized Reads
With the launch of Aurora Optimized Reads, you can now take advantage of the locally attached NVMe solid state drives (SSD) available on db.r6gd and db.r6id instances. The Optimized Reads tiered cache increases the DB instance caching capacity through seamless integration of local NVMe storage to the database buffer pool. By caching data locally on the NVMe storage, Optimized Reads delivers faster response time when compared to Aurora network storage. Overall, the Optimized Reads feature improves price-performance by reducing the need to overprovision instances just for memory to reduce query latency. It also provides more flexibility to expand your application’s working dataset beyond the memory of even the largest instance, letting you gain more and faster insights from your data.
The following table details the Optimized Reads feature capability availability by engine, version, and storage configuration for your planning. Note that this feature is available for Aurora provisioned instances only.
| Engine | Cluster Storage Configuration | Optimized Reads | Versions Supported | |
| Temporary Objects | Tiered Cache | |||
| Aurora PostgreSQL Compatible | Standard | Yes | No | 15.4 and higher, 14.9 and higher |
| I/O-Optimized | Yes | Yes | ||
Introducing the Optimized Reads tiered cache
The Aurora Optimized Reads tiered cache capability is ideal for high-speed OLTP reads with hundreds of thousands of concurrent queries affecting a small number of rows that exceed available memory of a database instance. These include the following:
- Internet-scale applications such as payments processing, billing, and ecommerce with strict performance SLAs
- Real-time reporting dashboards that run hundreds of point queries for metrics and data collection
- Generative AI applications with the pgvector extensions to search approximate nearest neighbors across billions of vector embeddings
The following figure shows the high-level view of an Amazon Aurora PostgreSQL-Compatible Edition I/O-Optimized instance with the Optimized Reads feature. In Amazon Aurora PostgreSQL, data pages are cached in a shared memory area referred to as a buffer pool, and the size of this area is controlled by the shared_buffers parameter (the default is approximately 75% of the instance memory). If the working dataset for your workload can’t fit in the shared buffers, then Aurora must fetch data pages (each page size is 8 KB) from its storage volume. With Optimized Reads, Aurora periodically identifies pages that are candidates for eviction, and writes them to the local NVMe storage in advance. This allows Aurora to search the requested pages in the tiered cache whenever the page is not found in memory, thereby reducing the need to go to Aurora storage. Also, once the page is modified in the buffer pool, its copy (if any) in the tiered cache is automatically invalidated, providing transactional consistency.

Similarly, if the Aurora cluster has a reader instance that supports the Optimized Reads feature, the page changes from the writer instance are replicated to the reader’s buffer pool, and the corresponding changes are applied to the reader’s NVMe storage. For Aurora clusters with Cluster Cache Management (CCM) enabled, Optimized Reads extends caching by mirroring the writer’s tiered cache content to readers. This warms up the reader cache and improves query performance after failover. The tiered cache can also survive independently from database process failures or restarts, similar to Aurora’s survivable buffer cache. See Amazon Aurora storage and reliability for more information.
For an Aurora PostgreSQL I/O-Optimized instance where the Optimized Reads tiered cache capability is available, Aurora allocates twice the instance memory for temporary objects, approximately 10% of the storage for internal operations, and the remaining storage to tiered cache.
Enabling the Aurora Optimized Reads tiered cache
To use the Optimized Reads tiered cache capability, provision a new Aurora PostgreSQL I/O-Optimized cluster with supported db.r6gd or db.r6id instances (as shown in the following screenshots). If you have an existing Aurora PostgreSQL I/O-Optimized cluster, you just need to modify your writer or reader DB instance (note that this requires downtime). No additional configuration option or database parameter changes are required to turn on the Optimized Reads feature.


After provisioning and connecting to the DB instance, you can verify if the Optimized Reads feature is enabled by issuing the following SQL command:
Based on your use case and performance need, you can use the Optimized Reads feature for the writer, reader, or both. For example, you can have the writer instance with db.r6gd.4xlarge (with Optimized Reads), and the reader instance as db.r6g.4xlarge (without Optimized Reads).
To switch back to a non-Optimized Reads Aurora instance, modify the DB instance class and choose a non-NVMe-based instance type. See Modifying a DB instance in a DB cluster for more information.
Optimized Reads tiered cache performance benefits
The tiered cache capability provides the most benefit for OLTP queries with small reads from Aurora storage, such as a SELECT query accessing a small number of rows per table through indexes. These queries are most impacted by network transmission time between Aurora storage and DB instances, so they gain the most advantage from the tiered cache.
We used the sysbench benchmarking tool (see GitHub for instructions on usage) to evaluate the tiered cache benefit for OLTP workloads. The test environment had two Aurora PostgreSQL 15.4 clusters with writer instances only—one db.r6g.8xlarge (32 vCPU, 256 GiB memory) and the other db.r6gd.8xlarge (32 vCPU, 256 GiB memory, 1900 GB NVMe SSD). We ran the oltp_read_write benchmark with 16 tables of 250 million rows each to create a 1 TB sized database, then ran fixed-rate benchmarks with uniform distribution to load the buffer pool. This test compared the performance with and without Optimized Reads tiered caching. For our benchmarking, we ran the test with the following options:
As shown in the following chart, the sysbench results showed an approximate 5.2 times latency improvement with Optimized Reads for the same workload, with the average latency of a transaction per second (TPS) measured at the client as 11.5 milliseconds on the db.r6gd.8xlarge when compared to 60 milliseconds on the db.r6g.8xlarge instance (lower is better). Each sysbench transaction runs 18 SQL statements involving SELECT and DML queries.

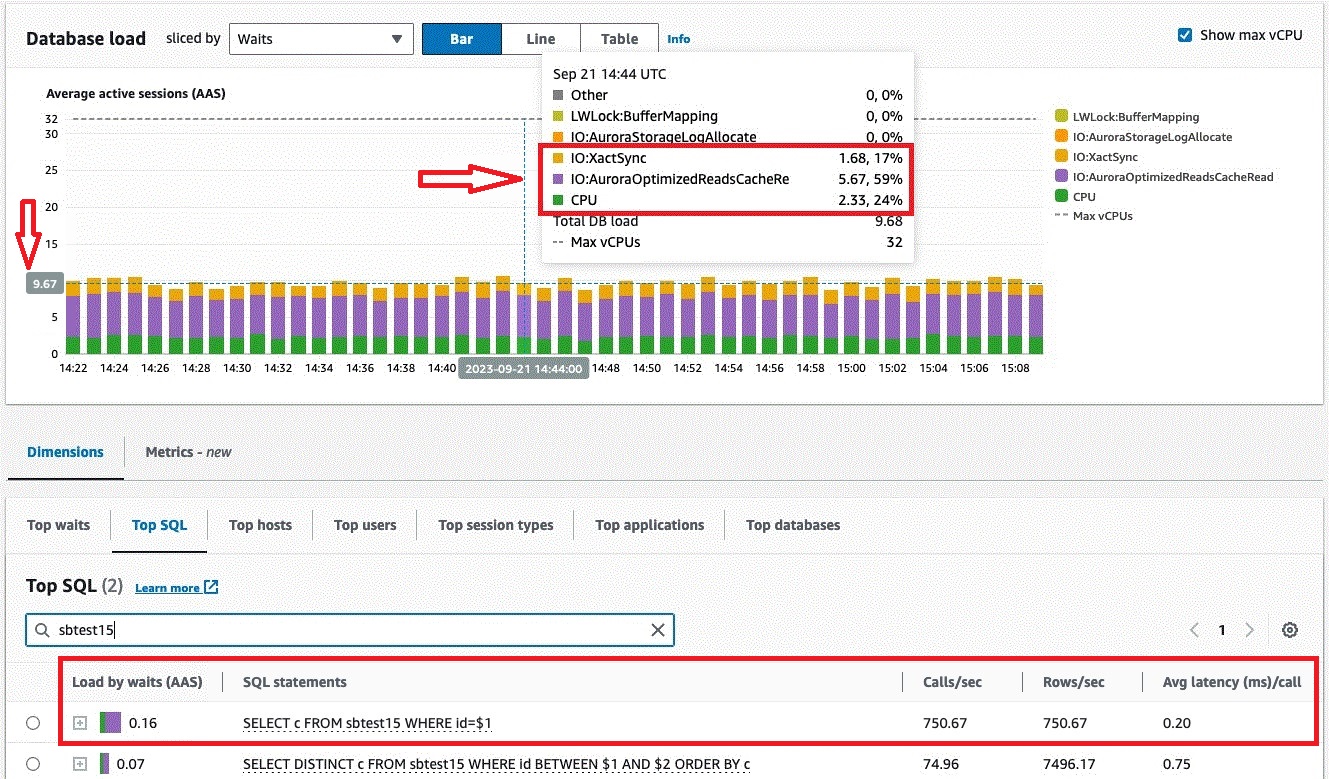
Let’s analyze the latency profile of sysbench queries at the server side. Amazon RDS Performance Insights provides deeper visibility into the database load, wait events, and top SQLs on the Aurora instance. The following figures show the Performance Insights dashboard for the benchmark runs on db.r6g.8xlarge and db.r6gd.8xlarge. The Top SQL section in the screenshots shows the average latency of individual SQL statements, measured on the Aurora DB instance, excluding network latency between the client and the DB instance. From the dashboard, we can see for the point select query (SELECT c FROM sbtest15 WHERE id=$1), average latency is reduced from 1.84 milliseconds to 0.20 milliseconds (lower is better), which is nine times faster.
The following screenshot shows the Performance insights database load on db.r6g.8xlarge (without Optimized Reads).

The following screenshot shows the Performance insights database load on db.r6gd.8xlarge (with Optimized Reads).
The following chart shows 9x improvement in point query latency that’s measured at the database side for the sysbench run with Optimized Reads.

Next, we compared the load profile and wait events for both test runs. From the dashboard, we see the overall database load was significantly reduced from 64.9 average active sessions to 9.6 average active sessions. Also, the top wait event IO:DataFileRead was replaced with IO:AuroraOptimizedReadsCacheRead, which indicates the I/O is on the local NVMe storage instead of Aurora storage. These factors also contributed to optimized CPU usage for the test run with Optimized Reads. In the following screenshot, we observed that the Amazon CloudWatch average CPUUtilization metric showed 30% CPU (with Optimized Reads) when compared to 45% CPU without Optimized Reads.

Using the same benchmark environment as the previous latency test, we also conducted a sysbench throughput test without specifying a fixed rate and observed the peak throughput increased 2.6 times, from 1,732 TPS to 4,594 TPS (higher is better).
Both latency and throughput sysbench tests showed read-intensive queries can scale higher with Optimized Reads before needing larger instances, improving price-performance for OLTP workloads.
Monitoring Optimized Reads
This section provides a brief overview of the monitoring options to understand the tiered cache usage.
Database-level monitoring
On the Optimized reads enabled instances, you can run an explain command to check if your queries are benefitting from the tiered cache, as shown in the following code. We have introduced the aurora_orcache_hit and aurora_storage_read fields to the Buffers section of the explain plan. These columns are shown only when the hit is greater than zero. The read field shows the sum of aurora_orcache_hit and aurora_storage_read.
We have published useful functions such as aurora_stat_optimized_reads_cache() and aurora_stat_statements() as part of this launch. The function aurora_stat_optimized_reads_cache() calculates the total available and used Optimized Reads cache size. The following is an example output on an r6gd.8xlarge instance:
The function aurora_stat_statements() requires the extension pg_stat_statements to be enabled. This function includes the columns of pg_stat_statements with the new columns such as orcache_blks_hit and orcache_blk_read_time to provide insights on the Optimized Reads cache. For more details on all functions supported in Aurora, see Aurora PostgreSQL functions reference.
Amazon CloudWatch
Aurora publishes a number of metrics in CloudWatch for monitoring the health and performance of your DB instances. For more details, refer to Overview of Amazon Aurora and Amazon CloudWatch. With the introduction of Optimized Reads, we are adding additional CloudWatch metrics such as ReadIOPSEphemeralStorage, ReadLatencyEphemeralStorage and AuroraOptimizedReadsCacheHitRatio to understand the performance of the local NVMe storage. These metrics are visible only on Optimized Reads-enabled instances. For more information on the Optimized reads related metrics and how to set up alarms for monitoring, see Amazon CloudWatch metrics for Amazon Aurora.
Aurora also introduced new wait events such as IO:AuroraOptimizedReadsCacheRead and IO: AuroraOptimizedReadsCacheWrite to provide visibility on the tiered cache reads and writes (See Amazon Aurora PostgreSQL wait events). Additionally, Performance insights has added performance counters and SQL statistics related to the Optimized Reads feature (see Performance Insights counters for Aurora PostgreSQL and SQL statistics for Aurora PostgreSQL).
When to use the Optimized Reads tiered cache
You should consider this feature when your working dataset is greater than the instance memory and your applications are latency sensitive. You can evaluate if your existing workloads are a good fit by reviewing the monitoring data of your Aurora instances. For example, the CloudWatch metric BufferCacheHitRatio shows the efficiency of your DB instance buffer pool utilization and the metric AuroraEstimatedSharedMemoryBytes gives an estimate of working set size based on a small sliding window of time. Additionally, monitoring I/O wait events such as IO:DataFileRead by using Performance Insights will help you understand the impact of slow query performance due to reading data from Aurora storage. After you have analyzed these metrics, you can simply test the Optimized Reads feature with your production-equivalent workload by cloning your Aurora cluster and launching an Aurora instance with Optimized Reads-supported instance types.
Overview of Optimized Reads temporary objects
The temporary objects capability benefits workloads with complex queries (GROUP BY, sorts, DISTINCTs, index builds) that often need more memory than available to sort data using temporary files, such as on-demand or dynamic reporting queries that include common table expressions (CTEs). This capability is available in Aurora PostgreSQL Standard and I/O-Optimized storage configurations on supported db.r6gd and db.r6id instance classes. By default, Aurora allocates around 90% of the NVMe storage for temporary objects unless the tiered cache is enabled, then it’s configured as twice the instance memory. To use this capability, you just need to provision a new Aurora cluster or modify your existing cluster with the supported “d” instance type.
PostgreSQL uses a temporary work area for several operations, including to hold intermediate results to build indexes, and sort or group records for queries. Amazon Aurora PostgreSQL provides the parameters work_mem and maintenance_work_mem to determine the maximum amount of memory to be used by each individual query operation, like sorts or hash tables. When more space is needed by an operation, Amazon Aurora PostgreSQL writes data into temporary files. With Optimized Reads-enabled instances, these temporary files as well as temporary tables (created using the create temp table command) are automatically mapped to the local NVMe storage instead of Amazon EBS, to deliver improved query performance and faster index rebuild operations. The location of the disk is set using the PostgreSQL configuration setting temp_tablespaces, and the value aurora_temp_tablespace (as shown in the following code) indicates that it’s mapped to NVMe storage. For more information, see Temporary storage limits for Aurora PostgreSQL.
Conclusion
In this post, we discussed the newly launched Aurora Optimized Reads feature now available on db.r6gd and db.r6id instance classes. The key benefits of Optimized Reads are improved throughput with up to eight times faster response time and optimal performance for temporary data processing. This feature provides a more cost-effective solution for customers with latency-sensitive and large dataset applications to meet their performance SLAs.
The instance classes with Optimized Reads enabled are priced differently than others. To see pricing examples, refer to Amazon Aurora Pricing.
You can start using the Optimized Reads feature today by visiting the Amazon RDS console and spinning up a supported Aurora instance. For more information, refer to the Aurora User Guide.
About the authors
 Gowri Balasubramanian is a Senior Manager, Specialist Solutions Architect team at Amazon Web Services. He focuses on accelerating customer adoption of AWS databases and developing prescriptive guidance mechanisms to help customers in their cloud journey. He helps develop Solutions Architects’ database skills and guide them to deliver the best database solutions for their customers.
 Jeremy Schneider is a Database Performance Engineer at Amazon Web Services who works with customers and engineers of RDS Open Source PostgreSQL and Amazon Aurora PostgreSQL.
 Peipei Yin is a Senior Developer in Aurora PostgreSQL team at Amazon Web Services. She has led the development of Aurora PostgreSQL Optimized Reads.