AWS for Industries
Enabling the aggregation and analysis of The Cancer Genome Atlas using AWS Glue and Amazon Athena
The Cancer Genome Atlas (TCGA) is a landmark cancer genomics program, producing molecular data for nearly 20,000 primary tumors and matched normal tissues from 11,328 patients across 33 cancer types. The TCGA includes germline and somatic variants, copy number variants, mRNA expression, miRNA expression, DNA methylation, and protein expression for most patients. In addition to the molecular data, it also contains well organized metadata including race, sex, ethnicity, and clinical information. This rich source of cancer genomics data has enabled researchers all over the world to make groundbreaking discoveries, resulting in hundreds of publications. TCGA is hosted on the Genomic Data Commons (GDC) from the National Cancer Institute (NCI) and uses the Gen3 framework to store and access data. In addition, all of the TCGA data is also stored on the AWS cloud, as part of the Registry of Open Data. There are two tiers of available data: the open tier and controlled access tier. The open tier includes de-identified clinical and demographic data, gene expression, somatic variants, copy number, and epigenetic data. The controlled access tier includes the raw sequence data, as well as other information, like germline variants.
The open access TCGA data on the Registry of Open Data on AWS makes the data accessible to anyone doing analysis on the AWS cloud. The Genomics Data Commons based on the Gen3 data dictionary serves data files at a per-patient level through a python or REST API. However, most end users and researchers prefer that data be aggregated at a project level for downstream analysis. The data needs to undergo a transformation in order to aggregate the data into a format that is usable for analysis and querying. The process of transforming and preparing the data for downstream analysis using the Gen3 API can be challenging, and requires some technical expertise.
In this post, we outline how to transform the data in an efficient and cost-effective manner using AWS Glue, which allows for interactive querying and downstream analysis and visualization using Amazon Athena via an R interface. We demonstrate how to combine clinical and aggregated molecular data for clustering breast cancer genes by expression to identify patterns in patient survival.
The following steps are involved in preparing the data for querying and analysis:
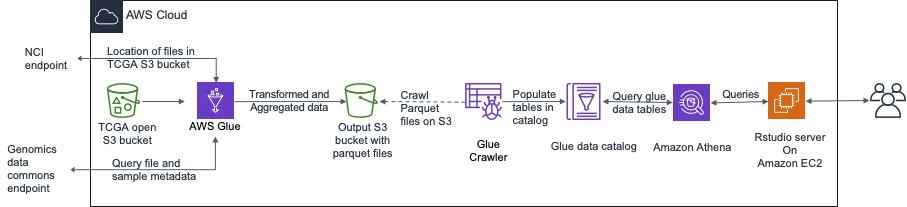
- Query the Genomic Data Commons endpoint using their Python API for the specific project (e.g., TCGA breast cancer) and data type (e.g., RNASeq gene expression quantification) required. The returned result is a JSON object containing the metadata that can then be used in a subsequent query to an NCI endpoint to find the file path in Amazon S3.
- Use AWS Glue to read the individual files in parallel using Spark, and transform it into an aggregated, compressed, columnar Parquet format. AWS Glue data crawlers then crawl the data to create tables in the AWS Glue data catalog.
- Query the data through Amazon Athena using Rstudio through a JDBC connector, and perform downstream analysis and visualization.
The high-level architecture is shown in the following image.
Prerequisites
To deploy the solution in this post, you must have:
- An AWS account, preferably with administrator permissions
- A default VPC with a public subnet (or private subnet with a NAT gateway)
How to deploy
Use the template to deploy the necessary resources into your AWS account in an existing VPC. The following user inputs are required:
| Parameter Name | Parameter Value |
| Stack Name | Can be any string |
| S3 Bucket Name | Name of output S3 bucket for results |
| Existing Bucket? | True if bucket exists, otherwise false |
| Password | Password for “rstudiouser” login to Rstudio server |
| VPC ID | Pick VPC in which to deploy |
| Subnet ID | Pick any public subnet or private subnet with NAT |
| Access CIDR Range (optional) | Default:0.0.0.0/0 allows access from anywhere. Set to your IP address or IP address block if you want to restrict access |
| Rstudio server instance type (optional) | Select EC2 instance type depending on memory and compute requirements |
| R Home directory Size (optional) | Default: 20GB. Size of Rstudio user local data store in GB |

For insights into the appropriate Amazon EC2 instance types and advanced settings, see Running R on AWS.
Click through the defaults in the next two screens and accept the condition at the bottom to create the resources. It will take a few minutes to create all the resources.
Once the stack has been created, there will be several resources created, including the output S3 bucket, AWS Glue jobs, workflows, and the Rstudio server EC2 instance.
Aggregate and transform data in AWS Glue
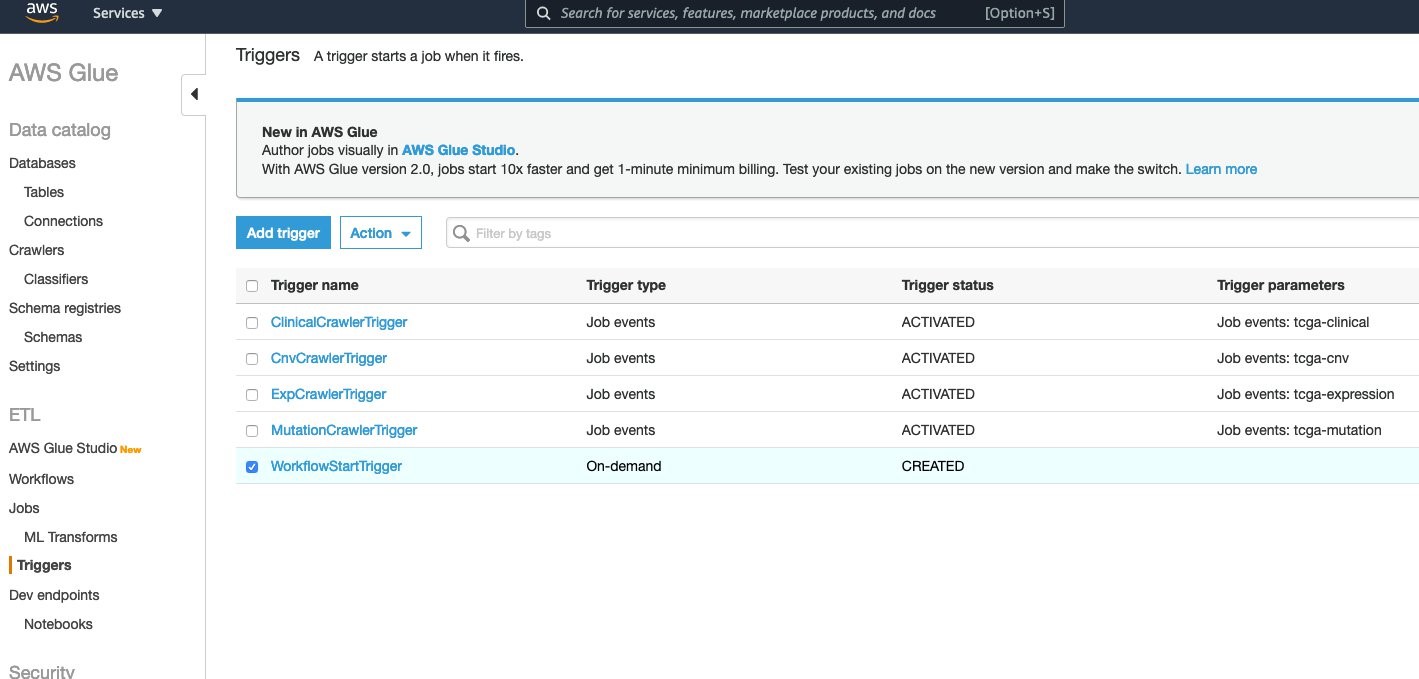
The previously referenced CloudFormation template creates four AWS Glue jobs and four crawlers, one each for Gene Expression, Somatic Mutations, Gene Copy Number and Clinical (BCR Biotab) data. Once the AWS Glue jobs have aggregated the project data into parquet files, the crawler will update the data catalog tables. The AWS Glue workflow ties all these steps together, as shown in the following image.

To kick off the workflow, the Workflowstart Trigger needs to be started. Under the AWS Glue console, go to Triggers and choose WorkflowStartTrigger.
The default project that was specified in the CloudFormation template is the “TCGA-BRCA” project. To get data for a different TCGA project, the input parameters to the workflow need to be edited. For the expression job, workflow type can also be specified. The default is “HTSeq – FPKM-UQ”.
After selecting the WorkflowStart Trigger, click Action → Edit Trigger. Click through the first screen. In the second screen, edit the parameter as shown for each of the four jobs as you scroll down the screen.

Click through the rest of the screens and save the workflow. Then, start the trigger by selecting Actions → Start Trigger. This kicks off all the jobs in the workflow. When they successfully complete, the AWS Glue crawlers will be kicked off.
The individual AWS Glue jobs and crawlers can also be run separately, if, for example, you need only gene expression and clinical data, and not the other data types.
The AWS Glue jobs typically each take between one and four minutes in us-east-1 (the TCGA open data is in this region), however, this is dependent on the region that you are running in. Jobs could take longer in other regions. The crawlers each take a minute or less, and once they are done, the tables can be viewed under the Tables tab in the AWS Glue console.
The workflow or individual jobs can be re-run for different TCGA projects by providing different values for the “project” input. The expression job can also be run for different workflow types.
Since different TCGA projects have the same column headers (schema) for Gene Copy Number and Mutations, they are all combined into a single table, partitioned by Project ID. When querying these tables, the “partition_0” field is used to fetch the data for a specific project. However, for the Gene Expression tables, since each project has different column headers (Sample IDs), different tables are created for each project (e.g., tcga_brca_expression, tcga_luad_expression, etc). Note that the first time the expression AWS Glue job is run, there is only a single “tcga_expression” table created. But when the expression AWS Glue job is run again for a different project, AWS Glue creates tables for each project because the schema is completely different across TCGA projects.
 Query using R
Once the tables are populated into the AWS Glue data catalog, they can be queried using the R JDBC connector to Athena. The R libraries required for this are already installed on the Rstudio server instance that was created. To find the link to the Rstudio server instance, go to the Outputs tab on the CloudFormation console and click on the RstudioURL. It may take up to ten minutes for the Rstudio installation to complete and for the webpage to load.

When you get to the Rstudio server login screen, log in using the username “rstudiouser” and the password you entered in the CloudFormation template.
To set up the connection to Athena for querying the created TCGA tables, run these commands once you are logged into the Rstudio server:
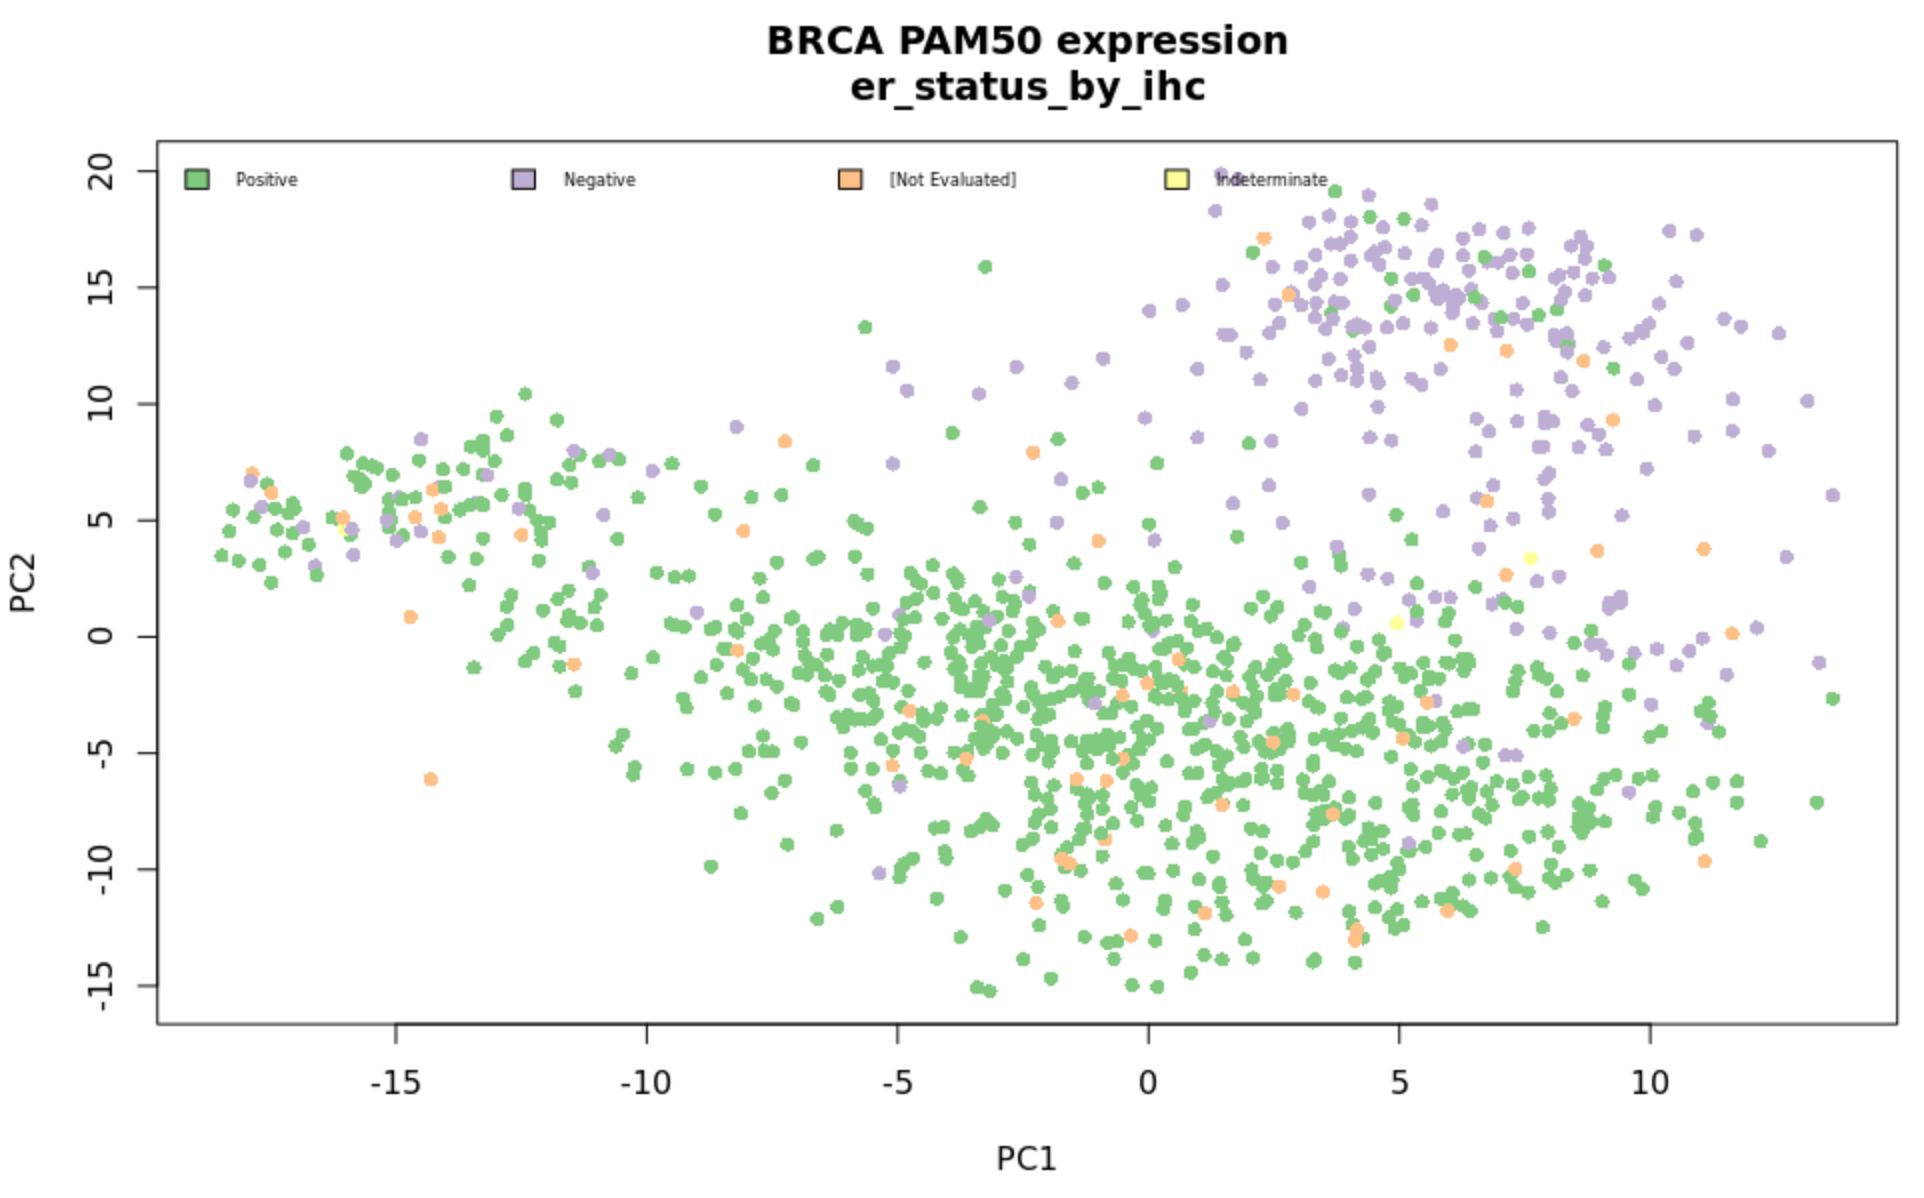
R packages for mapping gene IDs and calculating survival curves are included in the deployment. This includes based modules (‘dplyr’, ‘rJava’, ‘RJDBC’, ‘AWR.Athena’, ‘ggplot2’, ‘BiocManager’) and those available at runtime (‘biomaRt’, ‘DESeq2’). An example script is available in the GitHub repo demonstrating how to cluster samples by PCA, color by clinical features, and plot survival curves by biomarker status as shown in the following figures.

Cost and performance considerations
With this solution, data doesn’t need to be stored in databases that incur database management and maintenance costs. The AWS Glue ETL jobs only need to be run once for each dataset, as long as the data doesn’t change. Jobs are charged based on the time to process the data. For example, a four-minute AWS Glue ETL job that uses 10 data processing units (DPU) would cost:
0.44 per DPU-hour * 10 DPUs * 4 minutes / 60 = $0.29
The first million objects stored in AWS Glue data catalogs are within the free tier.
Athena queries are charged by the amount of data traversed to return a result ($5 per TB of data traversed). All the data is stored in S3 in compressed Parquet, which incurs $0.023 per GB. For example, all of the breast cancer data in this example is compressed parquet and less than 1 GB.
A query that spans 100 MB would cost:
5 / 10000 = $0.0005
The charges for the EC2 instance that runs Rstudio server would depend on the chosen instance type and the number of hours it is run. For more information, see Amazon EC2 On-Demand Pricing.
Conclusion
Though this post focused on TCGA data, this method can be applied to any dataset from the Genomic Data Commons or other data commons using the Gen3 framework. When using AWS Glue and Athena with data stored on S3, this can easily be extended to other omics data generated by an organization, and data can easily be combined to perform complex queries and analysis. The ETL steps only need to be performed once per dataset, and the transformed data, in a compressed, efficient, columnar format like Parquet, can be made available to multiple users in an organization.
Learn more about Healthcare & Life Sciences on AWS. If you have questions or comments, let us know in the comments section below. Or, you can reach out to us directly.