AWS Cloud Operations Blog
Announcing AWS CDK Observability Accelerator for Amazon EKS
Today we are happy to announce the all-new AWS CDK Observability Accelerator – a set of opinionated modules to help you set up observability for your AWS environments with AWS Native services and AWS-managed observability services such as Amazon Managed Service for Prometheus, Amazon Managed Grafana, AWS Distro for OpenTelemetry (ADOT) and Amazon CloudWatch. AWS CDK Observability Accelerator simplifies the observability provisioning and maintenance process for Amazon EKS clusters using a one-click solution with AWS Cloud Development Kit (AWS CDK) and CDK EKS Blueprints. AWS CDK is an open-source software development framework used to model and provision your cloud application resources with familiar programming languages. AWS CDK enables you to define your infrastructure with code and provision it through AWS CloudFormation. You get all the benefits of CloudFormation, repeatable deployments, easy rollbacks, and drifts detection from the AWS console. EKS Blueprints is a collection of Infrastructure as Code (IaC) modules that will help you configure and deploy consistent, batteries-included EKS clusters across accounts and regions.
AWS CDK Observability Accelerator deploys out-of-the-box solutions helping customers to derive insights from their Amazon EKS cluster components, applications, and infrastructure. The CDK version is structured around patterns: repeatable units of deployments for multiple resources. The AWS native pattern solution deploys an out-of-the-box, end-to-end observability on Amazon EKS using Amazon CloudWatch Container insights. The open source observability pattern deploys an out of the box, end-to-end observability on Amazon EKS that sets up Amazon Managed Grafana dashboards, AWS Distro for OpenTelemetry collector to collect metrics and store them on Amazon Managed Service for Prometheus. If you already have an existing EKS cluster, you can deploy CDK observability patterns using one-click deployments on your pre-existing cluster.
In this post we will show you how to use AWS CDK Observability Accelerator to apply the following observability patterns to a single Amazon EKS cluster:
- Open-source observability using AWS-managed open-source services
- AWS native observability using Amazon CloudWatch
Open-source observability pattern
In this pattern, we will provision a new EKS cluster and deploy an end-to-end observability with AWS Managed open-source services such as Amazon Managed Service for Prometheus, Amazon Managed Grafana. We will leverage GitOps to manage Grafana dashboards and data sources declaratively in a Git repository. To learn more about GitOps and our integration with AWS Managed Grafana, please check our blog post on Using Open Source Grafana Operator on your Kubernetes cluster to manage Amazon Managed Grafana.
This solution deploys the following components:
- One ready to use Amazon EKS cluster.
- AWS Distro For OpenTelemetry Operator and Collector for collecting metrics and traces
- Capturing logs to Amazon CloudWatch using AWS for FluentBit
- Grafana Operator to add AWS data sources and create Grafana dashboards in Amazon Managed Grafana
- Flux to perform GitOps sync of a Git repository to EKS Cluster. We will use this for creating Grafana dashboards and AWS data sources in Amazon Managed Grafana. You can also fork aws-observability-accelerator Git repository and add your own Grafana resources such as dashboards and data sources. Please check our GitOps with Amazon Managed Grafana module in One Observability Workshop to learn more on this topic
- External Secrets Operator to retrieve and sync the Grafana API keys from AWS Systems Manager
- Data sources and dashboards on Amazon Managed Grafana dashboards
The architecture can be visualized as follows:
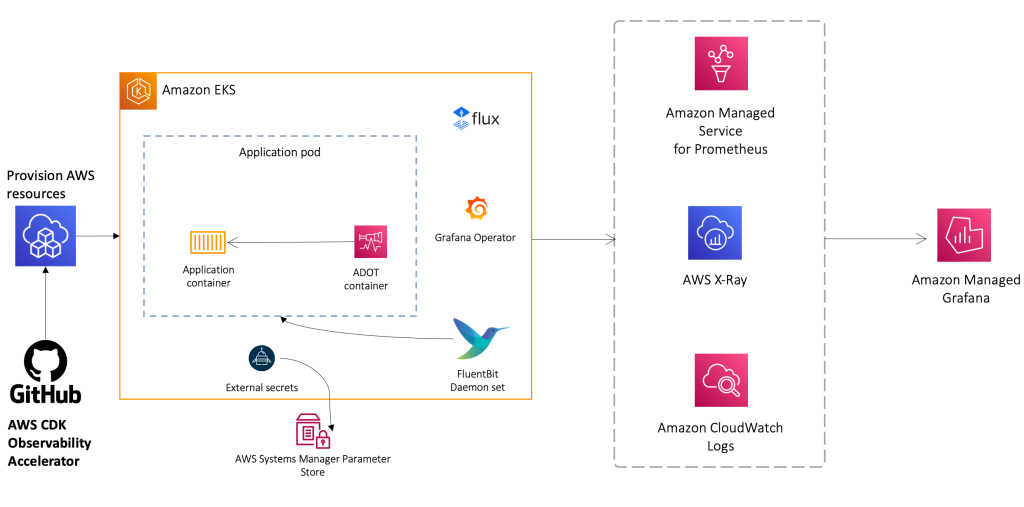
Figure 1. Architecture of Open-source observability pattern
Prerequisites
You will need the following to complete the steps in this post. Please check on the readme instructions of the repository to learn more about environment setup:
- AWS CLI version 2
- AWS CDK version 2.86.0 or later
- Homebrew to install required packages for MacOs or Linux
- An existing Amazon Managed Grafana Workspace
- Node version 18.16.0 or later
- NPM version 9.6.0 or later
- Kubectl
- Git
- Make
Let’s start by setting a few environment variables:
Next, let’s get the workspace id of any existing Amazon Managed Grafana workspace:
Next, let’s create a Grafana API key from Amazon Managed Grafana workspace and setup a secret in AWS Systems Manager. The secret will be accessed by the External Secrets add-on and made available as a native Kubernetes secret in the Amazon EKS cluster:
Bootstrap CDK
The first step to any CDK deployment is bootstrapping the environment. cdk bootstrap is a tool in the AWS CDK command-line interface (AWS CLI) responsible for preparing the environment (i.e., a combination of AWS account and AWS Region) with resources required by CDK to perform deployments into that environment. CDK bootstrapping is needed for each account/region combination, so if you already bootstrapped CDK in a region, you don’t need to repeat the bootstrapping process.
Execute the commands below to bootstrap the AWS environment in your region:
Deploy the open-source observability pattern
Clone the cdk-aws-observability-accelerator repository and install the dependency packages. This repository contains CDK v2 code written in TypeScript.
To work with patterns use:
Example:
Patterns:
The actual settings for Grafana dashboard json files are expected to be specified in the CDK context. Generally, such settings are specified inside the cdk.context.json file of the current directory or in ~/.cdk.json in your home directory. You will need to update the context in cdk.json file located in cdk-aws-observability-accelerator directory.
Example settings:
Now, let’s run the below command to deploy the open-source observability pattern:
Run update-kubeconfig command. You should be able to get the command from the CDK output message.
Validate the access to your EKS cluster using below kubectl listing all namespaces:
Next, lets verify all grafanadashboards resources are created in grafana-operator namespace:
Visualization of Grafana dashboards in Amazon Managed Grafana
Login to your Amazon Managed Grafana workspace and navigate to the dashboards panel. You should see a list of dashboards under the Observability Accelerator Dashboards

Figure 2. Observability Accelerator Dashboards
Open the Node Exporter dashboard and you should be able to view its visualization as shown below:

Figure 3. Node Explorer Dashboard
Open the Kubelet dashboard and you should be able to view its visualization as shown below:

Figure 4. Kubelet Dashboard
AWS Native Observability Pattern
In this pattern, we will provision a new EKS cluster and set up end-to-end observability using Amazon CloudWatch. This solution uses CloudWatch Container Insights to collect metrics and logs from the EKS cluster. Amazon CloudWatch Container Insights helps customers collect, aggregate, and summarize metrics and logs from containerized applications and microservices. Metrics data is collected as performance log events using Embedded Metric Format. These performance log events use a structured JSON schema which enables high-cardinality data to be ingested and stored at scale. From this data, CloudWatch creates aggregated metrics at the cluster, node, pod level as CloudWatch metrics. The metrics that Container Insights collects are automatically available in CloudWatch dashboards. By combining Container Insights and CloudWatch logs, we are able to provide a foundation for EKS observability with this pattern.
This solution deploys the following:
- One ready to use Amazon EKS cluster.
- AWS Distro For OpenTelemetry Operator and Collector for exporting metrics to CloudWatch
- AWS for FluentBit for capturing logs on Amazon CloudWatch
- Sets up Container Insights to collect metrics from Amazon EKS cluster
The architecture can be visualized as follows:

Figure 5. Architecture of Open-source observability pattern
Deploy the AWS-native observability pattern
Let’s start by setting a few environment variables:
Run update-kubeconfig command. You should be able to get the command from CDK output message.
Validate the access to your EKS cluster using below kubectl listing all namespaces:
kubectl get ns
Visualization using Amazon CloudWatch
Navigate to Amazon CloudWatch in AWS Console and then navigate to “Container Insights” and view the Container Map:

Figure 6. Container Map
Next, navigate to view the resource list :

Figure 7. Resource list
Next, navigate to view the Performance Monitoring dashboard:

Figure 8. Performance dashboard
Next, navigate to Log Insights in CloudWatch. In the dropdown, select any of the logs that begin with /aws/eks/single-new-eks-awsnative-observability-accelerator and run a query. Below is an example of a query with the kube-system log group:

Figure 9. Query example with the kube-system log group.
Result of the query:

Figure 10. Query result
Cleanup
You continue to incur cost until deleting the infrastructure that you created for this post. Use the commands below to delete resources created during this post:
Conclusion
In this blog, we talked about our launch announcement of AWS CDK observability accelerator which simplifies the process of setting observability on Amazon EKS cluster with a one-click solution using AWS Cloud Development Kit. We previously launched a Terraform version which is also available for Terraform users. These accelerators deploy out-of-the-box solutions to help customers derive insights regarding their Amazon EKS cluster components, applications, and infrastructure. We demonstrated both AWS native and open-source observability patterns for end-to-end observability on Amazon EKS. We are currently working on a list of exciting patterns for both AWS native and open-source observability. We recommend that you try out all these patterns as we get these out and continue to support and contribute to our AWS CDK observability accelerator open source project.
For more information, see the following references:
- AWS Observability Best Practices Guide
- One Observability Workshop
- Terraform AWS Observability Accelerator
- CDK AWS Observability Accelerator