AWS Cloud Operations Blog
Cloud Native Application Monitoring for AWS
This blog post will show you how DXC used AWS management tools and services to create a custom cloud native application monitoring framework. DXC made this advanced monitoring offering available to their customers, which resulted in improved customer satisfaction.
The business driver
DXC has a robust set of tools and capabilities to solve customers’ application monitoring and alerting needs across on-premises and cloud environments. With an increasing number of customers deploying their applications on AWS, DXC decided to add an AWS native application monitoring and alerting solution to their existing portfolio.
The solution
We built a solution for DXC customers that uses the following AWS services and features:
- Amazon CloudWatch
- Amazon CloudWatch Synthetics
- Amazon CloudWatch alarms
- AWS X-Ray
- AWS Lambda
- AWS Step Functions
The following diagram shows a high-level design of our solution.

Figure 1: Solution map of AWS Cloud native tools
The in-scope applications shown in the diagram need cloud native monitoring. The ITSM tool represents the customer’s ticketing tool where incident details are captured.
Let’s look at how each of these services were applied in the context of the proposed solution.
Application setup for tracing and error detection
The in-scope applications had to be enabled for X-Ray tracing. You can enable tracing by adding the X-Ray SDK for .NET or the X-Ray SDK for Java, depending on your environment, to the application. The application had to be recompiled and redeployed to the EC2 instance before it could start to emit traces. The AWS X-Ray daemon captures these traces and passes them to the X-Ray console.
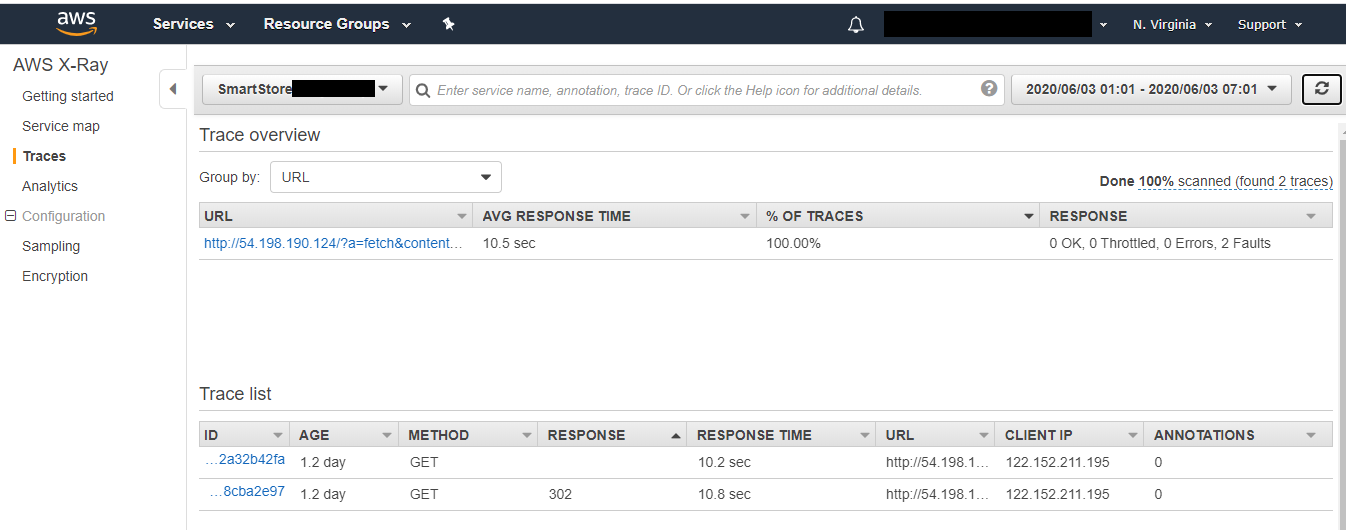
Figure 2: Traces page in the AWS X-Ray console
X-Ray publishes custom metrics to CloudWatch for the groups we defined.

Figure 3: Metrics page of the Amazon CloudWatch console where the X-Ray group is defined

Figure 4: Custom metrics in the Amazon CloudWatch console
We added a CloudWatch alarm to this custom exception metric data. The alarm is triggered when an exception is captured as part of the X-Ray trace data, as shown here in Figure 5:

Figure 5: Alarm configured in the Amazon CloudWatch console
Automated ticketing and resolution
We now had the ability to capture application traces, send them to X-Ray, and raise an alarm for exception conditions. Next, we wanted to add the ability to automatically create tickets in our customers’ ticketing system. AWS serverless computing services such as Step Functions and AWS Lambda proved to be a great choice to integrate and orchestrate error reporting to ITSM tools and send notifications to stakeholders. The serverless components provide advantages such as automatic scale. They are also low maintenance because patches and updates are handled by AWS. We improved the solution further through the use of an automatable resolution pattern. This made it possible to identify and automate the resolution of frequently occurring tickets, eliminating the need for manual intervention.
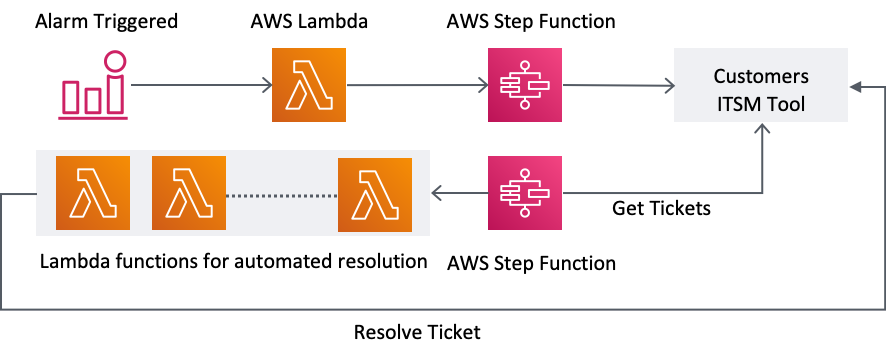 Figure 6: Automated ticket creation and resolution
Benefits
The following are some of the benefits of this solution:
- A reduction in the meantime to resolution (MTTR).
- Due to its integration with ITSM and the automation of frequently occurring tickets, an up to 30% savings in operational costs.
- Increased application uptime.
- Application owners can focus on their core business instead of the undifferentiated heavy lifting of monitoring and managing applications.
- The ability to take appropriate action before end users encounter issues.
Conclusion
You can perform advanced application monitoring and gain observability for applications running in AWS by using services such as CloudWatch, X-Ray, Lambda, and Step Functions. You can also improve your agility and reduce time by automating operational tasks such as ITSM ticketing.
About the authors
|
|
Asif Fouzi is a Senior Solutions Architect with AWS and is part of the Global Service Integrators (GSI) team helping GSI’s like DXC in their cloud journey. When he is not innovating on behalf of customers, he likes to play guitar, travel and spend time with his kids |
 |
Vikram Srivatsa is a Senior Architect and part of the Worldwide Applications Service Line at DXC Technology and is based out of Bengaluru, India. He comes with vast experience in architecting enterprise applications and his current area of focus includes creation of Cloud native Solutions for the Enterprise. |
